

Key Insights
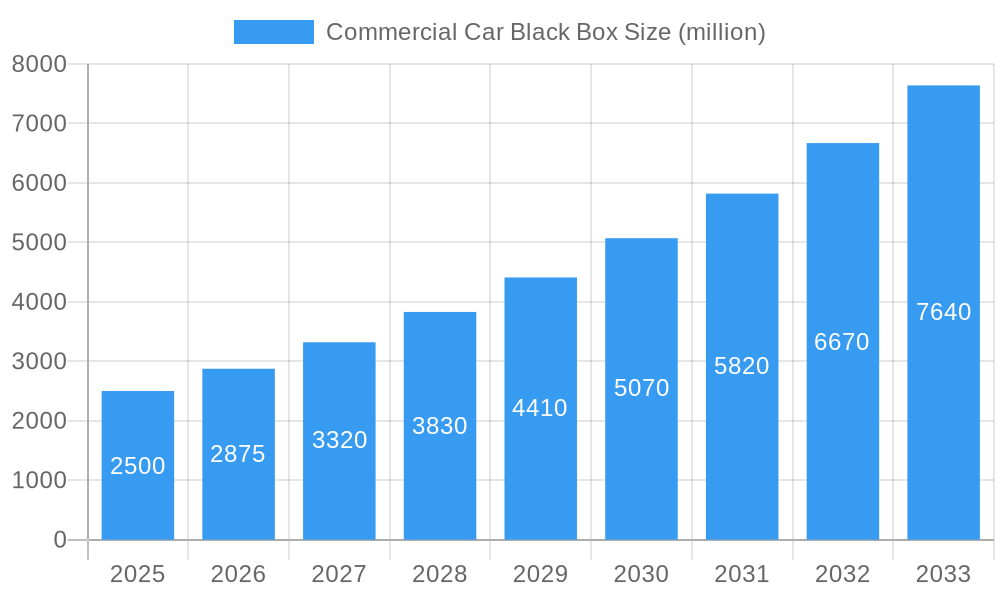
The commercial car black box market is experiencing robust growth, driven by increasing demand for fleet management solutions, enhanced driver safety, and stricter regulations regarding vehicle operations. The market's expansion is fueled by the need for businesses to optimize fuel efficiency, reduce operational costs, and improve driver behavior through real-time monitoring and data analysis. Technological advancements, such as the integration of AI and advanced telematics capabilities, are further propelling market growth. While initial investment costs can be a barrier to entry for some businesses, the long-term benefits of reduced insurance premiums, improved safety records, and increased operational efficiency outweigh these costs. We estimate the market size to be approximately $2.5 billion in 2025, exhibiting a Compound Annual Growth Rate (CAGR) of 15% from 2025 to 2033. This growth is projected across various segments, including those based on vehicle type (trucks, buses, vans), communication technology (GPS, cellular), and features (video recording, driver behavior monitoring, accident reconstruction). Competitive landscape analysis reveals a diverse range of established players such as VDO, Garmin, and Blackvue, alongside emerging companies continuously innovating within the market. The market is expected to witness increasing consolidation as larger players acquire smaller companies to enhance their product portfolios and geographical reach.
Commercial Car Black Box Market Size (In Billion)
The market's growth trajectory is influenced by several factors. The increasing adoption of telematics systems by transportation companies is a key driver. Government mandates for mandatory black box installation in commercial vehicles in certain regions are also significantly contributing to market growth. However, data security concerns, high initial investment costs, and the need for reliable infrastructure (particularly in areas with limited network coverage) are posing challenges to the market's expansion. The ongoing development of more user-friendly and cost-effective solutions will be crucial in mitigating these restraints. Future growth is expected to be significantly driven by the integration of IoT, artificial intelligence, and advanced analytics to extract meaningful insights from the captured data, leading to more effective fleet management strategies and significant cost savings for businesses.
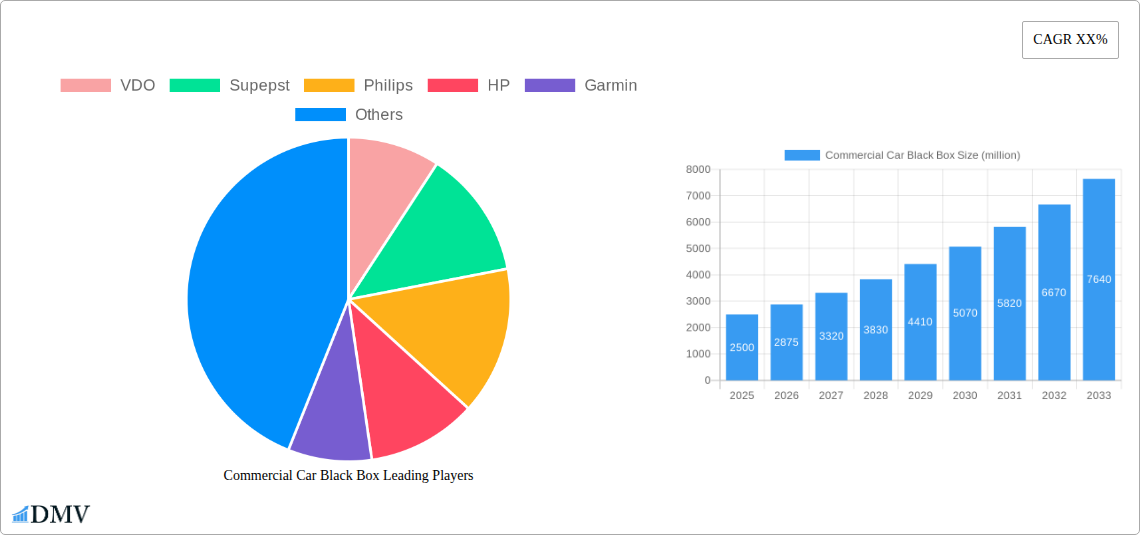
Commercial Car Black Box Company Market Share
Commercial Car Black Box Market Report: A Comprehensive Analysis (2019-2033)
This insightful report provides a comprehensive analysis of the global Commercial Car Black Box market, offering a detailed examination of market trends, leading players, technological advancements, and future growth prospects. The study covers the historical period from 2019 to 2024, with a base year of 2025 and a forecast period extending to 2033. The report projects a market value exceeding $XX million by 2033, representing substantial growth driven by increasing adoption across various commercial vehicle segments. This in-depth analysis will empower stakeholders to make informed decisions and capitalize on emerging opportunities within this dynamic market.
Commercial Car Black Box Market Composition & Trends
This section delves into the competitive landscape of the Commercial Car Black Box market, analyzing market concentration, innovation drivers, regulatory influences, substitute products, and end-user profiles. The report examines the market share distribution among key players such as VDO, Supepst, Philips, HP, Garmin, Blackvue, Eheak, Samsung-anywhere, Incredisonic, Auto-vox, Cansonic, Papago, DOD, DEC, Blackview, Jado, Careland, Sast, Kehan, DAZA, GFGY Corp, Wolfcar, MateGo, Newsmy, and Shinco. The market is characterized by a moderately consolidated structure, with the top five players holding an estimated XX% market share in 2025.
- Market Concentration: The market exhibits moderate consolidation, with top players holding a significant, but not dominant, share.
- Innovation Catalysts: Advancements in AI, connectivity, and data analytics are driving innovation, leading to more sophisticated features.
- Regulatory Landscape: Government regulations mandating black box installation in commercial vehicles in several regions are boosting market growth.
- Substitute Products: While alternative solutions exist, the comprehensive data and safety features of black boxes provide a strong competitive advantage.
- End-User Profiles: Key end-users include trucking companies, logistics firms, delivery services, and public transportation authorities.
- M&A Activities: The report analyzes completed and anticipated M&A activities, estimating the total value of deals in the past five years at approximately $XX million. Key drivers include expansion into new markets and technological capabilities.
Commercial Car Black Box Industry Evolution
This section details the evolution of the Commercial Car Black Box industry, analyzing market growth trajectories, technological advancements, and shifting consumer demands over the study period (2019-2033). The industry has witnessed significant growth, driven primarily by increasing safety concerns and the demand for efficient fleet management solutions. Technological innovations such as improved connectivity, advanced analytics, and cloud-based data storage have further propelled market expansion. The market is anticipated to maintain a Compound Annual Growth Rate (CAGR) of XX% during the forecast period (2025-2033). Increased adoption of telematics and advanced driver-assistance systems (ADAS) is further accelerating market growth, with adoption rates expected to reach XX% by 2033.
Leading Regions, Countries, or Segments in Commercial Car Black Box
This section identifies the dominant regions, countries, and segments within the Commercial Car Black Box market. North America currently holds the largest market share, driven by stringent safety regulations and the early adoption of telematics.
Key Drivers for North American Dominance:
- Stringent safety regulations and government mandates.
- High investment in fleet management technologies.
- Well-established telematics infrastructure.
- Strong presence of major black box manufacturers.
Other Key Regions: Europe and Asia-Pacific are also experiencing significant growth, driven by increasing fleet sizes and improving infrastructure. Detailed market analysis is provided for each region and key countries, including market size, growth rates, and key trends. The report further segments the market based on vehicle type (heavy-duty trucks, light-duty trucks, buses, etc.), providing a comprehensive view of each segment's performance and growth potential.
Commercial Car Black Box Product Innovations
Recent innovations focus on enhanced data analytics, improved connectivity, and integration with fleet management systems. New products feature AI-powered accident reconstruction capabilities, real-time driver monitoring, and predictive maintenance functionalities. These advancements provide valuable insights into driving behavior, vehicle performance, and potential safety hazards, contributing to increased efficiency and safety within the commercial vehicle sector. The integration of these advanced functionalities distinguishes modern commercial car black boxes from their predecessors, delivering greater value to fleet operators.
Propelling Factors for Commercial Car Black Box Growth
Several factors contribute to the growth of this market. Technological advancements, such as the integration of AI and improved connectivity, enable better data analysis and enhanced safety features. Stringent government regulations promoting safety in commercial vehicles also drive market expansion. Moreover, the increasing demand for optimized fleet management and reduced operational costs incentivize the adoption of commercial car black boxes.
Obstacles in the Commercial Car Black Box Market
Despite significant growth potential, challenges persist. High initial investment costs, concerns over data privacy, and the potential for supply chain disruptions represent obstacles. Furthermore, intense competition among established players and new entrants could create price pressures and limit profit margins. The complexity of integrating black boxes with existing fleet management systems can also pose an impediment to widespread adoption.
Future Opportunities in Commercial Car Black Box
Future opportunities lie in the development of more sophisticated AI-powered analytics, improved integration with ADAS, and expansion into emerging markets. The incorporation of 5G connectivity will enable real-time data transmission and enhanced functionalities. Additionally, exploring new applications in areas like cargo monitoring and security offers further potential for market growth.
Key Developments in Commercial Car Black Box Industry
- 2022 Q4: VDO launched its new AI-powered black box with advanced driver behavior analysis capabilities.
- 2023 Q1: A merger between two significant players resulted in a combined market share of xx%.
- 2023 Q3: New regulations mandated black box installations in commercial vehicles in several European countries.
- 2024 Q2: Significant advancements in 5G connectivity enhanced data transmission speeds for real-time monitoring.
- (Further key developments will be detailed in the full report.)
Strategic Commercial Car Black Box Market Forecast
The Commercial Car Black Box market is poised for continued strong growth, driven by technological advancements, increasing safety regulations, and the growing demand for efficient fleet management solutions. Emerging markets and the integration of innovative technologies, such as AI and 5G connectivity, will create significant opportunities for market expansion. The forecast anticipates substantial growth throughout the forecast period, with the market exceeding $XX million by 2033.
Commercial Car Black Box Segmentation
-
1. Application
- 1.1. Truck
- 1.2. Bus
- 1.3. Other
-
2. Types
- 2.1. Portable
- 2.2. Integrated
Commercial Car Black Box Segmentation By Geography
-
1. North America
- 1.1. United States
- 1.2. Canada
- 1.3. Mexico
-
2. South America
- 2.1. Brazil
- 2.2. Argentina
- 2.3. Rest of South America
-
3. Europe
- 3.1. United Kingdom
- 3.2. Germany
- 3.3. France
- 3.4. Italy
- 3.5. Spain
- 3.6. Russia
- 3.7. Benelux
- 3.8. Nordics
- 3.9. Rest of Europe
-
4. Middle East & Africa
- 4.1. Turkey
- 4.2. Israel
- 4.3. GCC
- 4.4. North Africa
- 4.5. South Africa
- 4.6. Rest of Middle East & Africa
-
5. Asia Pacific
- 5.1. China
- 5.2. India
- 5.3. Japan
- 5.4. South Korea
- 5.5. ASEAN
- 5.6. Oceania
- 5.7. Rest of Asia Pacific

Commercial Car Black Box Regional Market Share
Geographic Coverage of Commercial Car Black Box
Commercial Car Black Box REPORT HIGHLIGHTS
| Aspects | Details |
|---|---|
| Study Period | 2020-2034 |
| Base Year | 2025 |
| Estimated Year | 2026 |
| Forecast Period | 2026-2034 |
| Historical Period | 2020-2025 |
| Growth Rate | CAGR of 8.9% from 2020-2034 |
| Segmentation |
|
Table of Contents
- 1. Introduction
- 1.1. Research Scope
- 1.2. Market Segmentation
- 1.3. Research Methodology
- 1.4. Definitions and Assumptions
- 2. Executive Summary
- 2.1. Introduction
- 3. Market Dynamics
- 3.1. Introduction
- 3.2. Market Drivers
- 3.3. Market Restrains
- 3.4. Market Trends
- 4. Market Factor Analysis
- 4.1. Porters Five Forces
- 4.2. Supply/Value Chain
- 4.3. PESTEL analysis
- 4.4. Market Entropy
- 4.5. Patent/Trademark Analysis
- 5. Global Commercial Car Black Box Analysis, Insights and Forecast, 2020-2032
- 5.1. Market Analysis, Insights and Forecast - by Application
- 5.1.1. Truck
- 5.1.2. Bus
- 5.1.3. Other
- 5.2. Market Analysis, Insights and Forecast - by Types
- 5.2.1. Portable
- 5.2.2. Integrated
- 5.3. Market Analysis, Insights and Forecast - by Region
- 5.3.1. North America
- 5.3.2. South America
- 5.3.3. Europe
- 5.3.4. Middle East & Africa
- 5.3.5. Asia Pacific
- 5.1. Market Analysis, Insights and Forecast - by Application
- 6. North America Commercial Car Black Box Analysis, Insights and Forecast, 2020-2032
- 6.1. Market Analysis, Insights and Forecast - by Application
- 6.1.1. Truck
- 6.1.2. Bus
- 6.1.3. Other
- 6.2. Market Analysis, Insights and Forecast - by Types
- 6.2.1. Portable
- 6.2.2. Integrated
- 6.1. Market Analysis, Insights and Forecast - by Application
- 7. South America Commercial Car Black Box Analysis, Insights and Forecast, 2020-2032
- 7.1. Market Analysis, Insights and Forecast - by Application
- 7.1.1. Truck
- 7.1.2. Bus
- 7.1.3. Other
- 7.2. Market Analysis, Insights and Forecast - by Types
- 7.2.1. Portable
- 7.2.2. Integrated
- 7.1. Market Analysis, Insights and Forecast - by Application
- 8. Europe Commercial Car Black Box Analysis, Insights and Forecast, 2020-2032
- 8.1. Market Analysis, Insights and Forecast - by Application
- 8.1.1. Truck
- 8.1.2. Bus
- 8.1.3. Other
- 8.2. Market Analysis, Insights and Forecast - by Types
- 8.2.1. Portable
- 8.2.2. Integrated
- 8.1. Market Analysis, Insights and Forecast - by Application
- 9. Middle East & Africa Commercial Car Black Box Analysis, Insights and Forecast, 2020-2032
- 9.1. Market Analysis, Insights and Forecast - by Application
- 9.1.1. Truck
- 9.1.2. Bus
- 9.1.3. Other
- 9.2. Market Analysis, Insights and Forecast - by Types
- 9.2.1. Portable
- 9.2.2. Integrated
- 9.1. Market Analysis, Insights and Forecast - by Application
- 10. Asia Pacific Commercial Car Black Box Analysis, Insights and Forecast, 2020-2032
- 10.1. Market Analysis, Insights and Forecast - by Application
- 10.1.1. Truck
- 10.1.2. Bus
- 10.1.3. Other
- 10.2. Market Analysis, Insights and Forecast - by Types
- 10.2.1. Portable
- 10.2.2. Integrated
- 10.1. Market Analysis, Insights and Forecast - by Application
- 11. Competitive Analysis
- 11.1. Global Market Share Analysis 2025
- 11.2. Company Profiles
- 11.2.1 VDO
- 11.2.1.1. Overview
- 11.2.1.2. Products
- 11.2.1.3. SWOT Analysis
- 11.2.1.4. Recent Developments
- 11.2.1.5. Financials (Based on Availability)
- 11.2.2 Supepst
- 11.2.2.1. Overview
- 11.2.2.2. Products
- 11.2.2.3. SWOT Analysis
- 11.2.2.4. Recent Developments
- 11.2.2.5. Financials (Based on Availability)
- 11.2.3 Philips
- 11.2.3.1. Overview
- 11.2.3.2. Products
- 11.2.3.3. SWOT Analysis
- 11.2.3.4. Recent Developments
- 11.2.3.5. Financials (Based on Availability)
- 11.2.4 HP
- 11.2.4.1. Overview
- 11.2.4.2. Products
- 11.2.4.3. SWOT Analysis
- 11.2.4.4. Recent Developments
- 11.2.4.5. Financials (Based on Availability)
- 11.2.5 Garmin
- 11.2.5.1. Overview
- 11.2.5.2. Products
- 11.2.5.3. SWOT Analysis
- 11.2.5.4. Recent Developments
- 11.2.5.5. Financials (Based on Availability)
- 11.2.6 Blackvue
- 11.2.6.1. Overview
- 11.2.6.2. Products
- 11.2.6.3. SWOT Analysis
- 11.2.6.4. Recent Developments
- 11.2.6.5. Financials (Based on Availability)
- 11.2.7 Eheak
- 11.2.7.1. Overview
- 11.2.7.2. Products
- 11.2.7.3. SWOT Analysis
- 11.2.7.4. Recent Developments
- 11.2.7.5. Financials (Based on Availability)
- 11.2.8 Samsung-anywhere
- 11.2.8.1. Overview
- 11.2.8.2. Products
- 11.2.8.3. SWOT Analysis
- 11.2.8.4. Recent Developments
- 11.2.8.5. Financials (Based on Availability)
- 11.2.9 Incredisonic
- 11.2.9.1. Overview
- 11.2.9.2. Products
- 11.2.9.3. SWOT Analysis
- 11.2.9.4. Recent Developments
- 11.2.9.5. Financials (Based on Availability)
- 11.2.10 Auto-vox
- 11.2.10.1. Overview
- 11.2.10.2. Products
- 11.2.10.3. SWOT Analysis
- 11.2.10.4. Recent Developments
- 11.2.10.5. Financials (Based on Availability)
- 11.2.11 Cansonic
- 11.2.11.1. Overview
- 11.2.11.2. Products
- 11.2.11.3. SWOT Analysis
- 11.2.11.4. Recent Developments
- 11.2.11.5. Financials (Based on Availability)
- 11.2.12 Papago
- 11.2.12.1. Overview
- 11.2.12.2. Products
- 11.2.12.3. SWOT Analysis
- 11.2.12.4. Recent Developments
- 11.2.12.5. Financials (Based on Availability)
- 11.2.13 DOD
- 11.2.13.1. Overview
- 11.2.13.2. Products
- 11.2.13.3. SWOT Analysis
- 11.2.13.4. Recent Developments
- 11.2.13.5. Financials (Based on Availability)
- 11.2.14 DEC
- 11.2.14.1. Overview
- 11.2.14.2. Products
- 11.2.14.3. SWOT Analysis
- 11.2.14.4. Recent Developments
- 11.2.14.5. Financials (Based on Availability)
- 11.2.15 Blackview
- 11.2.15.1. Overview
- 11.2.15.2. Products
- 11.2.15.3. SWOT Analysis
- 11.2.15.4. Recent Developments
- 11.2.15.5. Financials (Based on Availability)
- 11.2.16 Jado
- 11.2.16.1. Overview
- 11.2.16.2. Products
- 11.2.16.3. SWOT Analysis
- 11.2.16.4. Recent Developments
- 11.2.16.5. Financials (Based on Availability)
- 11.2.17 Careland
- 11.2.17.1. Overview
- 11.2.17.2. Products
- 11.2.17.3. SWOT Analysis
- 11.2.17.4. Recent Developments
- 11.2.17.5. Financials (Based on Availability)
- 11.2.18 Sast
- 11.2.18.1. Overview
- 11.2.18.2. Products
- 11.2.18.3. SWOT Analysis
- 11.2.18.4. Recent Developments
- 11.2.18.5. Financials (Based on Availability)
- 11.2.19 Kehan
- 11.2.19.1. Overview
- 11.2.19.2. Products
- 11.2.19.3. SWOT Analysis
- 11.2.19.4. Recent Developments
- 11.2.19.5. Financials (Based on Availability)
- 11.2.20 DAZA
- 11.2.20.1. Overview
- 11.2.20.2. Products
- 11.2.20.3. SWOT Analysis
- 11.2.20.4. Recent Developments
- 11.2.20.5. Financials (Based on Availability)
- 11.2.21 GFGY Corp
- 11.2.21.1. Overview
- 11.2.21.2. Products
- 11.2.21.3. SWOT Analysis
- 11.2.21.4. Recent Developments
- 11.2.21.5. Financials (Based on Availability)
- 11.2.22 Wolfcar
- 11.2.22.1. Overview
- 11.2.22.2. Products
- 11.2.22.3. SWOT Analysis
- 11.2.22.4. Recent Developments
- 11.2.22.5. Financials (Based on Availability)
- 11.2.23 MateGo
- 11.2.23.1. Overview
- 11.2.23.2. Products
- 11.2.23.3. SWOT Analysis
- 11.2.23.4. Recent Developments
- 11.2.23.5. Financials (Based on Availability)
- 11.2.24 Newsmy
- 11.2.24.1. Overview
- 11.2.24.2. Products
- 11.2.24.3. SWOT Analysis
- 11.2.24.4. Recent Developments
- 11.2.24.5. Financials (Based on Availability)
- 11.2.25 Shinco
- 11.2.25.1. Overview
- 11.2.25.2. Products
- 11.2.25.3. SWOT Analysis
- 11.2.25.4. Recent Developments
- 11.2.25.5. Financials (Based on Availability)
- 11.2.1 VDO
List of Figures
- Figure 1: Global Commercial Car Black Box Revenue Breakdown (undefined, %) by Region 2025 & 2033
- Figure 2: North America Commercial Car Black Box Revenue (undefined), by Application 2025 & 2033
- Figure 3: North America Commercial Car Black Box Revenue Share (%), by Application 2025 & 2033
- Figure 4: North America Commercial Car Black Box Revenue (undefined), by Types 2025 & 2033
- Figure 5: North America Commercial Car Black Box Revenue Share (%), by Types 2025 & 2033
- Figure 6: North America Commercial Car Black Box Revenue (undefined), by Country 2025 & 2033
- Figure 7: North America Commercial Car Black Box Revenue Share (%), by Country 2025 & 2033
- Figure 8: South America Commercial Car Black Box Revenue (undefined), by Application 2025 & 2033
- Figure 9: South America Commercial Car Black Box Revenue Share (%), by Application 2025 & 2033
- Figure 10: South America Commercial Car Black Box Revenue (undefined), by Types 2025 & 2033
- Figure 11: South America Commercial Car Black Box Revenue Share (%), by Types 2025 & 2033
- Figure 12: South America Commercial Car Black Box Revenue (undefined), by Country 2025 & 2033
- Figure 13: South America Commercial Car Black Box Revenue Share (%), by Country 2025 & 2033
- Figure 14: Europe Commercial Car Black Box Revenue (undefined), by Application 2025 & 2033
- Figure 15: Europe Commercial Car Black Box Revenue Share (%), by Application 2025 & 2033
- Figure 16: Europe Commercial Car Black Box Revenue (undefined), by Types 2025 & 2033
- Figure 17: Europe Commercial Car Black Box Revenue Share (%), by Types 2025 & 2033
- Figure 18: Europe Commercial Car Black Box Revenue (undefined), by Country 2025 & 2033
- Figure 19: Europe Commercial Car Black Box Revenue Share (%), by Country 2025 & 2033
- Figure 20: Middle East & Africa Commercial Car Black Box Revenue (undefined), by Application 2025 & 2033
- Figure 21: Middle East & Africa Commercial Car Black Box Revenue Share (%), by Application 2025 & 2033
- Figure 22: Middle East & Africa Commercial Car Black Box Revenue (undefined), by Types 2025 & 2033
- Figure 23: Middle East & Africa Commercial Car Black Box Revenue Share (%), by Types 2025 & 2033
- Figure 24: Middle East & Africa Commercial Car Black Box Revenue (undefined), by Country 2025 & 2033
- Figure 25: Middle East & Africa Commercial Car Black Box Revenue Share (%), by Country 2025 & 2033
- Figure 26: Asia Pacific Commercial Car Black Box Revenue (undefined), by Application 2025 & 2033
- Figure 27: Asia Pacific Commercial Car Black Box Revenue Share (%), by Application 2025 & 2033
- Figure 28: Asia Pacific Commercial Car Black Box Revenue (undefined), by Types 2025 & 2033
- Figure 29: Asia Pacific Commercial Car Black Box Revenue Share (%), by Types 2025 & 2033
- Figure 30: Asia Pacific Commercial Car Black Box Revenue (undefined), by Country 2025 & 2033
- Figure 31: Asia Pacific Commercial Car Black Box Revenue Share (%), by Country 2025 & 2033
List of Tables
- Table 1: Global Commercial Car Black Box Revenue undefined Forecast, by Application 2020 & 2033
- Table 2: Global Commercial Car Black Box Revenue undefined Forecast, by Types 2020 & 2033
- Table 3: Global Commercial Car Black Box Revenue undefined Forecast, by Region 2020 & 2033
- Table 4: Global Commercial Car Black Box Revenue undefined Forecast, by Application 2020 & 2033
- Table 5: Global Commercial Car Black Box Revenue undefined Forecast, by Types 2020 & 2033
- Table 6: Global Commercial Car Black Box Revenue undefined Forecast, by Country 2020 & 2033
- Table 7: United States Commercial Car Black Box Revenue (undefined) Forecast, by Application 2020 & 2033
- Table 8: Canada Commercial Car Black Box Revenue (undefined) Forecast, by Application 2020 & 2033
- Table 9: Mexico Commercial Car Black Box Revenue (undefined) Forecast, by Application 2020 & 2033
- Table 10: Global Commercial Car Black Box Revenue undefined Forecast, by Application 2020 & 2033
- Table 11: Global Commercial Car Black Box Revenue undefined Forecast, by Types 2020 & 2033
- Table 12: Global Commercial Car Black Box Revenue undefined Forecast, by Country 2020 & 2033
- Table 13: Brazil Commercial Car Black Box Revenue (undefined) Forecast, by Application 2020 & 2033
- Table 14: Argentina Commercial Car Black Box Revenue (undefined) Forecast, by Application 2020 & 2033
- Table 15: Rest of South America Commercial Car Black Box Revenue (undefined) Forecast, by Application 2020 & 2033
- Table 16: Global Commercial Car Black Box Revenue undefined Forecast, by Application 2020 & 2033
- Table 17: Global Commercial Car Black Box Revenue undefined Forecast, by Types 2020 & 2033
- Table 18: Global Commercial Car Black Box Revenue undefined Forecast, by Country 2020 & 2033
- Table 19: United Kingdom Commercial Car Black Box Revenue (undefined) Forecast, by Application 2020 & 2033
- Table 20: Germany Commercial Car Black Box Revenue (undefined) Forecast, by Application 2020 & 2033
- Table 21: France Commercial Car Black Box Revenue (undefined) Forecast, by Application 2020 & 2033
- Table 22: Italy Commercial Car Black Box Revenue (undefined) Forecast, by Application 2020 & 2033
- Table 23: Spain Commercial Car Black Box Revenue (undefined) Forecast, by Application 2020 & 2033
- Table 24: Russia Commercial Car Black Box Revenue (undefined) Forecast, by Application 2020 & 2033
- Table 25: Benelux Commercial Car Black Box Revenue (undefined) Forecast, by Application 2020 & 2033
- Table 26: Nordics Commercial Car Black Box Revenue (undefined) Forecast, by Application 2020 & 2033
- Table 27: Rest of Europe Commercial Car Black Box Revenue (undefined) Forecast, by Application 2020 & 2033
- Table 28: Global Commercial Car Black Box Revenue undefined Forecast, by Application 2020 & 2033
- Table 29: Global Commercial Car Black Box Revenue undefined Forecast, by Types 2020 & 2033
- Table 30: Global Commercial Car Black Box Revenue undefined Forecast, by Country 2020 & 2033
- Table 31: Turkey Commercial Car Black Box Revenue (undefined) Forecast, by Application 2020 & 2033
- Table 32: Israel Commercial Car Black Box Revenue (undefined) Forecast, by Application 2020 & 2033
- Table 33: GCC Commercial Car Black Box Revenue (undefined) Forecast, by Application 2020 & 2033
- Table 34: North Africa Commercial Car Black Box Revenue (undefined) Forecast, by Application 2020 & 2033
- Table 35: South Africa Commercial Car Black Box Revenue (undefined) Forecast, by Application 2020 & 2033
- Table 36: Rest of Middle East & Africa Commercial Car Black Box Revenue (undefined) Forecast, by Application 2020 & 2033
- Table 37: Global Commercial Car Black Box Revenue undefined Forecast, by Application 2020 & 2033
- Table 38: Global Commercial Car Black Box Revenue undefined Forecast, by Types 2020 & 2033
- Table 39: Global Commercial Car Black Box Revenue undefined Forecast, by Country 2020 & 2033
- Table 40: China Commercial Car Black Box Revenue (undefined) Forecast, by Application 2020 & 2033
- Table 41: India Commercial Car Black Box Revenue (undefined) Forecast, by Application 2020 & 2033
- Table 42: Japan Commercial Car Black Box Revenue (undefined) Forecast, by Application 2020 & 2033
- Table 43: South Korea Commercial Car Black Box Revenue (undefined) Forecast, by Application 2020 & 2033
- Table 44: ASEAN Commercial Car Black Box Revenue (undefined) Forecast, by Application 2020 & 2033
- Table 45: Oceania Commercial Car Black Box Revenue (undefined) Forecast, by Application 2020 & 2033
- Table 46: Rest of Asia Pacific Commercial Car Black Box Revenue (undefined) Forecast, by Application 2020 & 2033
Frequently Asked Questions
1. What is the projected Compound Annual Growth Rate (CAGR) of the Commercial Car Black Box?
The projected CAGR is approximately 8.9%.
2. Which companies are prominent players in the Commercial Car Black Box?
Key companies in the market include VDO, Supepst, Philips, HP, Garmin, Blackvue, Eheak, Samsung-anywhere, Incredisonic, Auto-vox, Cansonic, Papago, DOD, DEC, Blackview, Jado, Careland, Sast, Kehan, DAZA, GFGY Corp, Wolfcar, MateGo, Newsmy, Shinco.
3. What are the main segments of the Commercial Car Black Box?
The market segments include Application, Types.
4. Can you provide details about the market size?
The market size is estimated to be USD XXX N/A as of 2022.
5. What are some drivers contributing to market growth?
N/A
6. What are the notable trends driving market growth?
N/A
7. Are there any restraints impacting market growth?
N/A
8. Can you provide examples of recent developments in the market?
N/A
9. What pricing options are available for accessing the report?
Pricing options include single-user, multi-user, and enterprise licenses priced at USD 4900.00, USD 7350.00, and USD 9800.00 respectively.
10. Is the market size provided in terms of value or volume?
The market size is provided in terms of value, measured in N/A.
11. Are there any specific market keywords associated with the report?
Yes, the market keyword associated with the report is "Commercial Car Black Box," which aids in identifying and referencing the specific market segment covered.
12. How do I determine which pricing option suits my needs best?
The pricing options vary based on user requirements and access needs. Individual users may opt for single-user licenses, while businesses requiring broader access may choose multi-user or enterprise licenses for cost-effective access to the report.
13. Are there any additional resources or data provided in the Commercial Car Black Box report?
While the report offers comprehensive insights, it's advisable to review the specific contents or supplementary materials provided to ascertain if additional resources or data are available.
14. How can I stay updated on further developments or reports in the Commercial Car Black Box?
To stay informed about further developments, trends, and reports in the Commercial Car Black Box, consider subscribing to industry newsletters, following relevant companies and organizations, or regularly checking reputable industry news sources and publications.
Methodology
Step 1 - Identification of Relevant Samples Size from Population Database


Step 2 - Approaches for Defining Global Market Size (Value, Volume* & Price*)

Note*: In applicable scenarios
Step 3 - Data Sources
Primary Research
- Web Analytics
- Survey Reports
- Research Institute
- Latest Research Reports
- Opinion Leaders
Secondary Research
- Annual Reports
- White Paper
- Latest Press Release
- Industry Association
- Paid Database
- Investor Presentations

Step 4 - Data Triangulation
Involves using different sources of information in order to increase the validity of a study
These sources are likely to be stakeholders in a program - participants, other researchers, program staff, other community members, and so on.
Then we put all data in single framework & apply various statistical tools to find out the dynamic on the market.
During the analysis stage, feedback from the stakeholder groups would be compared to determine areas of agreement as well as areas of divergence