

Key Insights
The global chassis dynamometer market for vehicle testing is experiencing substantial growth, propelled by stringent vehicle emission regulations and the increasing adoption of Advanced Driver-Assistance Systems (ADAS). The automotive industry's demand for efficient and accurate testing methodologies to ensure vehicle performance, safety, and fuel efficiency is a key growth driver. This necessitates sophisticated chassis dynamometers capable of simulating diverse real-world driving conditions. Emerging trends include the rise of electric and hybrid vehicles, requiring specialized testing equipment, and the integration of advanced data acquisition and analysis systems to optimize testing processes. The market is also observing a trend towards more compact and versatile dynamometer designs suitable for various vehicle types and testing applications. Leading manufacturers, including HORIBA, MTS, and AVL List, are actively investing in research and development to enhance product capabilities, further stimulating market expansion. The competitive landscape features both established market players and specialized niche companies, fostering innovation in technology and service offerings. While the high initial investment for advanced chassis dynamometers presents a restraint, particularly for smaller testing facilities, the long-term benefits of improved efficiency and accuracy are driving widespread market adoption.
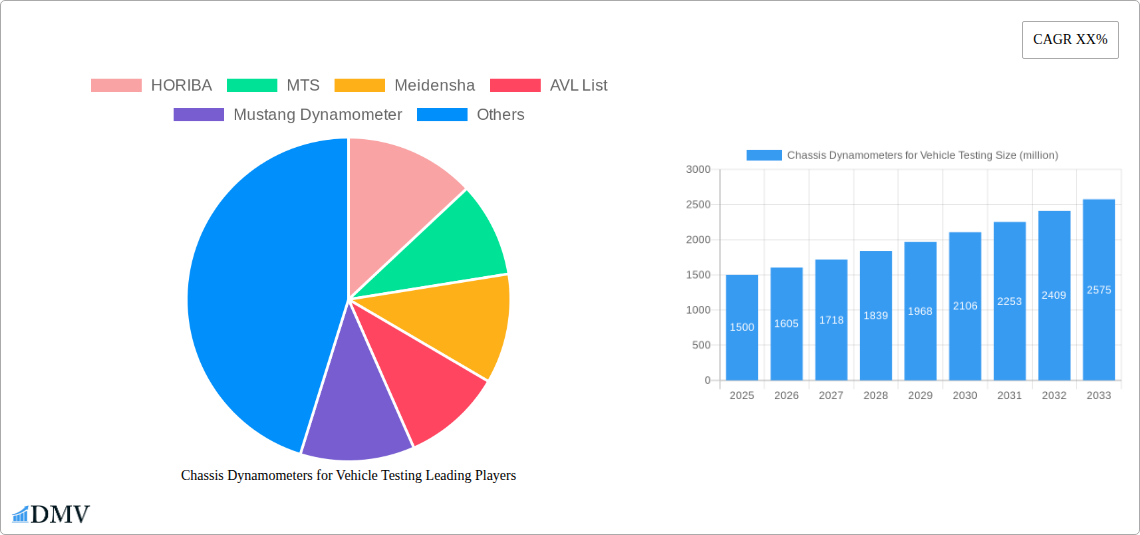
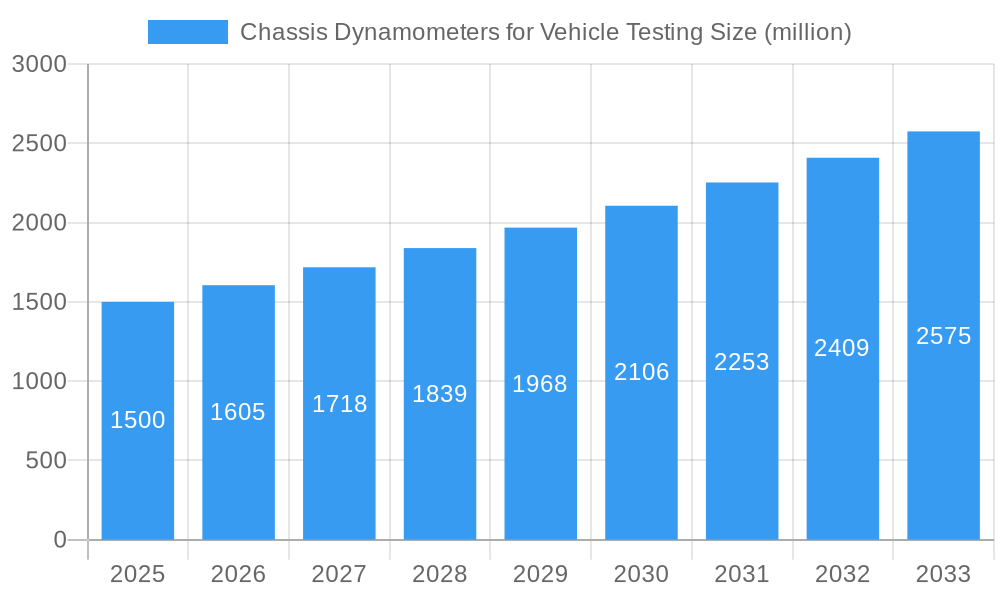
Chassis Dynamometers for Vehicle Testing Market Size (In Million)
The projected market size for 2025 is estimated at $90.56 million, with a Compound Annual Growth Rate (CAGR) of 2.93% from 2025 to 2033. This growth is anticipated to be sustained by increasing automation in vehicle testing processes and the growing adoption of autonomous driving technologies. North America and Europe currently lead the market, with the Asia-Pacific region poised for significant expansion driven by burgeoning automotive manufacturing in China and India. Market segmentation includes dynamometer types (electric, hybrid, conventional), vehicle types, and testing applications (emission, performance). Continuous technological advancements in dynamometer designs, such as the incorporation of advanced simulation software and data analytics, will continue to shape the market landscape.
Chassis Dynamometers for Vehicle Testing Company Market Share
Chassis Dynamometers for Vehicle Testing Market Report: 2019-2033
This comprehensive report provides an in-depth analysis of the global Chassis Dynamometers for Vehicle Testing market, projecting a market valuation exceeding $XX million by 2033. The study covers the period from 2019 to 2033, with 2025 serving as both the base and estimated year. Key players such as HORIBA, MTS, Meidensha, and AVL List are profiled, alongside a detailed examination of market trends, technological advancements, and future growth opportunities. This report is essential for stakeholders seeking to understand and capitalize on the evolving dynamics of this multi-million dollar industry.
Chassis Dynamometers for Vehicle Testing Market Composition & Trends
The global chassis dynamometer market, valued at $XX million in 2025, exhibits a moderately concentrated landscape with a few major players holding significant market share. HORIBA, MTS, and Meidensha collectively account for approximately XX% of the market. The market is characterized by continuous innovation, driven by stringent emission regulations and the growing demand for advanced vehicle testing capabilities. Regulatory pressure, particularly concerning fuel efficiency and emissions standards, is a significant catalyst for market growth. Substitute technologies, such as virtual simulation software, exist but haven't yet significantly impacted the market due to the inherent limitations in replicating real-world driving conditions. End-users include automotive manufacturers, research institutions, and independent testing facilities. M&A activity in the sector has been moderate, with deals totaling approximately $XX million over the past five years, mainly focused on consolidating smaller players or expanding geographic reach.
- Market Share Distribution (2025): HORIBA (XX%), MTS (XX%), Meidensha (XX%), Others (XX%)
- Top 3 M&A Deals (2019-2024): Deal 1: $XX million, Deal 2: $XX million, Deal 3: $XX million
Chassis Dynamometers for Vehicle Testing Industry Evolution
The chassis dynamometer market has witnessed consistent growth throughout the historical period (2019-2024), exhibiting a Compound Annual Growth Rate (CAGR) of XX%. This growth is primarily fueled by the increasing adoption of electric vehicles (EVs) and hybrid electric vehicles (HEVs), requiring sophisticated testing procedures. Technological advancements, such as the integration of advanced software and data acquisition systems, have significantly enhanced the capabilities of chassis dynamometers, enabling more accurate and comprehensive testing. The rising demand for improved fuel efficiency and reduced emissions has further propelled the market. Consumer demand for safer and more fuel-efficient vehicles pushes manufacturers to invest in advanced testing technologies. This trend is expected to continue throughout the forecast period (2025-2033), with the market projected to reach $XX million by 2033. The integration of AI and machine learning is also transforming the industry, allowing for more efficient data analysis and predictive maintenance.
- CAGR (2019-2024): XX%
- Projected CAGR (2025-2033): XX%
- Market Size (2033): $XX million
Leading Regions, Countries, or Segments in Chassis Dynamometers for Vehicle Testing
The North American market currently holds the leading position in the global chassis dynamometer market, driven by significant investments in automotive research and development, alongside stringent emission regulations. Europe and Asia-Pacific follow closely, reflecting the robust automotive industries in these regions. Within the segments, the demand for electric vehicle (EV) testing equipment is experiencing the fastest growth, driven by the global shift towards electrification.
- Key Drivers for North American Dominance:
- High R&D investment in the automotive sector
- Stringent emission regulations and fuel efficiency standards
- Presence of major automotive manufacturers and testing facilities.
- Key Drivers for European Growth:
- Stringent EU emission standards
- Strong presence of automotive manufacturers and suppliers
- Growing focus on electric vehicle technology
- Key Drivers for Asia-Pacific Growth:
- Rapidly expanding automotive industry
- Increasing government investments in infrastructure and technology
- Growing demand for affordable and fuel-efficient vehicles
Chassis Dynamometers for Vehicle Testing Product Innovations
Recent innovations in chassis dynamometers include the integration of advanced sensors for precise data acquisition, improved software for data analysis and visualization, and the incorporation of electric motor technologies for enhanced testing capabilities. These advancements have led to more accurate, efficient, and cost-effective testing processes, catering to the demands of modern vehicle development. The latest models feature advanced simulation capabilities mimicking diverse driving conditions, further boosting their usefulness. Unique selling propositions often include superior data accuracy, ease of use, and integration with other testing equipment.
Propelling Factors for Chassis Dynamometers for Vehicle Testing Growth
Several factors are driving the growth of the chassis dynamometer market. The increasing focus on reducing vehicle emissions, improving fuel efficiency, and enhancing safety standards necessitates advanced testing technologies. Government regulations and incentives are encouraging the adoption of environmentally friendly vehicles, thereby boosting the demand for comprehensive testing equipment. Technological advancements, such as AI-powered data analysis and the integration of electric motor systems, are also making chassis dynamometers more efficient and effective.
Obstacles in the Chassis Dynamometers for Vehicle Testing Market
The market faces challenges, including the high initial investment cost of advanced dynamometers, which can be a barrier for smaller companies. Supply chain disruptions, especially in the procurement of specialized components, can impact production and delivery timelines. Intense competition among established players also presents a significant challenge.
Future Opportunities in Chassis Dynamometers for Vehicle Testing
Future opportunities exist in emerging markets with growing automotive industries, such as in Southeast Asia and South America. The development of next-generation testing technologies, like those leveraging autonomous driving simulations, promises significant market expansion. The increasing demand for autonomous vehicle testing further opens up new avenues for growth in the coming years.
Major Players in the Chassis Dynamometers for Vehicle Testing Ecosystem
Key Developments in Chassis Dynamometers for Vehicle Testing Industry
- 2022-Q4: HORIBA launched a new electric vehicle testing system.
- 2023-Q1: MTS acquired a smaller dynamometer manufacturer, expanding its market share.
- 2023-Q2: AVL List introduced AI-powered data analysis software for its dynamometers.
- 2024-Q3: Meidensha partnered with a leading software developer to enhance data processing capabilities. (Further developments to be added based on actual data)
Strategic Chassis Dynamometers for Vehicle Testing Market Forecast
The chassis dynamometer market is poised for continued growth, driven by technological innovation, stringent regulations, and the increasing demand for advanced vehicle testing capabilities. The market is expected to benefit significantly from the ongoing transition towards electric and autonomous vehicles. The focus on efficient testing and data analysis will lead to continued investments in advanced dynamometer technologies and software, ensuring sustained market expansion throughout the forecast period.
Chassis Dynamometers for Vehicle Testing Segmentation
-
1. Application
- 1.1. Car
- 1.2. Moto
- 1.3. Truck
- 1.4. Others
-
2. Types
- 2.1. Single Roller
- 2.2. Multi Roller
Chassis Dynamometers for Vehicle Testing Segmentation By Geography
-
1. North America
- 1.1. United States
- 1.2. Canada
- 1.3. Mexico
-
2. South America
- 2.1. Brazil
- 2.2. Argentina
- 2.3. Rest of South America
-
3. Europe
- 3.1. United Kingdom
- 3.2. Germany
- 3.3. France
- 3.4. Italy
- 3.5. Spain
- 3.6. Russia
- 3.7. Benelux
- 3.8. Nordics
- 3.9. Rest of Europe
-
4. Middle East & Africa
- 4.1. Turkey
- 4.2. Israel
- 4.3. GCC
- 4.4. North Africa
- 4.5. South Africa
- 4.6. Rest of Middle East & Africa
-
5. Asia Pacific
- 5.1. China
- 5.2. India
- 5.3. Japan
- 5.4. South Korea
- 5.5. ASEAN
- 5.6. Oceania
- 5.7. Rest of Asia Pacific

Chassis Dynamometers for Vehicle Testing Regional Market Share
Geographic Coverage of Chassis Dynamometers for Vehicle Testing
Chassis Dynamometers for Vehicle Testing REPORT HIGHLIGHTS
| Aspects | Details |
|---|---|
| Study Period | 2020-2034 |
| Base Year | 2025 |
| Estimated Year | 2026 |
| Forecast Period | 2026-2034 |
| Historical Period | 2020-2025 |
| Growth Rate | CAGR of 2.93% from 2020-2034 |
| Segmentation |
|
Table of Contents
- 1. Introduction
- 1.1. Research Scope
- 1.2. Market Segmentation
- 1.3. Research Methodology
- 1.4. Definitions and Assumptions
- 2. Executive Summary
- 2.1. Introduction
- 3. Market Dynamics
- 3.1. Introduction
- 3.2. Market Drivers
- 3.3. Market Restrains
- 3.4. Market Trends
- 4. Market Factor Analysis
- 4.1. Porters Five Forces
- 4.2. Supply/Value Chain
- 4.3. PESTEL analysis
- 4.4. Market Entropy
- 4.5. Patent/Trademark Analysis
- 5. Global Chassis Dynamometers for Vehicle Testing Analysis, Insights and Forecast, 2020-2032
- 5.1. Market Analysis, Insights and Forecast - by Application
- 5.1.1. Car
- 5.1.2. Moto
- 5.1.3. Truck
- 5.1.4. Others
- 5.2. Market Analysis, Insights and Forecast - by Types
- 5.2.1. Single Roller
- 5.2.2. Multi Roller
- 5.3. Market Analysis, Insights and Forecast - by Region
- 5.3.1. North America
- 5.3.2. South America
- 5.3.3. Europe
- 5.3.4. Middle East & Africa
- 5.3.5. Asia Pacific
- 5.1. Market Analysis, Insights and Forecast - by Application
- 6. North America Chassis Dynamometers for Vehicle Testing Analysis, Insights and Forecast, 2020-2032
- 6.1. Market Analysis, Insights and Forecast - by Application
- 6.1.1. Car
- 6.1.2. Moto
- 6.1.3. Truck
- 6.1.4. Others
- 6.2. Market Analysis, Insights and Forecast - by Types
- 6.2.1. Single Roller
- 6.2.2. Multi Roller
- 6.1. Market Analysis, Insights and Forecast - by Application
- 7. South America Chassis Dynamometers for Vehicle Testing Analysis, Insights and Forecast, 2020-2032
- 7.1. Market Analysis, Insights and Forecast - by Application
- 7.1.1. Car
- 7.1.2. Moto
- 7.1.3. Truck
- 7.1.4. Others
- 7.2. Market Analysis, Insights and Forecast - by Types
- 7.2.1. Single Roller
- 7.2.2. Multi Roller
- 7.1. Market Analysis, Insights and Forecast - by Application
- 8. Europe Chassis Dynamometers for Vehicle Testing Analysis, Insights and Forecast, 2020-2032
- 8.1. Market Analysis, Insights and Forecast - by Application
- 8.1.1. Car
- 8.1.2. Moto
- 8.1.3. Truck
- 8.1.4. Others
- 8.2. Market Analysis, Insights and Forecast - by Types
- 8.2.1. Single Roller
- 8.2.2. Multi Roller
- 8.1. Market Analysis, Insights and Forecast - by Application
- 9. Middle East & Africa Chassis Dynamometers for Vehicle Testing Analysis, Insights and Forecast, 2020-2032
- 9.1. Market Analysis, Insights and Forecast - by Application
- 9.1.1. Car
- 9.1.2. Moto
- 9.1.3. Truck
- 9.1.4. Others
- 9.2. Market Analysis, Insights and Forecast - by Types
- 9.2.1. Single Roller
- 9.2.2. Multi Roller
- 9.1. Market Analysis, Insights and Forecast - by Application
- 10. Asia Pacific Chassis Dynamometers for Vehicle Testing Analysis, Insights and Forecast, 2020-2032
- 10.1. Market Analysis, Insights and Forecast - by Application
- 10.1.1. Car
- 10.1.2. Moto
- 10.1.3. Truck
- 10.1.4. Others
- 10.2. Market Analysis, Insights and Forecast - by Types
- 10.2.1. Single Roller
- 10.2.2. Multi Roller
- 10.1. Market Analysis, Insights and Forecast - by Application
- 11. Competitive Analysis
- 11.1. Global Market Share Analysis 2025
- 11.2. Company Profiles
- 11.2.1 HORIBA
- 11.2.1.1. Overview
- 11.2.1.2. Products
- 11.2.1.3. SWOT Analysis
- 11.2.1.4. Recent Developments
- 11.2.1.5. Financials (Based on Availability)
- 11.2.2 MTS
- 11.2.2.1. Overview
- 11.2.2.2. Products
- 11.2.2.3. SWOT Analysis
- 11.2.2.4. Recent Developments
- 11.2.2.5. Financials (Based on Availability)
- 11.2.3 Meidensha
- 11.2.3.1. Overview
- 11.2.3.2. Products
- 11.2.3.3. SWOT Analysis
- 11.2.3.4. Recent Developments
- 11.2.3.5. Financials (Based on Availability)
- 11.2.4 AVL List
- 11.2.4.1. Overview
- 11.2.4.2. Products
- 11.2.4.3. SWOT Analysis
- 11.2.4.4. Recent Developments
- 11.2.4.5. Financials (Based on Availability)
- 11.2.5 Mustang Dynamometer
- 11.2.5.1. Overview
- 11.2.5.2. Products
- 11.2.5.3. SWOT Analysis
- 11.2.5.4. Recent Developments
- 11.2.5.5. Financials (Based on Availability)
- 11.2.6 Power Test Dynamometers
- 11.2.6.1. Overview
- 11.2.6.2. Products
- 11.2.6.3. SWOT Analysis
- 11.2.6.4. Recent Developments
- 11.2.6.5. Financials (Based on Availability)
- 11.2.7 MAHA
- 11.2.7.1. Overview
- 11.2.7.2. Products
- 11.2.7.3. SWOT Analysis
- 11.2.7.4. Recent Developments
- 11.2.7.5. Financials (Based on Availability)
- 11.2.8 Ono Sokki
- 11.2.8.1. Overview
- 11.2.8.2. Products
- 11.2.8.3. SWOT Analysis
- 11.2.8.4. Recent Developments
- 11.2.8.5. Financials (Based on Availability)
- 11.2.9 Rototest
- 11.2.9.1. Overview
- 11.2.9.2. Products
- 11.2.9.3. SWOT Analysis
- 11.2.9.4. Recent Developments
- 11.2.9.5. Financials (Based on Availability)
- 11.2.10 KRATZER
- 11.2.10.1. Overview
- 11.2.10.2. Products
- 11.2.10.3. SWOT Analysis
- 11.2.10.4. Recent Developments
- 11.2.10.5. Financials (Based on Availability)
- 11.2.11 Sierra Instruments
- 11.2.11.1. Overview
- 11.2.11.2. Products
- 11.2.11.3. SWOT Analysis
- 11.2.11.4. Recent Developments
- 11.2.11.5. Financials (Based on Availability)
- 11.2.12 SNT
- 11.2.12.1. Overview
- 11.2.12.2. Products
- 11.2.12.3. SWOT Analysis
- 11.2.12.4. Recent Developments
- 11.2.12.5. Financials (Based on Availability)
- 11.2.13 Dynapack
- 11.2.13.1. Overview
- 11.2.13.2. Products
- 11.2.13.3. SWOT Analysis
- 11.2.13.4. Recent Developments
- 11.2.13.5. Financials (Based on Availability)
- 11.2.14 SAJ Test
- 11.2.14.1. Overview
- 11.2.14.2. Products
- 11.2.14.3. SWOT Analysis
- 11.2.14.4. Recent Developments
- 11.2.14.5. Financials (Based on Availability)
- 11.2.15 AZL
- 11.2.15.1. Overview
- 11.2.15.2. Products
- 11.2.15.3. SWOT Analysis
- 11.2.15.4. Recent Developments
- 11.2.15.5. Financials (Based on Availability)
- 11.2.16 Burke Porter Group
- 11.2.16.1. Overview
- 11.2.16.2. Products
- 11.2.16.3. SWOT Analysis
- 11.2.16.4. Recent Developments
- 11.2.16.5. Financials (Based on Availability)
- 11.2.17 Dürr_AG
- 11.2.17.1. Overview
- 11.2.17.2. Products
- 11.2.17.3. SWOT Analysis
- 11.2.17.4. Recent Developments
- 11.2.17.5. Financials (Based on Availability)
- 11.2.18 Dynomax
- 11.2.18.1. Overview
- 11.2.18.2. Products
- 11.2.18.3. SWOT Analysis
- 11.2.18.4. Recent Developments
- 11.2.18.5. Financials (Based on Availability)
- 11.2.19 Dynomerk
- 11.2.19.1. Overview
- 11.2.19.2. Products
- 11.2.19.3. SWOT Analysis
- 11.2.19.4. Recent Developments
- 11.2.19.5. Financials (Based on Availability)
- 11.2.20 Dynoteg
- 11.2.20.1. Overview
- 11.2.20.2. Products
- 11.2.20.3. SWOT Analysis
- 11.2.20.4. Recent Developments
- 11.2.20.5. Financials (Based on Availability)
- 11.2.21 Hofmann Prüftechnik
- 11.2.21.1. Overview
- 11.2.21.2. Products
- 11.2.21.3. SWOT Analysis
- 11.2.21.4. Recent Developments
- 11.2.21.5. Financials (Based on Availability)
- 11.2.22 SuperFlow Industries
- 11.2.22.1. Overview
- 11.2.22.2. Products
- 11.2.22.3. SWOT Analysis
- 11.2.22.4. Recent Developments
- 11.2.22.5. Financials (Based on Availability)
- 11.2.23 TeSys Co.
- 11.2.23.1. Overview
- 11.2.23.2. Products
- 11.2.23.3. SWOT Analysis
- 11.2.23.4. Recent Developments
- 11.2.23.5. Financials (Based on Availability)
- 11.2.24 Ltd
- 11.2.24.1. Overview
- 11.2.24.2. Products
- 11.2.24.3. SWOT Analysis
- 11.2.24.4. Recent Developments
- 11.2.24.5. Financials (Based on Availability)
- 11.2.1 HORIBA
List of Figures
- Figure 1: Global Chassis Dynamometers for Vehicle Testing Revenue Breakdown (million, %) by Region 2025 & 2033
- Figure 2: North America Chassis Dynamometers for Vehicle Testing Revenue (million), by Application 2025 & 2033
- Figure 3: North America Chassis Dynamometers for Vehicle Testing Revenue Share (%), by Application 2025 & 2033
- Figure 4: North America Chassis Dynamometers for Vehicle Testing Revenue (million), by Types 2025 & 2033
- Figure 5: North America Chassis Dynamometers for Vehicle Testing Revenue Share (%), by Types 2025 & 2033
- Figure 6: North America Chassis Dynamometers for Vehicle Testing Revenue (million), by Country 2025 & 2033
- Figure 7: North America Chassis Dynamometers for Vehicle Testing Revenue Share (%), by Country 2025 & 2033
- Figure 8: South America Chassis Dynamometers for Vehicle Testing Revenue (million), by Application 2025 & 2033
- Figure 9: South America Chassis Dynamometers for Vehicle Testing Revenue Share (%), by Application 2025 & 2033
- Figure 10: South America Chassis Dynamometers for Vehicle Testing Revenue (million), by Types 2025 & 2033
- Figure 11: South America Chassis Dynamometers for Vehicle Testing Revenue Share (%), by Types 2025 & 2033
- Figure 12: South America Chassis Dynamometers for Vehicle Testing Revenue (million), by Country 2025 & 2033
- Figure 13: South America Chassis Dynamometers for Vehicle Testing Revenue Share (%), by Country 2025 & 2033
- Figure 14: Europe Chassis Dynamometers for Vehicle Testing Revenue (million), by Application 2025 & 2033
- Figure 15: Europe Chassis Dynamometers for Vehicle Testing Revenue Share (%), by Application 2025 & 2033
- Figure 16: Europe Chassis Dynamometers for Vehicle Testing Revenue (million), by Types 2025 & 2033
- Figure 17: Europe Chassis Dynamometers for Vehicle Testing Revenue Share (%), by Types 2025 & 2033
- Figure 18: Europe Chassis Dynamometers for Vehicle Testing Revenue (million), by Country 2025 & 2033
- Figure 19: Europe Chassis Dynamometers for Vehicle Testing Revenue Share (%), by Country 2025 & 2033
- Figure 20: Middle East & Africa Chassis Dynamometers for Vehicle Testing Revenue (million), by Application 2025 & 2033
- Figure 21: Middle East & Africa Chassis Dynamometers for Vehicle Testing Revenue Share (%), by Application 2025 & 2033
- Figure 22: Middle East & Africa Chassis Dynamometers for Vehicle Testing Revenue (million), by Types 2025 & 2033
- Figure 23: Middle East & Africa Chassis Dynamometers for Vehicle Testing Revenue Share (%), by Types 2025 & 2033
- Figure 24: Middle East & Africa Chassis Dynamometers for Vehicle Testing Revenue (million), by Country 2025 & 2033
- Figure 25: Middle East & Africa Chassis Dynamometers for Vehicle Testing Revenue Share (%), by Country 2025 & 2033
- Figure 26: Asia Pacific Chassis Dynamometers for Vehicle Testing Revenue (million), by Application 2025 & 2033
- Figure 27: Asia Pacific Chassis Dynamometers for Vehicle Testing Revenue Share (%), by Application 2025 & 2033
- Figure 28: Asia Pacific Chassis Dynamometers for Vehicle Testing Revenue (million), by Types 2025 & 2033
- Figure 29: Asia Pacific Chassis Dynamometers for Vehicle Testing Revenue Share (%), by Types 2025 & 2033
- Figure 30: Asia Pacific Chassis Dynamometers for Vehicle Testing Revenue (million), by Country 2025 & 2033
- Figure 31: Asia Pacific Chassis Dynamometers for Vehicle Testing Revenue Share (%), by Country 2025 & 2033
List of Tables
- Table 1: Global Chassis Dynamometers for Vehicle Testing Revenue million Forecast, by Application 2020 & 2033
- Table 2: Global Chassis Dynamometers for Vehicle Testing Revenue million Forecast, by Types 2020 & 2033
- Table 3: Global Chassis Dynamometers for Vehicle Testing Revenue million Forecast, by Region 2020 & 2033
- Table 4: Global Chassis Dynamometers for Vehicle Testing Revenue million Forecast, by Application 2020 & 2033
- Table 5: Global Chassis Dynamometers for Vehicle Testing Revenue million Forecast, by Types 2020 & 2033
- Table 6: Global Chassis Dynamometers for Vehicle Testing Revenue million Forecast, by Country 2020 & 2033
- Table 7: United States Chassis Dynamometers for Vehicle Testing Revenue (million) Forecast, by Application 2020 & 2033
- Table 8: Canada Chassis Dynamometers for Vehicle Testing Revenue (million) Forecast, by Application 2020 & 2033
- Table 9: Mexico Chassis Dynamometers for Vehicle Testing Revenue (million) Forecast, by Application 2020 & 2033
- Table 10: Global Chassis Dynamometers for Vehicle Testing Revenue million Forecast, by Application 2020 & 2033
- Table 11: Global Chassis Dynamometers for Vehicle Testing Revenue million Forecast, by Types 2020 & 2033
- Table 12: Global Chassis Dynamometers for Vehicle Testing Revenue million Forecast, by Country 2020 & 2033
- Table 13: Brazil Chassis Dynamometers for Vehicle Testing Revenue (million) Forecast, by Application 2020 & 2033
- Table 14: Argentina Chassis Dynamometers for Vehicle Testing Revenue (million) Forecast, by Application 2020 & 2033
- Table 15: Rest of South America Chassis Dynamometers for Vehicle Testing Revenue (million) Forecast, by Application 2020 & 2033
- Table 16: Global Chassis Dynamometers for Vehicle Testing Revenue million Forecast, by Application 2020 & 2033
- Table 17: Global Chassis Dynamometers for Vehicle Testing Revenue million Forecast, by Types 2020 & 2033
- Table 18: Global Chassis Dynamometers for Vehicle Testing Revenue million Forecast, by Country 2020 & 2033
- Table 19: United Kingdom Chassis Dynamometers for Vehicle Testing Revenue (million) Forecast, by Application 2020 & 2033
- Table 20: Germany Chassis Dynamometers for Vehicle Testing Revenue (million) Forecast, by Application 2020 & 2033
- Table 21: France Chassis Dynamometers for Vehicle Testing Revenue (million) Forecast, by Application 2020 & 2033
- Table 22: Italy Chassis Dynamometers for Vehicle Testing Revenue (million) Forecast, by Application 2020 & 2033
- Table 23: Spain Chassis Dynamometers for Vehicle Testing Revenue (million) Forecast, by Application 2020 & 2033
- Table 24: Russia Chassis Dynamometers for Vehicle Testing Revenue (million) Forecast, by Application 2020 & 2033
- Table 25: Benelux Chassis Dynamometers for Vehicle Testing Revenue (million) Forecast, by Application 2020 & 2033
- Table 26: Nordics Chassis Dynamometers for Vehicle Testing Revenue (million) Forecast, by Application 2020 & 2033
- Table 27: Rest of Europe Chassis Dynamometers for Vehicle Testing Revenue (million) Forecast, by Application 2020 & 2033
- Table 28: Global Chassis Dynamometers for Vehicle Testing Revenue million Forecast, by Application 2020 & 2033
- Table 29: Global Chassis Dynamometers for Vehicle Testing Revenue million Forecast, by Types 2020 & 2033
- Table 30: Global Chassis Dynamometers for Vehicle Testing Revenue million Forecast, by Country 2020 & 2033
- Table 31: Turkey Chassis Dynamometers for Vehicle Testing Revenue (million) Forecast, by Application 2020 & 2033
- Table 32: Israel Chassis Dynamometers for Vehicle Testing Revenue (million) Forecast, by Application 2020 & 2033
- Table 33: GCC Chassis Dynamometers for Vehicle Testing Revenue (million) Forecast, by Application 2020 & 2033
- Table 34: North Africa Chassis Dynamometers for Vehicle Testing Revenue (million) Forecast, by Application 2020 & 2033
- Table 35: South Africa Chassis Dynamometers for Vehicle Testing Revenue (million) Forecast, by Application 2020 & 2033
- Table 36: Rest of Middle East & Africa Chassis Dynamometers for Vehicle Testing Revenue (million) Forecast, by Application 2020 & 2033
- Table 37: Global Chassis Dynamometers for Vehicle Testing Revenue million Forecast, by Application 2020 & 2033
- Table 38: Global Chassis Dynamometers for Vehicle Testing Revenue million Forecast, by Types 2020 & 2033
- Table 39: Global Chassis Dynamometers for Vehicle Testing Revenue million Forecast, by Country 2020 & 2033
- Table 40: China Chassis Dynamometers for Vehicle Testing Revenue (million) Forecast, by Application 2020 & 2033
- Table 41: India Chassis Dynamometers for Vehicle Testing Revenue (million) Forecast, by Application 2020 & 2033
- Table 42: Japan Chassis Dynamometers for Vehicle Testing Revenue (million) Forecast, by Application 2020 & 2033
- Table 43: South Korea Chassis Dynamometers for Vehicle Testing Revenue (million) Forecast, by Application 2020 & 2033
- Table 44: ASEAN Chassis Dynamometers for Vehicle Testing Revenue (million) Forecast, by Application 2020 & 2033
- Table 45: Oceania Chassis Dynamometers for Vehicle Testing Revenue (million) Forecast, by Application 2020 & 2033
- Table 46: Rest of Asia Pacific Chassis Dynamometers for Vehicle Testing Revenue (million) Forecast, by Application 2020 & 2033
Frequently Asked Questions
1. What is the projected Compound Annual Growth Rate (CAGR) of the Chassis Dynamometers for Vehicle Testing?
The projected CAGR is approximately 2.93%.
2. Which companies are prominent players in the Chassis Dynamometers for Vehicle Testing?
Key companies in the market include HORIBA, MTS, Meidensha, AVL List, Mustang Dynamometer, Power Test Dynamometers, MAHA, Ono Sokki, Rototest, KRATZER, Sierra Instruments, SNT, Dynapack, SAJ Test, AZL, Burke Porter Group, Dürr_AG, Dynomax, Dynomerk, Dynoteg, Hofmann Prüftechnik, SuperFlow Industries, TeSys Co., Ltd.
3. What are the main segments of the Chassis Dynamometers for Vehicle Testing?
The market segments include Application, Types.
4. Can you provide details about the market size?
The market size is estimated to be USD 90.56 million as of 2022.
5. What are some drivers contributing to market growth?
N/A
6. What are the notable trends driving market growth?
N/A
7. Are there any restraints impacting market growth?
N/A
8. Can you provide examples of recent developments in the market?
N/A
9. What pricing options are available for accessing the report?
Pricing options include single-user, multi-user, and enterprise licenses priced at USD 4900.00, USD 7350.00, and USD 9800.00 respectively.
10. Is the market size provided in terms of value or volume?
The market size is provided in terms of value, measured in million.
11. Are there any specific market keywords associated with the report?
Yes, the market keyword associated with the report is "Chassis Dynamometers for Vehicle Testing," which aids in identifying and referencing the specific market segment covered.
12. How do I determine which pricing option suits my needs best?
The pricing options vary based on user requirements and access needs. Individual users may opt for single-user licenses, while businesses requiring broader access may choose multi-user or enterprise licenses for cost-effective access to the report.
13. Are there any additional resources or data provided in the Chassis Dynamometers for Vehicle Testing report?
While the report offers comprehensive insights, it's advisable to review the specific contents or supplementary materials provided to ascertain if additional resources or data are available.
14. How can I stay updated on further developments or reports in the Chassis Dynamometers for Vehicle Testing?
To stay informed about further developments, trends, and reports in the Chassis Dynamometers for Vehicle Testing, consider subscribing to industry newsletters, following relevant companies and organizations, or regularly checking reputable industry news sources and publications.
Methodology
Step 1 - Identification of Relevant Samples Size from Population Database


Step 2 - Approaches for Defining Global Market Size (Value, Volume* & Price*)

Note*: In applicable scenarios
Step 3 - Data Sources
Primary Research
- Web Analytics
- Survey Reports
- Research Institute
- Latest Research Reports
- Opinion Leaders
Secondary Research
- Annual Reports
- White Paper
- Latest Press Release
- Industry Association
- Paid Database
- Investor Presentations

Step 4 - Data Triangulation
Involves using different sources of information in order to increase the validity of a study
These sources are likely to be stakeholders in a program - participants, other researchers, program staff, other community members, and so on.
Then we put all data in single framework & apply various statistical tools to find out the dynamic on the market.
During the analysis stage, feedback from the stakeholder groups would be compared to determine areas of agreement as well as areas of divergence