

Key Insights
The automotive metal injection molding (MIM) parts market is experiencing robust growth, driven by increasing demand for lightweight and high-precision components in vehicles. The rising adoption of electric vehicles (EVs) and the ongoing trend towards vehicle electrification significantly fuels this demand. EVs require smaller, lighter, and more complex components compared to internal combustion engine (ICE) vehicles, making MIM an ideal manufacturing process. Furthermore, advancements in MIM technology, including the development of new materials and improved process control, contribute to higher production efficiency and enhanced part quality. This leads to cost reductions and the ability to produce intricate designs, further boosting market adoption. The market is segmented by part type (e.g., gears, sprockets, engine components), material (e.g., stainless steel, tool steel), and vehicle type (e.g., passenger cars, commercial vehicles). Major players are leveraging strategic partnerships and acquisitions to expand their market share and technological capabilities. Competition is intensifying with both established players and emerging companies innovating to capture a larger portion of the expanding market.
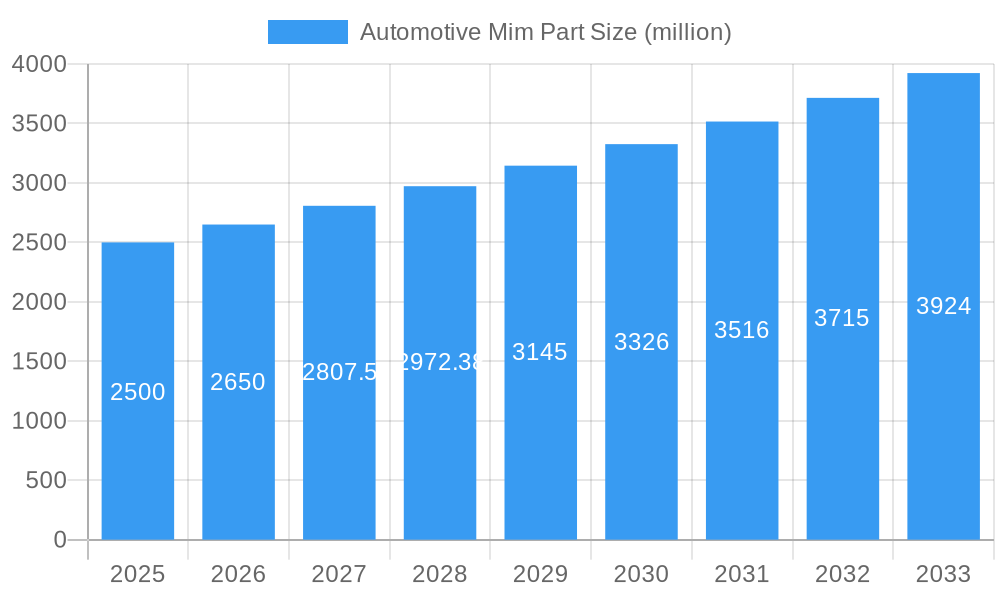
Automotive Mim Part Market Size (In Billion)
The forecast period from 2025 to 2033 anticipates consistent growth, fueled by the continued penetration of advanced driver-assistance systems (ADAS) and the growing emphasis on fuel efficiency and emissions reduction. Geographical expansion, particularly in developing economies with burgeoning automotive industries, is another crucial growth driver. While some restraints, like raw material price fluctuations and technological complexities, might influence growth, the overall outlook remains positive. The industry’s focus on innovation and collaboration with automotive original equipment manufacturers (OEMs) is expected to offset these challenges and maintain a healthy growth trajectory. The market's overall size is likely to exceed several billion dollars by 2033, representing a significant opportunity for companies involved in the development, manufacturing, and supply of automotive MIM parts.
Automotive Mim Part Company Market Share
Automotive MIM Part Market Report: A Comprehensive Analysis (2019-2033)
This insightful report provides a comprehensive analysis of the global Automotive MIM Part market, projecting a multi-million dollar valuation by 2033. We delve into market dynamics, competitive landscapes, technological advancements, and future growth prospects, offering invaluable insights for stakeholders across the automotive industry. The study covers the period 2019-2033, with a base year of 2025 and a forecast period of 2025-2033. This report is crucial for strategic decision-making, offering a detailed understanding of this rapidly evolving market.
Automotive MIM Part Market Composition & Trends
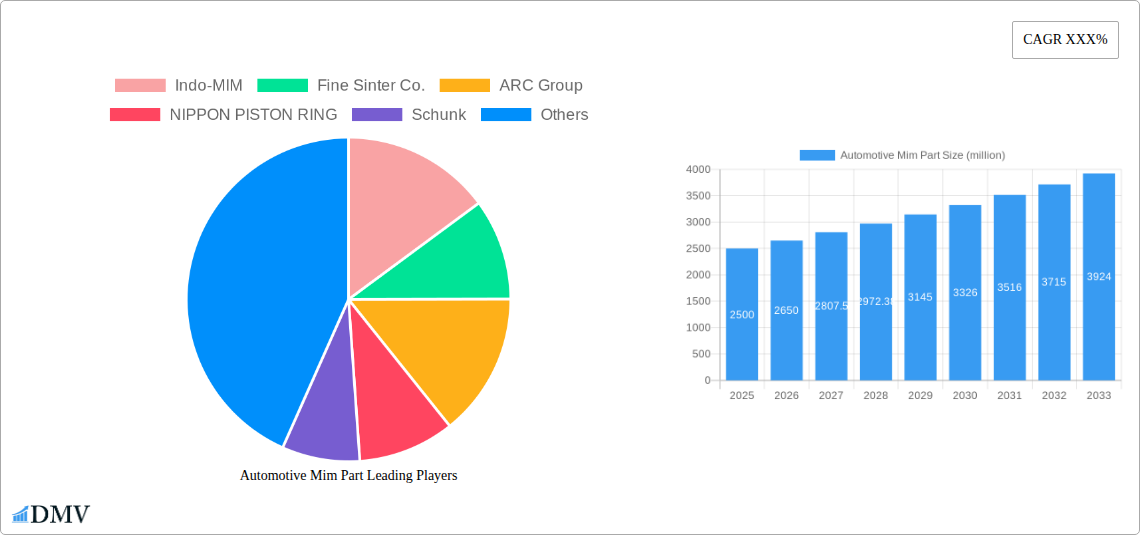
The global automotive MIM part market is experiencing robust growth, driven by increasing demand for lightweight yet high-strength components. Market concentration is moderate, with several key players vying for market share. Indo-MIM, Fine Sinter Co., ARC Group, and Nippon Piston Ring are among the prominent companies. The report analyzes the market share distribution of these and other major players (estimated at xx million USD for the top 5 in 2025), identifying emerging trends in market consolidation. Innovation is a key catalyst, with companies constantly striving to improve material properties and manufacturing processes. Stringent regulatory landscapes, especially concerning emissions and safety, impact the adoption of MIM parts. Substitute products, such as plastic and aluminum components, pose competition, but MIM parts maintain a competitive edge due to their superior strength-to-weight ratio and design flexibility. End-users mainly include major automotive manufacturers, influencing demand patterns.
- Market Share Distribution (2025): Indo-MIM (xx%), Fine Sinter Co. (xx%), ARC Group (xx%), Nippon Piston Ring (xx%), Others (xx%)
- M&A Activity (2019-2024): xx deals with a total estimated value of xx million USD.
- Key Innovation Catalysts: Additive manufacturing integration, material advancements (e.g., high-temperature alloys), improved process efficiency.
- Regulatory Landscape: Stringent emissions standards drive demand for lightweight components.
Automotive Mim Part Industry Evolution
The automotive MIM part industry has experienced consistent growth from 2019 to 2024, fueled by increasing vehicle production and technological advancements. The market's growth trajectory is expected to continue its upward trend, with an estimated Compound Annual Growth Rate (CAGR) of xx% from 2025 to 2033. This growth is driven by several factors including the rising demand for fuel-efficient vehicles, the increasing adoption of electric vehicles (EVs), and the growing preference for lightweight components to enhance vehicle performance and fuel economy. Technological advancements, such as the implementation of advanced MIM processing techniques and the development of new materials, are further bolstering market expansion. Consumer demand for improved vehicle safety, durability, and design aesthetics is also significantly impacting industry evolution. Adoption rates for MIM parts are increasing across various vehicle segments, with a predicted xx% penetration rate in the passenger car segment by 2033.
Leading Regions, Countries, or Segments in Automotive Mim Part
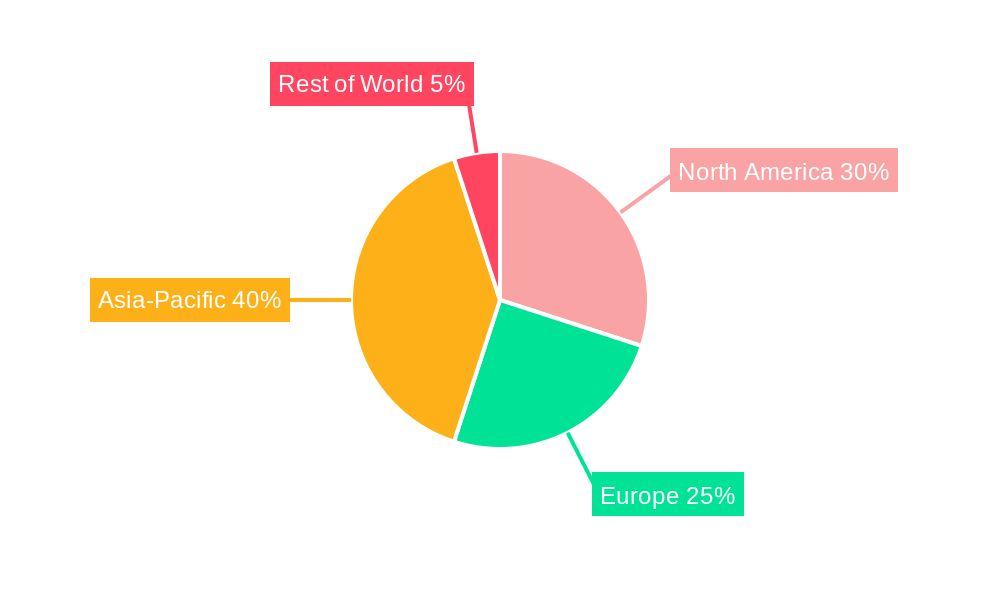
The Asia-Pacific region is currently the dominant market for automotive MIM parts, driven by a surge in automotive manufacturing and a robust supply chain. China holds a significant market share within this region, fueled by substantial investments in automotive infrastructure and a supportive regulatory environment.
- Key Drivers in Asia-Pacific:
- Extensive automotive manufacturing base
- Growing investment in automotive research and development
- Favorable government policies promoting automotive industry growth.
- Dominance Factors: Lower manufacturing costs, readily available raw materials, and a large pool of skilled labor.
- Other Key Regions: Europe and North America are also experiencing notable growth, albeit at a slower pace compared to Asia-Pacific.
Automotive Mim Part Product Innovations
Recent innovations in automotive MIM parts include the development of high-strength, lightweight alloys with enhanced corrosion resistance. These advancements cater to the growing demand for fuel-efficient and durable automotive components. New manufacturing processes, incorporating advanced automation and quality control measures, enhance production efficiency and reduce costs. Unique selling propositions include improved performance metrics, such as higher tensile strength and fatigue resistance.
Propelling Factors for Automotive Mim Part Growth
Several key factors are driving the growth of the automotive MIM part market. Technological advancements such as improved material science and advanced manufacturing processes are enabling the production of lighter, stronger and more complex parts. Economic factors, including the increasing affordability of MIM parts compared to traditional methods, further fuels adoption. Government regulations promoting fuel efficiency and emissions reduction also drive demand for lightweight automotive components.
Obstacles in the Automotive Mim Part Market
Despite promising growth prospects, the automotive MIM part market faces several challenges. Fluctuating raw material prices impact production costs. Supply chain disruptions caused by geopolitical instability or natural disasters can hinder production and delivery. Intense competition from alternative manufacturing methods and other materials represents a significant hurdle.
Future Opportunities in Automotive Mim Part
Future opportunities exist in emerging markets such as electric vehicles (EVs) and hybrid vehicles, where the demand for lightweight and high-performance components is particularly strong. Technological advancements in materials science and additive manufacturing present new possibilities for innovation and enhanced functionality. Exploring new applications in advanced driver-assistance systems (ADAS) and autonomous vehicles could significantly expand the market.
Major Players in the Automotive Mim Part Ecosystem
- Indo-MIM
- Fine Sinter Co.
- ARC Group
- NIPPON PISTON RING
- Schunk
- Sintex
- Smith Metal Products
- Dou Yee Technologies
- Gian Technology
- Shanghai Future High-tech Co.,Ltd.
- Yangzhou Seashine New Materials
- Shenzhen Pacific Union Precision Manufacturing Co
- Nbtm New Materials Group Co.,Ltd.
- KERSEN
- Shenzhen Evenwin Precision Technology
- Freewon China Co.,Ltd.
- Greelife MIM Co., Ltd
Key Developments in Automotive Mim Part Industry
- 2022 Q4: Indo-MIM announces a new facility expansion, increasing its production capacity by xx%.
- 2023 Q1: Fine Sinter Co. launches a new line of high-strength MIM parts for EVs.
- 2024 Q2: ARC Group acquires a smaller MIM manufacturer, expanding its market presence. (Further developments will be added in the full report)
Strategic Automotive Mim Part Market Forecast
The automotive MIM part market is poised for continued growth, driven by technological innovation, increasing demand for lightweight components, and stringent environmental regulations. The forecast period (2025-2033) anticipates significant market expansion, with promising opportunities in emerging automotive technologies and geographic markets. This creates a considerable potential for market players to capitalize on.
Automotive Mim Part Segmentation
-
1. Application
- 1.1. Passenger Cars
- 1.2. Commercial Vehicles
-
2. Type
- 2.1. Turbocharged Parts
- 2.2. Regulating Rings
- 2.3. Injector Parts
- 2.4. Vane
- 2.5. Gearboxes
- 2.6. Power Steering Components
- 2.7. Other
Automotive Mim Part Segmentation By Geography
-
1. North America
- 1.1. United States
- 1.2. Canada
- 1.3. Mexico
-
2. South America
- 2.1. Brazil
- 2.2. Argentina
- 2.3. Rest of South America
-
3. Europe
- 3.1. United Kingdom
- 3.2. Germany
- 3.3. France
- 3.4. Italy
- 3.5. Spain
- 3.6. Russia
- 3.7. Benelux
- 3.8. Nordics
- 3.9. Rest of Europe
-
4. Middle East & Africa
- 4.1. Turkey
- 4.2. Israel
- 4.3. GCC
- 4.4. North Africa
- 4.5. South Africa
- 4.6. Rest of Middle East & Africa
-
5. Asia Pacific
- 5.1. China
- 5.2. India
- 5.3. Japan
- 5.4. South Korea
- 5.5. ASEAN
- 5.6. Oceania
- 5.7. Rest of Asia Pacific
Automotive Mim Part Regional Market Share
Geographic Coverage of Automotive Mim Part
Automotive Mim Part REPORT HIGHLIGHTS
| Aspects | Details |
|---|---|
| Study Period | 2020-2034 |
| Base Year | 2025 |
| Estimated Year | 2026 |
| Forecast Period | 2026-2034 |
| Historical Period | 2020-2025 |
| Growth Rate | CAGR of XXX% from 2020-2034 |
| Segmentation |
|
Table of Contents
- 1. Introduction
- 1.1. Research Scope
- 1.2. Market Segmentation
- 1.3. Research Methodology
- 1.4. Definitions and Assumptions
- 2. Executive Summary
- 2.1. Introduction
- 3. Market Dynamics
- 3.1. Introduction
- 3.2. Market Drivers
- 3.3. Market Restrains
- 3.4. Market Trends
- 4. Market Factor Analysis
- 4.1. Porters Five Forces
- 4.2. Supply/Value Chain
- 4.3. PESTEL analysis
- 4.4. Market Entropy
- 4.5. Patent/Trademark Analysis
- 5. Global Automotive Mim Part Analysis, Insights and Forecast, 2020-2032
- 5.1. Market Analysis, Insights and Forecast - by Application
- 5.1.1. Passenger Cars
- 5.1.2. Commercial Vehicles
- 5.2. Market Analysis, Insights and Forecast - by Type
- 5.2.1. Turbocharged Parts
- 5.2.2. Regulating Rings
- 5.2.3. Injector Parts
- 5.2.4. Vane
- 5.2.5. Gearboxes
- 5.2.6. Power Steering Components
- 5.2.7. Other
- 5.3. Market Analysis, Insights and Forecast - by Region
- 5.3.1. North America
- 5.3.2. South America
- 5.3.3. Europe
- 5.3.4. Middle East & Africa
- 5.3.5. Asia Pacific
- 5.1. Market Analysis, Insights and Forecast - by Application
- 6. North America Automotive Mim Part Analysis, Insights and Forecast, 2020-2032
- 6.1. Market Analysis, Insights and Forecast - by Application
- 6.1.1. Passenger Cars
- 6.1.2. Commercial Vehicles
- 6.2. Market Analysis, Insights and Forecast - by Type
- 6.2.1. Turbocharged Parts
- 6.2.2. Regulating Rings
- 6.2.3. Injector Parts
- 6.2.4. Vane
- 6.2.5. Gearboxes
- 6.2.6. Power Steering Components
- 6.2.7. Other
- 6.1. Market Analysis, Insights and Forecast - by Application
- 7. South America Automotive Mim Part Analysis, Insights and Forecast, 2020-2032
- 7.1. Market Analysis, Insights and Forecast - by Application
- 7.1.1. Passenger Cars
- 7.1.2. Commercial Vehicles
- 7.2. Market Analysis, Insights and Forecast - by Type
- 7.2.1. Turbocharged Parts
- 7.2.2. Regulating Rings
- 7.2.3. Injector Parts
- 7.2.4. Vane
- 7.2.5. Gearboxes
- 7.2.6. Power Steering Components
- 7.2.7. Other
- 7.1. Market Analysis, Insights and Forecast - by Application
- 8. Europe Automotive Mim Part Analysis, Insights and Forecast, 2020-2032
- 8.1. Market Analysis, Insights and Forecast - by Application
- 8.1.1. Passenger Cars
- 8.1.2. Commercial Vehicles
- 8.2. Market Analysis, Insights and Forecast - by Type
- 8.2.1. Turbocharged Parts
- 8.2.2. Regulating Rings
- 8.2.3. Injector Parts
- 8.2.4. Vane
- 8.2.5. Gearboxes
- 8.2.6. Power Steering Components
- 8.2.7. Other
- 8.1. Market Analysis, Insights and Forecast - by Application
- 9. Middle East & Africa Automotive Mim Part Analysis, Insights and Forecast, 2020-2032
- 9.1. Market Analysis, Insights and Forecast - by Application
- 9.1.1. Passenger Cars
- 9.1.2. Commercial Vehicles
- 9.2. Market Analysis, Insights and Forecast - by Type
- 9.2.1. Turbocharged Parts
- 9.2.2. Regulating Rings
- 9.2.3. Injector Parts
- 9.2.4. Vane
- 9.2.5. Gearboxes
- 9.2.6. Power Steering Components
- 9.2.7. Other
- 9.1. Market Analysis, Insights and Forecast - by Application
- 10. Asia Pacific Automotive Mim Part Analysis, Insights and Forecast, 2020-2032
- 10.1. Market Analysis, Insights and Forecast - by Application
- 10.1.1. Passenger Cars
- 10.1.2. Commercial Vehicles
- 10.2. Market Analysis, Insights and Forecast - by Type
- 10.2.1. Turbocharged Parts
- 10.2.2. Regulating Rings
- 10.2.3. Injector Parts
- 10.2.4. Vane
- 10.2.5. Gearboxes
- 10.2.6. Power Steering Components
- 10.2.7. Other
- 10.1. Market Analysis, Insights and Forecast - by Application
- 11. Competitive Analysis
- 11.1. Global Market Share Analysis 2025
- 11.2. Company Profiles
- 11.2.1 Indo-MIM
- 11.2.1.1. Overview
- 11.2.1.2. Products
- 11.2.1.3. SWOT Analysis
- 11.2.1.4. Recent Developments
- 11.2.1.5. Financials (Based on Availability)
- 11.2.2 Fine Sinter Co.
- 11.2.2.1. Overview
- 11.2.2.2. Products
- 11.2.2.3. SWOT Analysis
- 11.2.2.4. Recent Developments
- 11.2.2.5. Financials (Based on Availability)
- 11.2.3 ARC Group
- 11.2.3.1. Overview
- 11.2.3.2. Products
- 11.2.3.3. SWOT Analysis
- 11.2.3.4. Recent Developments
- 11.2.3.5. Financials (Based on Availability)
- 11.2.4 NIPPON PISTON RING
- 11.2.4.1. Overview
- 11.2.4.2. Products
- 11.2.4.3. SWOT Analysis
- 11.2.4.4. Recent Developments
- 11.2.4.5. Financials (Based on Availability)
- 11.2.5 Schunk
- 11.2.5.1. Overview
- 11.2.5.2. Products
- 11.2.5.3. SWOT Analysis
- 11.2.5.4. Recent Developments
- 11.2.5.5. Financials (Based on Availability)
- 11.2.6 Sintex
- 11.2.6.1. Overview
- 11.2.6.2. Products
- 11.2.6.3. SWOT Analysis
- 11.2.6.4. Recent Developments
- 11.2.6.5. Financials (Based on Availability)
- 11.2.7 Smith Metal Products
- 11.2.7.1. Overview
- 11.2.7.2. Products
- 11.2.7.3. SWOT Analysis
- 11.2.7.4. Recent Developments
- 11.2.7.5. Financials (Based on Availability)
- 11.2.8 Dou Yee Technologies
- 11.2.8.1. Overview
- 11.2.8.2. Products
- 11.2.8.3. SWOT Analysis
- 11.2.8.4. Recent Developments
- 11.2.8.5. Financials (Based on Availability)
- 11.2.9 Gian Technology
- 11.2.9.1. Overview
- 11.2.9.2. Products
- 11.2.9.3. SWOT Analysis
- 11.2.9.4. Recent Developments
- 11.2.9.5. Financials (Based on Availability)
- 11.2.10 Shanghai Future High-tech Co.Ltd.
- 11.2.10.1. Overview
- 11.2.10.2. Products
- 11.2.10.3. SWOT Analysis
- 11.2.10.4. Recent Developments
- 11.2.10.5. Financials (Based on Availability)
- 11.2.11 Yangzhou Seashine New Materials
- 11.2.11.1. Overview
- 11.2.11.2. Products
- 11.2.11.3. SWOT Analysis
- 11.2.11.4. Recent Developments
- 11.2.11.5. Financials (Based on Availability)
- 11.2.12 Shenzhen Pacific Union Precision Manufacturing Co
- 11.2.12.1. Overview
- 11.2.12.2. Products
- 11.2.12.3. SWOT Analysis
- 11.2.12.4. Recent Developments
- 11.2.12.5. Financials (Based on Availability)
- 11.2.13 Nbtm New Materials Group Co.Ltd.
- 11.2.13.1. Overview
- 11.2.13.2. Products
- 11.2.13.3. SWOT Analysis
- 11.2.13.4. Recent Developments
- 11.2.13.5. Financials (Based on Availability)
- 11.2.14 KERSEN
- 11.2.14.1. Overview
- 11.2.14.2. Products
- 11.2.14.3. SWOT Analysis
- 11.2.14.4. Recent Developments
- 11.2.14.5. Financials (Based on Availability)
- 11.2.15 Shenzhen Evenwin Precision Technology
- 11.2.15.1. Overview
- 11.2.15.2. Products
- 11.2.15.3. SWOT Analysis
- 11.2.15.4. Recent Developments
- 11.2.15.5. Financials (Based on Availability)
- 11.2.16 Freewon China Co.Ltd.
- 11.2.16.1. Overview
- 11.2.16.2. Products
- 11.2.16.3. SWOT Analysis
- 11.2.16.4. Recent Developments
- 11.2.16.5. Financials (Based on Availability)
- 11.2.17 Greelife MIM Co. Ltd
- 11.2.17.1. Overview
- 11.2.17.2. Products
- 11.2.17.3. SWOT Analysis
- 11.2.17.4. Recent Developments
- 11.2.17.5. Financials (Based on Availability)
- 11.2.1 Indo-MIM
List of Figures
- Figure 1: Global Automotive Mim Part Revenue Breakdown (million, %) by Region 2025 & 2033
- Figure 2: Global Automotive Mim Part Volume Breakdown (K, %) by Region 2025 & 2033
- Figure 3: North America Automotive Mim Part Revenue (million), by Application 2025 & 2033
- Figure 4: North America Automotive Mim Part Volume (K), by Application 2025 & 2033
- Figure 5: North America Automotive Mim Part Revenue Share (%), by Application 2025 & 2033
- Figure 6: North America Automotive Mim Part Volume Share (%), by Application 2025 & 2033
- Figure 7: North America Automotive Mim Part Revenue (million), by Type 2025 & 2033
- Figure 8: North America Automotive Mim Part Volume (K), by Type 2025 & 2033
- Figure 9: North America Automotive Mim Part Revenue Share (%), by Type 2025 & 2033
- Figure 10: North America Automotive Mim Part Volume Share (%), by Type 2025 & 2033
- Figure 11: North America Automotive Mim Part Revenue (million), by Country 2025 & 2033
- Figure 12: North America Automotive Mim Part Volume (K), by Country 2025 & 2033
- Figure 13: North America Automotive Mim Part Revenue Share (%), by Country 2025 & 2033
- Figure 14: North America Automotive Mim Part Volume Share (%), by Country 2025 & 2033
- Figure 15: South America Automotive Mim Part Revenue (million), by Application 2025 & 2033
- Figure 16: South America Automotive Mim Part Volume (K), by Application 2025 & 2033
- Figure 17: South America Automotive Mim Part Revenue Share (%), by Application 2025 & 2033
- Figure 18: South America Automotive Mim Part Volume Share (%), by Application 2025 & 2033
- Figure 19: South America Automotive Mim Part Revenue (million), by Type 2025 & 2033
- Figure 20: South America Automotive Mim Part Volume (K), by Type 2025 & 2033
- Figure 21: South America Automotive Mim Part Revenue Share (%), by Type 2025 & 2033
- Figure 22: South America Automotive Mim Part Volume Share (%), by Type 2025 & 2033
- Figure 23: South America Automotive Mim Part Revenue (million), by Country 2025 & 2033
- Figure 24: South America Automotive Mim Part Volume (K), by Country 2025 & 2033
- Figure 25: South America Automotive Mim Part Revenue Share (%), by Country 2025 & 2033
- Figure 26: South America Automotive Mim Part Volume Share (%), by Country 2025 & 2033
- Figure 27: Europe Automotive Mim Part Revenue (million), by Application 2025 & 2033
- Figure 28: Europe Automotive Mim Part Volume (K), by Application 2025 & 2033
- Figure 29: Europe Automotive Mim Part Revenue Share (%), by Application 2025 & 2033
- Figure 30: Europe Automotive Mim Part Volume Share (%), by Application 2025 & 2033
- Figure 31: Europe Automotive Mim Part Revenue (million), by Type 2025 & 2033
- Figure 32: Europe Automotive Mim Part Volume (K), by Type 2025 & 2033
- Figure 33: Europe Automotive Mim Part Revenue Share (%), by Type 2025 & 2033
- Figure 34: Europe Automotive Mim Part Volume Share (%), by Type 2025 & 2033
- Figure 35: Europe Automotive Mim Part Revenue (million), by Country 2025 & 2033
- Figure 36: Europe Automotive Mim Part Volume (K), by Country 2025 & 2033
- Figure 37: Europe Automotive Mim Part Revenue Share (%), by Country 2025 & 2033
- Figure 38: Europe Automotive Mim Part Volume Share (%), by Country 2025 & 2033
- Figure 39: Middle East & Africa Automotive Mim Part Revenue (million), by Application 2025 & 2033
- Figure 40: Middle East & Africa Automotive Mim Part Volume (K), by Application 2025 & 2033
- Figure 41: Middle East & Africa Automotive Mim Part Revenue Share (%), by Application 2025 & 2033
- Figure 42: Middle East & Africa Automotive Mim Part Volume Share (%), by Application 2025 & 2033
- Figure 43: Middle East & Africa Automotive Mim Part Revenue (million), by Type 2025 & 2033
- Figure 44: Middle East & Africa Automotive Mim Part Volume (K), by Type 2025 & 2033
- Figure 45: Middle East & Africa Automotive Mim Part Revenue Share (%), by Type 2025 & 2033
- Figure 46: Middle East & Africa Automotive Mim Part Volume Share (%), by Type 2025 & 2033
- Figure 47: Middle East & Africa Automotive Mim Part Revenue (million), by Country 2025 & 2033
- Figure 48: Middle East & Africa Automotive Mim Part Volume (K), by Country 2025 & 2033
- Figure 49: Middle East & Africa Automotive Mim Part Revenue Share (%), by Country 2025 & 2033
- Figure 50: Middle East & Africa Automotive Mim Part Volume Share (%), by Country 2025 & 2033
- Figure 51: Asia Pacific Automotive Mim Part Revenue (million), by Application 2025 & 2033
- Figure 52: Asia Pacific Automotive Mim Part Volume (K), by Application 2025 & 2033
- Figure 53: Asia Pacific Automotive Mim Part Revenue Share (%), by Application 2025 & 2033
- Figure 54: Asia Pacific Automotive Mim Part Volume Share (%), by Application 2025 & 2033
- Figure 55: Asia Pacific Automotive Mim Part Revenue (million), by Type 2025 & 2033
- Figure 56: Asia Pacific Automotive Mim Part Volume (K), by Type 2025 & 2033
- Figure 57: Asia Pacific Automotive Mim Part Revenue Share (%), by Type 2025 & 2033
- Figure 58: Asia Pacific Automotive Mim Part Volume Share (%), by Type 2025 & 2033
- Figure 59: Asia Pacific Automotive Mim Part Revenue (million), by Country 2025 & 2033
- Figure 60: Asia Pacific Automotive Mim Part Volume (K), by Country 2025 & 2033
- Figure 61: Asia Pacific Automotive Mim Part Revenue Share (%), by Country 2025 & 2033
- Figure 62: Asia Pacific Automotive Mim Part Volume Share (%), by Country 2025 & 2033
List of Tables
- Table 1: Global Automotive Mim Part Revenue million Forecast, by Application 2020 & 2033
- Table 2: Global Automotive Mim Part Volume K Forecast, by Application 2020 & 2033
- Table 3: Global Automotive Mim Part Revenue million Forecast, by Type 2020 & 2033
- Table 4: Global Automotive Mim Part Volume K Forecast, by Type 2020 & 2033
- Table 5: Global Automotive Mim Part Revenue million Forecast, by Region 2020 & 2033
- Table 6: Global Automotive Mim Part Volume K Forecast, by Region 2020 & 2033
- Table 7: Global Automotive Mim Part Revenue million Forecast, by Application 2020 & 2033
- Table 8: Global Automotive Mim Part Volume K Forecast, by Application 2020 & 2033
- Table 9: Global Automotive Mim Part Revenue million Forecast, by Type 2020 & 2033
- Table 10: Global Automotive Mim Part Volume K Forecast, by Type 2020 & 2033
- Table 11: Global Automotive Mim Part Revenue million Forecast, by Country 2020 & 2033
- Table 12: Global Automotive Mim Part Volume K Forecast, by Country 2020 & 2033
- Table 13: United States Automotive Mim Part Revenue (million) Forecast, by Application 2020 & 2033
- Table 14: United States Automotive Mim Part Volume (K) Forecast, by Application 2020 & 2033
- Table 15: Canada Automotive Mim Part Revenue (million) Forecast, by Application 2020 & 2033
- Table 16: Canada Automotive Mim Part Volume (K) Forecast, by Application 2020 & 2033
- Table 17: Mexico Automotive Mim Part Revenue (million) Forecast, by Application 2020 & 2033
- Table 18: Mexico Automotive Mim Part Volume (K) Forecast, by Application 2020 & 2033
- Table 19: Global Automotive Mim Part Revenue million Forecast, by Application 2020 & 2033
- Table 20: Global Automotive Mim Part Volume K Forecast, by Application 2020 & 2033
- Table 21: Global Automotive Mim Part Revenue million Forecast, by Type 2020 & 2033
- Table 22: Global Automotive Mim Part Volume K Forecast, by Type 2020 & 2033
- Table 23: Global Automotive Mim Part Revenue million Forecast, by Country 2020 & 2033
- Table 24: Global Automotive Mim Part Volume K Forecast, by Country 2020 & 2033
- Table 25: Brazil Automotive Mim Part Revenue (million) Forecast, by Application 2020 & 2033
- Table 26: Brazil Automotive Mim Part Volume (K) Forecast, by Application 2020 & 2033
- Table 27: Argentina Automotive Mim Part Revenue (million) Forecast, by Application 2020 & 2033
- Table 28: Argentina Automotive Mim Part Volume (K) Forecast, by Application 2020 & 2033
- Table 29: Rest of South America Automotive Mim Part Revenue (million) Forecast, by Application 2020 & 2033
- Table 30: Rest of South America Automotive Mim Part Volume (K) Forecast, by Application 2020 & 2033
- Table 31: Global Automotive Mim Part Revenue million Forecast, by Application 2020 & 2033
- Table 32: Global Automotive Mim Part Volume K Forecast, by Application 2020 & 2033
- Table 33: Global Automotive Mim Part Revenue million Forecast, by Type 2020 & 2033
- Table 34: Global Automotive Mim Part Volume K Forecast, by Type 2020 & 2033
- Table 35: Global Automotive Mim Part Revenue million Forecast, by Country 2020 & 2033
- Table 36: Global Automotive Mim Part Volume K Forecast, by Country 2020 & 2033
- Table 37: United Kingdom Automotive Mim Part Revenue (million) Forecast, by Application 2020 & 2033
- Table 38: United Kingdom Automotive Mim Part Volume (K) Forecast, by Application 2020 & 2033
- Table 39: Germany Automotive Mim Part Revenue (million) Forecast, by Application 2020 & 2033
- Table 40: Germany Automotive Mim Part Volume (K) Forecast, by Application 2020 & 2033
- Table 41: France Automotive Mim Part Revenue (million) Forecast, by Application 2020 & 2033
- Table 42: France Automotive Mim Part Volume (K) Forecast, by Application 2020 & 2033
- Table 43: Italy Automotive Mim Part Revenue (million) Forecast, by Application 2020 & 2033
- Table 44: Italy Automotive Mim Part Volume (K) Forecast, by Application 2020 & 2033
- Table 45: Spain Automotive Mim Part Revenue (million) Forecast, by Application 2020 & 2033
- Table 46: Spain Automotive Mim Part Volume (K) Forecast, by Application 2020 & 2033
- Table 47: Russia Automotive Mim Part Revenue (million) Forecast, by Application 2020 & 2033
- Table 48: Russia Automotive Mim Part Volume (K) Forecast, by Application 2020 & 2033
- Table 49: Benelux Automotive Mim Part Revenue (million) Forecast, by Application 2020 & 2033
- Table 50: Benelux Automotive Mim Part Volume (K) Forecast, by Application 2020 & 2033
- Table 51: Nordics Automotive Mim Part Revenue (million) Forecast, by Application 2020 & 2033
- Table 52: Nordics Automotive Mim Part Volume (K) Forecast, by Application 2020 & 2033
- Table 53: Rest of Europe Automotive Mim Part Revenue (million) Forecast, by Application 2020 & 2033
- Table 54: Rest of Europe Automotive Mim Part Volume (K) Forecast, by Application 2020 & 2033
- Table 55: Global Automotive Mim Part Revenue million Forecast, by Application 2020 & 2033
- Table 56: Global Automotive Mim Part Volume K Forecast, by Application 2020 & 2033
- Table 57: Global Automotive Mim Part Revenue million Forecast, by Type 2020 & 2033
- Table 58: Global Automotive Mim Part Volume K Forecast, by Type 2020 & 2033
- Table 59: Global Automotive Mim Part Revenue million Forecast, by Country 2020 & 2033
- Table 60: Global Automotive Mim Part Volume K Forecast, by Country 2020 & 2033
- Table 61: Turkey Automotive Mim Part Revenue (million) Forecast, by Application 2020 & 2033
- Table 62: Turkey Automotive Mim Part Volume (K) Forecast, by Application 2020 & 2033
- Table 63: Israel Automotive Mim Part Revenue (million) Forecast, by Application 2020 & 2033
- Table 64: Israel Automotive Mim Part Volume (K) Forecast, by Application 2020 & 2033
- Table 65: GCC Automotive Mim Part Revenue (million) Forecast, by Application 2020 & 2033
- Table 66: GCC Automotive Mim Part Volume (K) Forecast, by Application 2020 & 2033
- Table 67: North Africa Automotive Mim Part Revenue (million) Forecast, by Application 2020 & 2033
- Table 68: North Africa Automotive Mim Part Volume (K) Forecast, by Application 2020 & 2033
- Table 69: South Africa Automotive Mim Part Revenue (million) Forecast, by Application 2020 & 2033
- Table 70: South Africa Automotive Mim Part Volume (K) Forecast, by Application 2020 & 2033
- Table 71: Rest of Middle East & Africa Automotive Mim Part Revenue (million) Forecast, by Application 2020 & 2033
- Table 72: Rest of Middle East & Africa Automotive Mim Part Volume (K) Forecast, by Application 2020 & 2033
- Table 73: Global Automotive Mim Part Revenue million Forecast, by Application 2020 & 2033
- Table 74: Global Automotive Mim Part Volume K Forecast, by Application 2020 & 2033
- Table 75: Global Automotive Mim Part Revenue million Forecast, by Type 2020 & 2033
- Table 76: Global Automotive Mim Part Volume K Forecast, by Type 2020 & 2033
- Table 77: Global Automotive Mim Part Revenue million Forecast, by Country 2020 & 2033
- Table 78: Global Automotive Mim Part Volume K Forecast, by Country 2020 & 2033
- Table 79: China Automotive Mim Part Revenue (million) Forecast, by Application 2020 & 2033
- Table 80: China Automotive Mim Part Volume (K) Forecast, by Application 2020 & 2033
- Table 81: India Automotive Mim Part Revenue (million) Forecast, by Application 2020 & 2033
- Table 82: India Automotive Mim Part Volume (K) Forecast, by Application 2020 & 2033
- Table 83: Japan Automotive Mim Part Revenue (million) Forecast, by Application 2020 & 2033
- Table 84: Japan Automotive Mim Part Volume (K) Forecast, by Application 2020 & 2033
- Table 85: South Korea Automotive Mim Part Revenue (million) Forecast, by Application 2020 & 2033
- Table 86: South Korea Automotive Mim Part Volume (K) Forecast, by Application 2020 & 2033
- Table 87: ASEAN Automotive Mim Part Revenue (million) Forecast, by Application 2020 & 2033
- Table 88: ASEAN Automotive Mim Part Volume (K) Forecast, by Application 2020 & 2033
- Table 89: Oceania Automotive Mim Part Revenue (million) Forecast, by Application 2020 & 2033
- Table 90: Oceania Automotive Mim Part Volume (K) Forecast, by Application 2020 & 2033
- Table 91: Rest of Asia Pacific Automotive Mim Part Revenue (million) Forecast, by Application 2020 & 2033
- Table 92: Rest of Asia Pacific Automotive Mim Part Volume (K) Forecast, by Application 2020 & 2033
Frequently Asked Questions
1. What is the projected Compound Annual Growth Rate (CAGR) of the Automotive Mim Part?
The projected CAGR is approximately XXX%.
2. Which companies are prominent players in the Automotive Mim Part?
Key companies in the market include Indo-MIM, Fine Sinter Co., ARC Group, NIPPON PISTON RING, Schunk, Sintex, Smith Metal Products, Dou Yee Technologies, Gian Technology, Shanghai Future High-tech Co.,Ltd., Yangzhou Seashine New Materials, Shenzhen Pacific Union Precision Manufacturing Co, Nbtm New Materials Group Co.,Ltd., KERSEN, Shenzhen Evenwin Precision Technology, Freewon China Co.,Ltd., Greelife MIM Co., Ltd.
3. What are the main segments of the Automotive Mim Part?
The market segments include Application, Type.
4. Can you provide details about the market size?
The market size is estimated to be USD XXX million as of 2022.
5. What are some drivers contributing to market growth?
N/A
6. What are the notable trends driving market growth?
N/A
7. Are there any restraints impacting market growth?
N/A
8. Can you provide examples of recent developments in the market?
N/A
9. What pricing options are available for accessing the report?
Pricing options include single-user, multi-user, and enterprise licenses priced at USD 3950.00, USD 5925.00, and USD 7900.00 respectively.
10. Is the market size provided in terms of value or volume?
The market size is provided in terms of value, measured in million and volume, measured in K.
11. Are there any specific market keywords associated with the report?
Yes, the market keyword associated with the report is "Automotive Mim Part," which aids in identifying and referencing the specific market segment covered.
12. How do I determine which pricing option suits my needs best?
The pricing options vary based on user requirements and access needs. Individual users may opt for single-user licenses, while businesses requiring broader access may choose multi-user or enterprise licenses for cost-effective access to the report.
13. Are there any additional resources or data provided in the Automotive Mim Part report?
While the report offers comprehensive insights, it's advisable to review the specific contents or supplementary materials provided to ascertain if additional resources or data are available.
14. How can I stay updated on further developments or reports in the Automotive Mim Part?
To stay informed about further developments, trends, and reports in the Automotive Mim Part, consider subscribing to industry newsletters, following relevant companies and organizations, or regularly checking reputable industry news sources and publications.
Methodology
Step 1 - Identification of Relevant Samples Size from Population Database


Step 2 - Approaches for Defining Global Market Size (Value, Volume* & Price*)

Note*: In applicable scenarios
Step 3 - Data Sources
Primary Research
- Web Analytics
- Survey Reports
- Research Institute
- Latest Research Reports
- Opinion Leaders
Secondary Research
- Annual Reports
- White Paper
- Latest Press Release
- Industry Association
- Paid Database
- Investor Presentations

Step 4 - Data Triangulation
Involves using different sources of information in order to increase the validity of a study
These sources are likely to be stakeholders in a program - participants, other researchers, program staff, other community members, and so on.
Then we put all data in single framework & apply various statistical tools to find out the dynamic on the market.
During the analysis stage, feedback from the stakeholder groups would be compared to determine areas of agreement as well as areas of divergence