

Key Insights
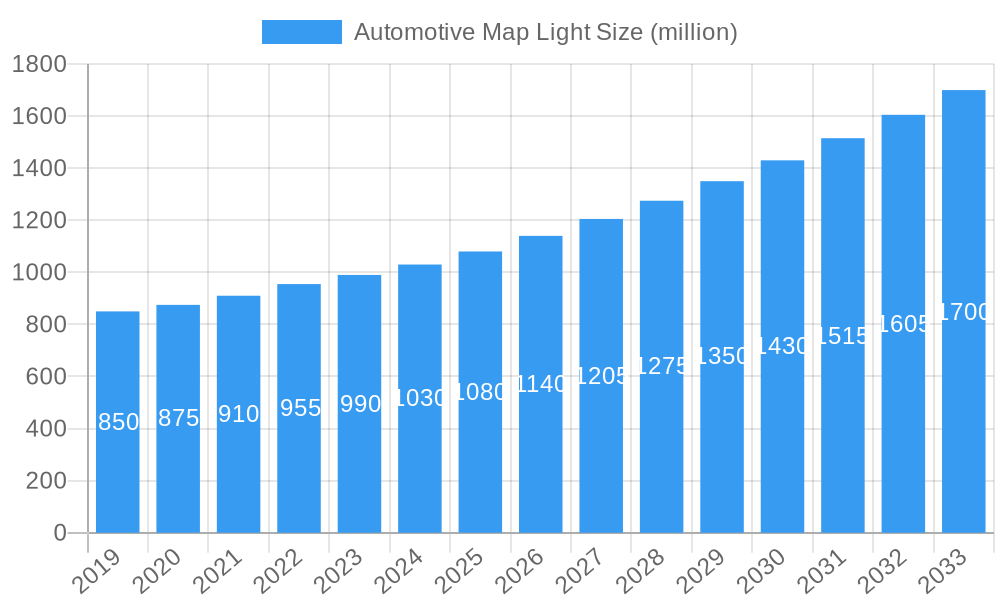
The global Automotive Map Light market is poised for robust expansion, projected to reach approximately \$1,500 million by 2033, growing at a Compound Annual Growth Rate (CAGR) of around 6.5% from an estimated \$1,000 million in 2025. This growth is primarily fueled by the increasing demand for enhanced interior lighting solutions in vehicles, driven by evolving consumer expectations for comfort and convenience. Advancements in LED technology are a significant catalyst, offering superior brightness, energy efficiency, and longevity compared to traditional Halogen and Xenon options. Furthermore, the rising production of both commercial vehicles and passenger cars globally, especially in emerging economies, directly translates to a larger addressable market for automotive map lights. The integration of smart lighting features, responsive to ambient conditions and driver needs, is also gaining traction, further stimulating market development.
Automotive Map Light Market Size (In Million)
The market's trajectory is shaped by several key drivers, including the increasing adoption of advanced driver-assistance systems (ADAS) that often incorporate sophisticated interior lighting elements, and the growing emphasis on vehicle aesthetics and premium in-cabin experiences. Technological innovation, particularly in the miniaturization and improved functionality of LED modules, is enabling more versatile and integrated map lighting solutions. However, the market faces some restraints, such as the high initial cost of advanced lighting systems and the complexity of integration into existing vehicle architectures. Despite these challenges, the segment of LED map lights is expected to dominate the market due to its inherent advantages. Geographically, Asia Pacific, led by China and India, is anticipated to be the largest and fastest-growing region, owing to its massive automotive production base and burgeoning consumer market. North America and Europe also represent significant markets, driven by stringent safety regulations and a high demand for premium automotive features.
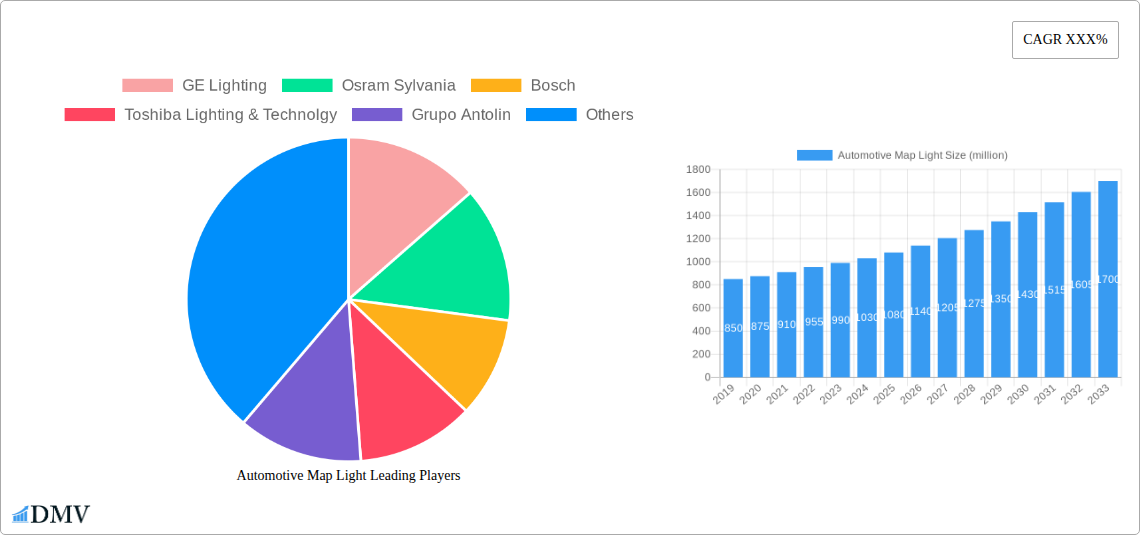
Automotive Map Light Company Market Share
Automotive Map Light Market Composition & Trends
The global Automotive Map Light market is characterized by a dynamic landscape, with key players like GE Lighting, Osram Sylvania, Bosch, and Philips vying for substantial market share. Our analysis reveals a moderate market concentration, driven by continuous innovation and evolving regulatory mandates for enhanced automotive safety and interior illumination. The study period, from 2019 to 2033, with a base year of 2025, forecasts significant growth fueled by the increasing adoption of advanced lighting technologies. Substitute products, primarily traditional incandescent bulbs, are rapidly being displaced by energy-efficient and long-lasting LED solutions, which now dominate the market. End-user profiles are segmented into passenger car and commercial vehicle applications, with passenger cars representing the larger segment due to higher production volumes and a greater emphasis on premium interior features. Mergers and acquisitions are an integral part of market evolution, with significant deal values projected in the coming years as companies consolidate to expand their technological capabilities and market reach. For instance, strategic partnerships and acquisitions within the automotive lighting supply chain are anticipated to reshape market dynamics, with estimated M&A deal values reaching several hundred million dollars by 2033.
- Market Share Distribution: The LED segment is projected to capture over 70 million units by 2025, driven by its superior performance and energy efficiency.
- M&A Deal Values: Anticipated M&A activity is expected to involve transactions with values ranging from 50 million to 500 million dollars, bolstering market consolidation.
- Innovation Catalysts: Advancements in LED technology, smart lighting integration, and aesthetic design are primary drivers of product development.
- Regulatory Landscapes: Stringent safety regulations and emission standards indirectly promote the adoption of energy-efficient lighting solutions.
- Substitute Products: The market share of halogen and xenon types is progressively declining, with LEDs becoming the de facto standard.
- End-User Profiles: Passenger car manufacturers account for approximately 80 million units of demand, while commercial vehicles contribute an additional 20 million units annually.
Automotive Map Light Industry Evolution
The Automotive Map Light industry has undergone a remarkable transformation, evolving from basic illumination to sophisticated, integrated lighting solutions. Over the historical period of 2019–2024, we witnessed a steady shift away from traditional halogen and xenon technologies towards energy-efficient LED lighting. This transition has been propelled by a confluence of factors including rising fuel efficiency standards, increasing consumer demand for premium interior aesthetics, and advancements in semiconductor technology that have made LEDs more affordable and versatile. The market growth trajectory has been consistently upward, with an average annual growth rate of approximately 7% during the historical period. Looking ahead, the forecast period of 2025–2033 projects an accelerated growth rate of around 8.5%, driven by the widespread adoption of smart lighting features, advanced driver-assistance systems (ADAS) integration, and the burgeoning electric vehicle (EV) market.
Technological advancements have been pivotal in this evolution. The introduction of high-brightness, low-power consumption LEDs has enabled automotive manufacturers to integrate map lights seamlessly into vehicle interiors, offering greater design flexibility and reduced power draw. Furthermore, the development of advanced control systems has allowed for customizable brightness, color temperature, and even dynamic lighting effects, enhancing the driving experience and passenger comfort. Consumer demand is increasingly leaning towards sophisticated interior lighting that contributes to the overall ambiance and functionality of the vehicle. Features like proximity sensors for touchless operation, voice-activated controls, and personalized lighting profiles are becoming key differentiators for automotive manufacturers. The adoption metrics for LED map lights have surged, moving from approximately 50 million units in 2019 to an estimated 85 million units in 2024. This trend is expected to continue, with LED map lights projected to represent over 95% of the total market by 2033, underscoring their dominance. The industry is also witnessing increased investment in research and development focused on innovative materials, improved thermal management for LEDs, and the integration of augmented reality (AR) capabilities within interior lighting. The estimated market size for automotive map lights, which stood at approximately 2 billion dollars in 2019, is projected to reach over 5 billion dollars by 2033, reflecting this robust growth and evolution.
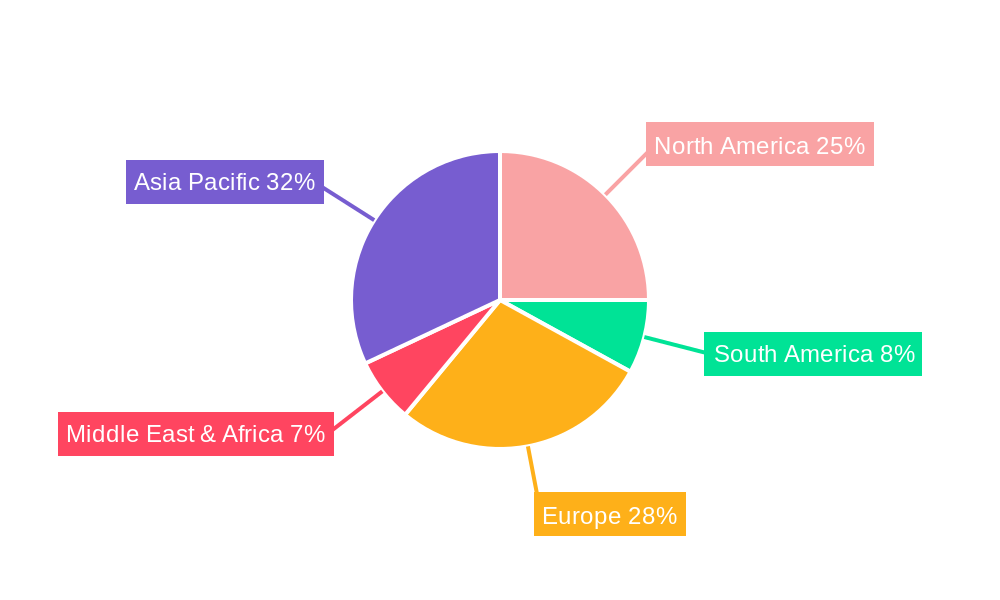
Leading Regions, Countries, or Segments in Automotive Map Light
The global Automotive Map Light market exhibits distinct regional dominance, with Asia Pacific emerging as the leading powerhouse. This supremacy is attributed to a robust automotive manufacturing base, significant investments in R&D for advanced lighting technologies, and a burgeoning consumer market with a growing appetite for technologically advanced vehicles. Within Asia Pacific, China spearheads this growth, driven by its status as the world's largest automotive producer and consumer, alongside substantial government support for the automotive sector.
- Dominant Application Segment: Passenger Cars represent the most significant application segment, accounting for an estimated 75 million units in 2025. This dominance is fueled by the high production volumes of passenger vehicles globally and the increasing consumer expectation for sophisticated and customizable interior lighting features that enhance the overall driving experience and cabin ambiance.
- Dominant Technology Segment: LED technology is the undisputed leader in the automotive map light market, with projected adoption rates exceeding 90% by 2025. The superior energy efficiency, extended lifespan, compact form factor, and versatility in terms of color and brightness make LEDs the preferred choice for modern vehicle interiors.
- Key Drivers in Asia Pacific:
- Manufacturing Hub: The region's established automotive manufacturing infrastructure, particularly in China, South Korea, and Japan, provides a strong foundation for map light production and innovation.
- Technological Advancements: Significant investment in R&D by leading players like Toshiba Lighting & Technology, Changzhou Xingyu, and Varroc within the region is driving the adoption of cutting-edge map light solutions.
- Growing Middle Class: An expanding middle class across Asia Pacific countries is leading to increased demand for new vehicles equipped with premium features, including advanced interior lighting.
- Regulatory Support: Favorable government policies aimed at promoting the automotive industry and encouraging the adoption of energy-efficient technologies contribute to market growth.
In-depth analysis reveals that within the passenger car segment, the demand for map lights is driven by aesthetic considerations and the integration of smart features. Consumers are increasingly seeking map lights that can adapt to different driving conditions, offer ambient lighting options, and contribute to a luxurious cabin environment. Commercial vehicles, while representing a smaller segment, are also seeing advancements in map light technology, with a focus on durability, functionality, and enhanced visibility for drivers during long hauls. The transition to LED technology in both segments is a universal trend, driven by regulatory pressures for energy efficiency and the inherent performance advantages of LEDs. The estimated market value in Asia Pacific alone is projected to exceed 2 billion dollars by 2025, underscoring its pivotal role in shaping the global automotive map light landscape.
Automotive Map Light Product Innovations
Automotive map lights are rapidly evolving beyond simple illumination. Innovations are focused on enhancing user experience, integrating smart functionalities, and improving energy efficiency. Philips, GE Lighting, and Osram Sylvania are at the forefront, developing map lights with adaptive brightness that adjust based on ambient light conditions, reducing driver distraction. Furthermore, the integration of proximity sensors for touchless operation and voice control capabilities is enhancing convenience and hygiene. Advanced LED technologies are enabling the development of customizable color temperature and hue, allowing for personalized cabin ambiance. These innovations not only elevate the in-car experience but also contribute to vehicle safety by providing optimal visibility without compromising the driver's focus. The performance metrics are continually improving, with LEDs offering longer lifespans measured in tens of thousands of hours and significantly lower power consumption compared to older technologies.
Propelling Factors for Automotive Map Light Growth
The automotive map light market is experiencing robust growth driven by several key factors. The escalating demand for advanced in-car features and a premium user experience is a primary catalyst, compelling manufacturers to integrate more sophisticated lighting solutions. Technological advancements, particularly in LED technology, have made these lights more energy-efficient, durable, and versatile, aligning with automotive industry trends towards sustainability and innovation. Furthermore, stringent automotive safety regulations worldwide are indirectly promoting the adoption of improved interior lighting for enhanced driver visibility and reduced fatigue. The increasing production of electric vehicles (EVs), which often feature more advanced interior designs and require optimized energy consumption, also contributes to the demand for modern map lights.
Obstacles in the Automotive Map Light Market
Despite the promising growth, the automotive map light market faces certain obstacles. The highly competitive nature of the lighting industry, with numerous global and regional players, can lead to pricing pressures and impact profit margins. Supply chain disruptions, as experienced in recent years, can affect the availability of critical components and lead to production delays. Moreover, the significant upfront investment required for research and development of next-generation lighting technologies can be a barrier for smaller companies. The evolving regulatory landscape, while often a driver, can also present challenges if new standards are implemented rapidly, requiring substantial retooling and redesign efforts from manufacturers.
Future Opportunities in Automotive Map Light
The automotive map light market is poised for significant future opportunities. The increasing integration of smart technologies, such as AI-powered adaptive lighting and gesture controls, presents a vast potential for product differentiation and value creation. The expansion of the autonomous vehicle market will necessitate advanced interior lighting for passenger comfort and information display. Emerging markets in developing economies, with their rapidly growing automotive sectors, offer substantial untapped potential. Furthermore, the trend towards sustainable mobility is driving demand for energy-efficient and eco-friendly lighting solutions, creating opportunities for manufacturers focused on green technologies.
Major Players in the Automotive Map Light Ecosystem
- GE Lighting
- Osram Sylvania
- Bosch
- Toshiba Lighting & Technolgy
- Grupo Antolin
- Tenneco(Federal-Mogul)
- HASCO VISION
- Changzhou Xingyu
- Varroc
- Philips
- Ring Automotive
- Wagner Brake
- Chang Yao Limited
- PIAA
- ZKW Group
- SL Corporation
- TYC
- DEPO
Key Developments in Automotive Map Light Industry
- January 2024: Philips launched a new range of compact, high-efficiency LED map lights for premium vehicle segments.
- November 2023: Bosch announced a strategic partnership with a leading AI firm to integrate advanced gesture control into automotive lighting systems.
- July 2023: Osram Sylvania introduced innovative map lights with customizable color temperatures to enhance driver comfort.
- March 2023: Grupo Antolin showcased its latest interior lighting solutions, including integrated map lights with ambient lighting features, at a major automotive trade show.
- December 2022: GE Lighting announced a significant investment in R&D for next-generation smart automotive lighting, including advanced map light technologies.
Strategic Automotive Map Light Market Forecast
The strategic automotive map light market forecast indicates a robust expansion, driven by sustained technological innovation, evolving consumer preferences for premium in-car experiences, and a growing emphasis on vehicle safety and energy efficiency. The widespread adoption of LED technology, coupled with the integration of smart functionalities like adaptive brightness and gesture control, will be key growth catalysts. Emerging markets and the continuous development of electric and autonomous vehicles will further fuel demand. The market is projected to witness significant growth, with an estimated compound annual growth rate of over 8% during the forecast period, presenting substantial opportunities for stakeholders across the value chain.
Automotive Map Light Segmentation
-
1. Application
- 1.1. Commercial Vehicle
- 1.2. Passenger Car
-
2. Type
- 2.1. LED
- 2.2. Halogen
- 2.3. Xenon
Automotive Map Light Segmentation By Geography
-
1. North America
- 1.1. United States
- 1.2. Canada
- 1.3. Mexico
-
2. South America
- 2.1. Brazil
- 2.2. Argentina
- 2.3. Rest of South America
-
3. Europe
- 3.1. United Kingdom
- 3.2. Germany
- 3.3. France
- 3.4. Italy
- 3.5. Spain
- 3.6. Russia
- 3.7. Benelux
- 3.8. Nordics
- 3.9. Rest of Europe
-
4. Middle East & Africa
- 4.1. Turkey
- 4.2. Israel
- 4.3. GCC
- 4.4. North Africa
- 4.5. South Africa
- 4.6. Rest of Middle East & Africa
-
5. Asia Pacific
- 5.1. China
- 5.2. India
- 5.3. Japan
- 5.4. South Korea
- 5.5. ASEAN
- 5.6. Oceania
- 5.7. Rest of Asia Pacific
Automotive Map Light Regional Market Share
Geographic Coverage of Automotive Map Light
Automotive Map Light REPORT HIGHLIGHTS
| Aspects | Details |
|---|---|
| Study Period | 2020-2034 |
| Base Year | 2025 |
| Estimated Year | 2026 |
| Forecast Period | 2026-2034 |
| Historical Period | 2020-2025 |
| Growth Rate | CAGR of 6.5% from 2020-2034 |
| Segmentation |
|
Table of Contents
- 1. Introduction
- 1.1. Research Scope
- 1.2. Market Segmentation
- 1.3. Research Methodology
- 1.4. Definitions and Assumptions
- 2. Executive Summary
- 2.1. Introduction
- 3. Market Dynamics
- 3.1. Introduction
- 3.2. Market Drivers
- 3.3. Market Restrains
- 3.4. Market Trends
- 4. Market Factor Analysis
- 4.1. Porters Five Forces
- 4.2. Supply/Value Chain
- 4.3. PESTEL analysis
- 4.4. Market Entropy
- 4.5. Patent/Trademark Analysis
- 5. Global Automotive Map Light Analysis, Insights and Forecast, 2020-2032
- 5.1. Market Analysis, Insights and Forecast - by Application
- 5.1.1. Commercial Vehicle
- 5.1.2. Passenger Car
- 5.2. Market Analysis, Insights and Forecast - by Type
- 5.2.1. LED
- 5.2.2. Halogen
- 5.2.3. Xenon
- 5.3. Market Analysis, Insights and Forecast - by Region
- 5.3.1. North America
- 5.3.2. South America
- 5.3.3. Europe
- 5.3.4. Middle East & Africa
- 5.3.5. Asia Pacific
- 5.1. Market Analysis, Insights and Forecast - by Application
- 6. North America Automotive Map Light Analysis, Insights and Forecast, 2020-2032
- 6.1. Market Analysis, Insights and Forecast - by Application
- 6.1.1. Commercial Vehicle
- 6.1.2. Passenger Car
- 6.2. Market Analysis, Insights and Forecast - by Type
- 6.2.1. LED
- 6.2.2. Halogen
- 6.2.3. Xenon
- 6.1. Market Analysis, Insights and Forecast - by Application
- 7. South America Automotive Map Light Analysis, Insights and Forecast, 2020-2032
- 7.1. Market Analysis, Insights and Forecast - by Application
- 7.1.1. Commercial Vehicle
- 7.1.2. Passenger Car
- 7.2. Market Analysis, Insights and Forecast - by Type
- 7.2.1. LED
- 7.2.2. Halogen
- 7.2.3. Xenon
- 7.1. Market Analysis, Insights and Forecast - by Application
- 8. Europe Automotive Map Light Analysis, Insights and Forecast, 2020-2032
- 8.1. Market Analysis, Insights and Forecast - by Application
- 8.1.1. Commercial Vehicle
- 8.1.2. Passenger Car
- 8.2. Market Analysis, Insights and Forecast - by Type
- 8.2.1. LED
- 8.2.2. Halogen
- 8.2.3. Xenon
- 8.1. Market Analysis, Insights and Forecast - by Application
- 9. Middle East & Africa Automotive Map Light Analysis, Insights and Forecast, 2020-2032
- 9.1. Market Analysis, Insights and Forecast - by Application
- 9.1.1. Commercial Vehicle
- 9.1.2. Passenger Car
- 9.2. Market Analysis, Insights and Forecast - by Type
- 9.2.1. LED
- 9.2.2. Halogen
- 9.2.3. Xenon
- 9.1. Market Analysis, Insights and Forecast - by Application
- 10. Asia Pacific Automotive Map Light Analysis, Insights and Forecast, 2020-2032
- 10.1. Market Analysis, Insights and Forecast - by Application
- 10.1.1. Commercial Vehicle
- 10.1.2. Passenger Car
- 10.2. Market Analysis, Insights and Forecast - by Type
- 10.2.1. LED
- 10.2.2. Halogen
- 10.2.3. Xenon
- 10.1. Market Analysis, Insights and Forecast - by Application
- 11. Competitive Analysis
- 11.1. Global Market Share Analysis 2025
- 11.2. Company Profiles
- 11.2.1 GE Lighting
- 11.2.1.1. Overview
- 11.2.1.2. Products
- 11.2.1.3. SWOT Analysis
- 11.2.1.4. Recent Developments
- 11.2.1.5. Financials (Based on Availability)
- 11.2.2 Osram Sylvania
- 11.2.2.1. Overview
- 11.2.2.2. Products
- 11.2.2.3. SWOT Analysis
- 11.2.2.4. Recent Developments
- 11.2.2.5. Financials (Based on Availability)
- 11.2.3 Bosch
- 11.2.3.1. Overview
- 11.2.3.2. Products
- 11.2.3.3. SWOT Analysis
- 11.2.3.4. Recent Developments
- 11.2.3.5. Financials (Based on Availability)
- 11.2.4 Toshiba Lighting & Technolgy
- 11.2.4.1. Overview
- 11.2.4.2. Products
- 11.2.4.3. SWOT Analysis
- 11.2.4.4. Recent Developments
- 11.2.4.5. Financials (Based on Availability)
- 11.2.5 Grupo Antolin
- 11.2.5.1. Overview
- 11.2.5.2. Products
- 11.2.5.3. SWOT Analysis
- 11.2.5.4. Recent Developments
- 11.2.5.5. Financials (Based on Availability)
- 11.2.6 Tenneco(Federal-Mogul)
- 11.2.6.1. Overview
- 11.2.6.2. Products
- 11.2.6.3. SWOT Analysis
- 11.2.6.4. Recent Developments
- 11.2.6.5. Financials (Based on Availability)
- 11.2.7 HASCO VISION
- 11.2.7.1. Overview
- 11.2.7.2. Products
- 11.2.7.3. SWOT Analysis
- 11.2.7.4. Recent Developments
- 11.2.7.5. Financials (Based on Availability)
- 11.2.8 Changzhou Xingyu
- 11.2.8.1. Overview
- 11.2.8.2. Products
- 11.2.8.3. SWOT Analysis
- 11.2.8.4. Recent Developments
- 11.2.8.5. Financials (Based on Availability)
- 11.2.9 Varroc
- 11.2.9.1. Overview
- 11.2.9.2. Products
- 11.2.9.3. SWOT Analysis
- 11.2.9.4. Recent Developments
- 11.2.9.5. Financials (Based on Availability)
- 11.2.10 Philips
- 11.2.10.1. Overview
- 11.2.10.2. Products
- 11.2.10.3. SWOT Analysis
- 11.2.10.4. Recent Developments
- 11.2.10.5. Financials (Based on Availability)
- 11.2.11 Ring Automotive
- 11.2.11.1. Overview
- 11.2.11.2. Products
- 11.2.11.3. SWOT Analysis
- 11.2.11.4. Recent Developments
- 11.2.11.5. Financials (Based on Availability)
- 11.2.12 Wagner Brake
- 11.2.12.1. Overview
- 11.2.12.2. Products
- 11.2.12.3. SWOT Analysis
- 11.2.12.4. Recent Developments
- 11.2.12.5. Financials (Based on Availability)
- 11.2.13 Chang Yao Limited
- 11.2.13.1. Overview
- 11.2.13.2. Products
- 11.2.13.3. SWOT Analysis
- 11.2.13.4. Recent Developments
- 11.2.13.5. Financials (Based on Availability)
- 11.2.14 PIAA
- 11.2.14.1. Overview
- 11.2.14.2. Products
- 11.2.14.3. SWOT Analysis
- 11.2.14.4. Recent Developments
- 11.2.14.5. Financials (Based on Availability)
- 11.2.15 ZKW Group
- 11.2.15.1. Overview
- 11.2.15.2. Products
- 11.2.15.3. SWOT Analysis
- 11.2.15.4. Recent Developments
- 11.2.15.5. Financials (Based on Availability)
- 11.2.16 SL Corporation
- 11.2.16.1. Overview
- 11.2.16.2. Products
- 11.2.16.3. SWOT Analysis
- 11.2.16.4. Recent Developments
- 11.2.16.5. Financials (Based on Availability)
- 11.2.17 TYC
- 11.2.17.1. Overview
- 11.2.17.2. Products
- 11.2.17.3. SWOT Analysis
- 11.2.17.4. Recent Developments
- 11.2.17.5. Financials (Based on Availability)
- 11.2.18 DEPO
- 11.2.18.1. Overview
- 11.2.18.2. Products
- 11.2.18.3. SWOT Analysis
- 11.2.18.4. Recent Developments
- 11.2.18.5. Financials (Based on Availability)
- 11.2.1 GE Lighting
List of Figures
- Figure 1: Global Automotive Map Light Revenue Breakdown (undefined, %) by Region 2025 & 2033
- Figure 2: Global Automotive Map Light Volume Breakdown (K, %) by Region 2025 & 2033
- Figure 3: North America Automotive Map Light Revenue (undefined), by Application 2025 & 2033
- Figure 4: North America Automotive Map Light Volume (K), by Application 2025 & 2033
- Figure 5: North America Automotive Map Light Revenue Share (%), by Application 2025 & 2033
- Figure 6: North America Automotive Map Light Volume Share (%), by Application 2025 & 2033
- Figure 7: North America Automotive Map Light Revenue (undefined), by Type 2025 & 2033
- Figure 8: North America Automotive Map Light Volume (K), by Type 2025 & 2033
- Figure 9: North America Automotive Map Light Revenue Share (%), by Type 2025 & 2033
- Figure 10: North America Automotive Map Light Volume Share (%), by Type 2025 & 2033
- Figure 11: North America Automotive Map Light Revenue (undefined), by Country 2025 & 2033
- Figure 12: North America Automotive Map Light Volume (K), by Country 2025 & 2033
- Figure 13: North America Automotive Map Light Revenue Share (%), by Country 2025 & 2033
- Figure 14: North America Automotive Map Light Volume Share (%), by Country 2025 & 2033
- Figure 15: South America Automotive Map Light Revenue (undefined), by Application 2025 & 2033
- Figure 16: South America Automotive Map Light Volume (K), by Application 2025 & 2033
- Figure 17: South America Automotive Map Light Revenue Share (%), by Application 2025 & 2033
- Figure 18: South America Automotive Map Light Volume Share (%), by Application 2025 & 2033
- Figure 19: South America Automotive Map Light Revenue (undefined), by Type 2025 & 2033
- Figure 20: South America Automotive Map Light Volume (K), by Type 2025 & 2033
- Figure 21: South America Automotive Map Light Revenue Share (%), by Type 2025 & 2033
- Figure 22: South America Automotive Map Light Volume Share (%), by Type 2025 & 2033
- Figure 23: South America Automotive Map Light Revenue (undefined), by Country 2025 & 2033
- Figure 24: South America Automotive Map Light Volume (K), by Country 2025 & 2033
- Figure 25: South America Automotive Map Light Revenue Share (%), by Country 2025 & 2033
- Figure 26: South America Automotive Map Light Volume Share (%), by Country 2025 & 2033
- Figure 27: Europe Automotive Map Light Revenue (undefined), by Application 2025 & 2033
- Figure 28: Europe Automotive Map Light Volume (K), by Application 2025 & 2033
- Figure 29: Europe Automotive Map Light Revenue Share (%), by Application 2025 & 2033
- Figure 30: Europe Automotive Map Light Volume Share (%), by Application 2025 & 2033
- Figure 31: Europe Automotive Map Light Revenue (undefined), by Type 2025 & 2033
- Figure 32: Europe Automotive Map Light Volume (K), by Type 2025 & 2033
- Figure 33: Europe Automotive Map Light Revenue Share (%), by Type 2025 & 2033
- Figure 34: Europe Automotive Map Light Volume Share (%), by Type 2025 & 2033
- Figure 35: Europe Automotive Map Light Revenue (undefined), by Country 2025 & 2033
- Figure 36: Europe Automotive Map Light Volume (K), by Country 2025 & 2033
- Figure 37: Europe Automotive Map Light Revenue Share (%), by Country 2025 & 2033
- Figure 38: Europe Automotive Map Light Volume Share (%), by Country 2025 & 2033
- Figure 39: Middle East & Africa Automotive Map Light Revenue (undefined), by Application 2025 & 2033
- Figure 40: Middle East & Africa Automotive Map Light Volume (K), by Application 2025 & 2033
- Figure 41: Middle East & Africa Automotive Map Light Revenue Share (%), by Application 2025 & 2033
- Figure 42: Middle East & Africa Automotive Map Light Volume Share (%), by Application 2025 & 2033
- Figure 43: Middle East & Africa Automotive Map Light Revenue (undefined), by Type 2025 & 2033
- Figure 44: Middle East & Africa Automotive Map Light Volume (K), by Type 2025 & 2033
- Figure 45: Middle East & Africa Automotive Map Light Revenue Share (%), by Type 2025 & 2033
- Figure 46: Middle East & Africa Automotive Map Light Volume Share (%), by Type 2025 & 2033
- Figure 47: Middle East & Africa Automotive Map Light Revenue (undefined), by Country 2025 & 2033
- Figure 48: Middle East & Africa Automotive Map Light Volume (K), by Country 2025 & 2033
- Figure 49: Middle East & Africa Automotive Map Light Revenue Share (%), by Country 2025 & 2033
- Figure 50: Middle East & Africa Automotive Map Light Volume Share (%), by Country 2025 & 2033
- Figure 51: Asia Pacific Automotive Map Light Revenue (undefined), by Application 2025 & 2033
- Figure 52: Asia Pacific Automotive Map Light Volume (K), by Application 2025 & 2033
- Figure 53: Asia Pacific Automotive Map Light Revenue Share (%), by Application 2025 & 2033
- Figure 54: Asia Pacific Automotive Map Light Volume Share (%), by Application 2025 & 2033
- Figure 55: Asia Pacific Automotive Map Light Revenue (undefined), by Type 2025 & 2033
- Figure 56: Asia Pacific Automotive Map Light Volume (K), by Type 2025 & 2033
- Figure 57: Asia Pacific Automotive Map Light Revenue Share (%), by Type 2025 & 2033
- Figure 58: Asia Pacific Automotive Map Light Volume Share (%), by Type 2025 & 2033
- Figure 59: Asia Pacific Automotive Map Light Revenue (undefined), by Country 2025 & 2033
- Figure 60: Asia Pacific Automotive Map Light Volume (K), by Country 2025 & 2033
- Figure 61: Asia Pacific Automotive Map Light Revenue Share (%), by Country 2025 & 2033
- Figure 62: Asia Pacific Automotive Map Light Volume Share (%), by Country 2025 & 2033
List of Tables
- Table 1: Global Automotive Map Light Revenue undefined Forecast, by Application 2020 & 2033
- Table 2: Global Automotive Map Light Volume K Forecast, by Application 2020 & 2033
- Table 3: Global Automotive Map Light Revenue undefined Forecast, by Type 2020 & 2033
- Table 4: Global Automotive Map Light Volume K Forecast, by Type 2020 & 2033
- Table 5: Global Automotive Map Light Revenue undefined Forecast, by Region 2020 & 2033
- Table 6: Global Automotive Map Light Volume K Forecast, by Region 2020 & 2033
- Table 7: Global Automotive Map Light Revenue undefined Forecast, by Application 2020 & 2033
- Table 8: Global Automotive Map Light Volume K Forecast, by Application 2020 & 2033
- Table 9: Global Automotive Map Light Revenue undefined Forecast, by Type 2020 & 2033
- Table 10: Global Automotive Map Light Volume K Forecast, by Type 2020 & 2033
- Table 11: Global Automotive Map Light Revenue undefined Forecast, by Country 2020 & 2033
- Table 12: Global Automotive Map Light Volume K Forecast, by Country 2020 & 2033
- Table 13: United States Automotive Map Light Revenue (undefined) Forecast, by Application 2020 & 2033
- Table 14: United States Automotive Map Light Volume (K) Forecast, by Application 2020 & 2033
- Table 15: Canada Automotive Map Light Revenue (undefined) Forecast, by Application 2020 & 2033
- Table 16: Canada Automotive Map Light Volume (K) Forecast, by Application 2020 & 2033
- Table 17: Mexico Automotive Map Light Revenue (undefined) Forecast, by Application 2020 & 2033
- Table 18: Mexico Automotive Map Light Volume (K) Forecast, by Application 2020 & 2033
- Table 19: Global Automotive Map Light Revenue undefined Forecast, by Application 2020 & 2033
- Table 20: Global Automotive Map Light Volume K Forecast, by Application 2020 & 2033
- Table 21: Global Automotive Map Light Revenue undefined Forecast, by Type 2020 & 2033
- Table 22: Global Automotive Map Light Volume K Forecast, by Type 2020 & 2033
- Table 23: Global Automotive Map Light Revenue undefined Forecast, by Country 2020 & 2033
- Table 24: Global Automotive Map Light Volume K Forecast, by Country 2020 & 2033
- Table 25: Brazil Automotive Map Light Revenue (undefined) Forecast, by Application 2020 & 2033
- Table 26: Brazil Automotive Map Light Volume (K) Forecast, by Application 2020 & 2033
- Table 27: Argentina Automotive Map Light Revenue (undefined) Forecast, by Application 2020 & 2033
- Table 28: Argentina Automotive Map Light Volume (K) Forecast, by Application 2020 & 2033
- Table 29: Rest of South America Automotive Map Light Revenue (undefined) Forecast, by Application 2020 & 2033
- Table 30: Rest of South America Automotive Map Light Volume (K) Forecast, by Application 2020 & 2033
- Table 31: Global Automotive Map Light Revenue undefined Forecast, by Application 2020 & 2033
- Table 32: Global Automotive Map Light Volume K Forecast, by Application 2020 & 2033
- Table 33: Global Automotive Map Light Revenue undefined Forecast, by Type 2020 & 2033
- Table 34: Global Automotive Map Light Volume K Forecast, by Type 2020 & 2033
- Table 35: Global Automotive Map Light Revenue undefined Forecast, by Country 2020 & 2033
- Table 36: Global Automotive Map Light Volume K Forecast, by Country 2020 & 2033
- Table 37: United Kingdom Automotive Map Light Revenue (undefined) Forecast, by Application 2020 & 2033
- Table 38: United Kingdom Automotive Map Light Volume (K) Forecast, by Application 2020 & 2033
- Table 39: Germany Automotive Map Light Revenue (undefined) Forecast, by Application 2020 & 2033
- Table 40: Germany Automotive Map Light Volume (K) Forecast, by Application 2020 & 2033
- Table 41: France Automotive Map Light Revenue (undefined) Forecast, by Application 2020 & 2033
- Table 42: France Automotive Map Light Volume (K) Forecast, by Application 2020 & 2033
- Table 43: Italy Automotive Map Light Revenue (undefined) Forecast, by Application 2020 & 2033
- Table 44: Italy Automotive Map Light Volume (K) Forecast, by Application 2020 & 2033
- Table 45: Spain Automotive Map Light Revenue (undefined) Forecast, by Application 2020 & 2033
- Table 46: Spain Automotive Map Light Volume (K) Forecast, by Application 2020 & 2033
- Table 47: Russia Automotive Map Light Revenue (undefined) Forecast, by Application 2020 & 2033
- Table 48: Russia Automotive Map Light Volume (K) Forecast, by Application 2020 & 2033
- Table 49: Benelux Automotive Map Light Revenue (undefined) Forecast, by Application 2020 & 2033
- Table 50: Benelux Automotive Map Light Volume (K) Forecast, by Application 2020 & 2033
- Table 51: Nordics Automotive Map Light Revenue (undefined) Forecast, by Application 2020 & 2033
- Table 52: Nordics Automotive Map Light Volume (K) Forecast, by Application 2020 & 2033
- Table 53: Rest of Europe Automotive Map Light Revenue (undefined) Forecast, by Application 2020 & 2033
- Table 54: Rest of Europe Automotive Map Light Volume (K) Forecast, by Application 2020 & 2033
- Table 55: Global Automotive Map Light Revenue undefined Forecast, by Application 2020 & 2033
- Table 56: Global Automotive Map Light Volume K Forecast, by Application 2020 & 2033
- Table 57: Global Automotive Map Light Revenue undefined Forecast, by Type 2020 & 2033
- Table 58: Global Automotive Map Light Volume K Forecast, by Type 2020 & 2033
- Table 59: Global Automotive Map Light Revenue undefined Forecast, by Country 2020 & 2033
- Table 60: Global Automotive Map Light Volume K Forecast, by Country 2020 & 2033
- Table 61: Turkey Automotive Map Light Revenue (undefined) Forecast, by Application 2020 & 2033
- Table 62: Turkey Automotive Map Light Volume (K) Forecast, by Application 2020 & 2033
- Table 63: Israel Automotive Map Light Revenue (undefined) Forecast, by Application 2020 & 2033
- Table 64: Israel Automotive Map Light Volume (K) Forecast, by Application 2020 & 2033
- Table 65: GCC Automotive Map Light Revenue (undefined) Forecast, by Application 2020 & 2033
- Table 66: GCC Automotive Map Light Volume (K) Forecast, by Application 2020 & 2033
- Table 67: North Africa Automotive Map Light Revenue (undefined) Forecast, by Application 2020 & 2033
- Table 68: North Africa Automotive Map Light Volume (K) Forecast, by Application 2020 & 2033
- Table 69: South Africa Automotive Map Light Revenue (undefined) Forecast, by Application 2020 & 2033
- Table 70: South Africa Automotive Map Light Volume (K) Forecast, by Application 2020 & 2033
- Table 71: Rest of Middle East & Africa Automotive Map Light Revenue (undefined) Forecast, by Application 2020 & 2033
- Table 72: Rest of Middle East & Africa Automotive Map Light Volume (K) Forecast, by Application 2020 & 2033
- Table 73: Global Automotive Map Light Revenue undefined Forecast, by Application 2020 & 2033
- Table 74: Global Automotive Map Light Volume K Forecast, by Application 2020 & 2033
- Table 75: Global Automotive Map Light Revenue undefined Forecast, by Type 2020 & 2033
- Table 76: Global Automotive Map Light Volume K Forecast, by Type 2020 & 2033
- Table 77: Global Automotive Map Light Revenue undefined Forecast, by Country 2020 & 2033
- Table 78: Global Automotive Map Light Volume K Forecast, by Country 2020 & 2033
- Table 79: China Automotive Map Light Revenue (undefined) Forecast, by Application 2020 & 2033
- Table 80: China Automotive Map Light Volume (K) Forecast, by Application 2020 & 2033
- Table 81: India Automotive Map Light Revenue (undefined) Forecast, by Application 2020 & 2033
- Table 82: India Automotive Map Light Volume (K) Forecast, by Application 2020 & 2033
- Table 83: Japan Automotive Map Light Revenue (undefined) Forecast, by Application 2020 & 2033
- Table 84: Japan Automotive Map Light Volume (K) Forecast, by Application 2020 & 2033
- Table 85: South Korea Automotive Map Light Revenue (undefined) Forecast, by Application 2020 & 2033
- Table 86: South Korea Automotive Map Light Volume (K) Forecast, by Application 2020 & 2033
- Table 87: ASEAN Automotive Map Light Revenue (undefined) Forecast, by Application 2020 & 2033
- Table 88: ASEAN Automotive Map Light Volume (K) Forecast, by Application 2020 & 2033
- Table 89: Oceania Automotive Map Light Revenue (undefined) Forecast, by Application 2020 & 2033
- Table 90: Oceania Automotive Map Light Volume (K) Forecast, by Application 2020 & 2033
- Table 91: Rest of Asia Pacific Automotive Map Light Revenue (undefined) Forecast, by Application 2020 & 2033
- Table 92: Rest of Asia Pacific Automotive Map Light Volume (K) Forecast, by Application 2020 & 2033
Frequently Asked Questions
1. What is the projected Compound Annual Growth Rate (CAGR) of the Automotive Map Light?
The projected CAGR is approximately 6.5%.
2. Which companies are prominent players in the Automotive Map Light?
Key companies in the market include GE Lighting, Osram Sylvania, Bosch, Toshiba Lighting & Technolgy, Grupo Antolin, Tenneco(Federal-Mogul), HASCO VISION, Changzhou Xingyu, Varroc, Philips, Ring Automotive, Wagner Brake, Chang Yao Limited, PIAA, ZKW Group, SL Corporation, TYC, DEPO.
3. What are the main segments of the Automotive Map Light?
The market segments include Application, Type.
4. Can you provide details about the market size?
The market size is estimated to be USD XXX N/A as of 2022.
5. What are some drivers contributing to market growth?
N/A
6. What are the notable trends driving market growth?
N/A
7. Are there any restraints impacting market growth?
N/A
8. Can you provide examples of recent developments in the market?
N/A
9. What pricing options are available for accessing the report?
Pricing options include single-user, multi-user, and enterprise licenses priced at USD 3950.00, USD 5925.00, and USD 7900.00 respectively.
10. Is the market size provided in terms of value or volume?
The market size is provided in terms of value, measured in N/A and volume, measured in K.
11. Are there any specific market keywords associated with the report?
Yes, the market keyword associated with the report is "Automotive Map Light," which aids in identifying and referencing the specific market segment covered.
12. How do I determine which pricing option suits my needs best?
The pricing options vary based on user requirements and access needs. Individual users may opt for single-user licenses, while businesses requiring broader access may choose multi-user or enterprise licenses for cost-effective access to the report.
13. Are there any additional resources or data provided in the Automotive Map Light report?
While the report offers comprehensive insights, it's advisable to review the specific contents or supplementary materials provided to ascertain if additional resources or data are available.
14. How can I stay updated on further developments or reports in the Automotive Map Light?
To stay informed about further developments, trends, and reports in the Automotive Map Light, consider subscribing to industry newsletters, following relevant companies and organizations, or regularly checking reputable industry news sources and publications.
Methodology
Step 1 - Identification of Relevant Samples Size from Population Database


Step 2 - Approaches for Defining Global Market Size (Value, Volume* & Price*)

Note*: In applicable scenarios
Step 3 - Data Sources
Primary Research
- Web Analytics
- Survey Reports
- Research Institute
- Latest Research Reports
- Opinion Leaders
Secondary Research
- Annual Reports
- White Paper
- Latest Press Release
- Industry Association
- Paid Database
- Investor Presentations

Step 4 - Data Triangulation
Involves using different sources of information in order to increase the validity of a study
These sources are likely to be stakeholders in a program - participants, other researchers, program staff, other community members, and so on.
Then we put all data in single framework & apply various statistical tools to find out the dynamic on the market.
During the analysis stage, feedback from the stakeholder groups would be compared to determine areas of agreement as well as areas of divergence