

Key Insights
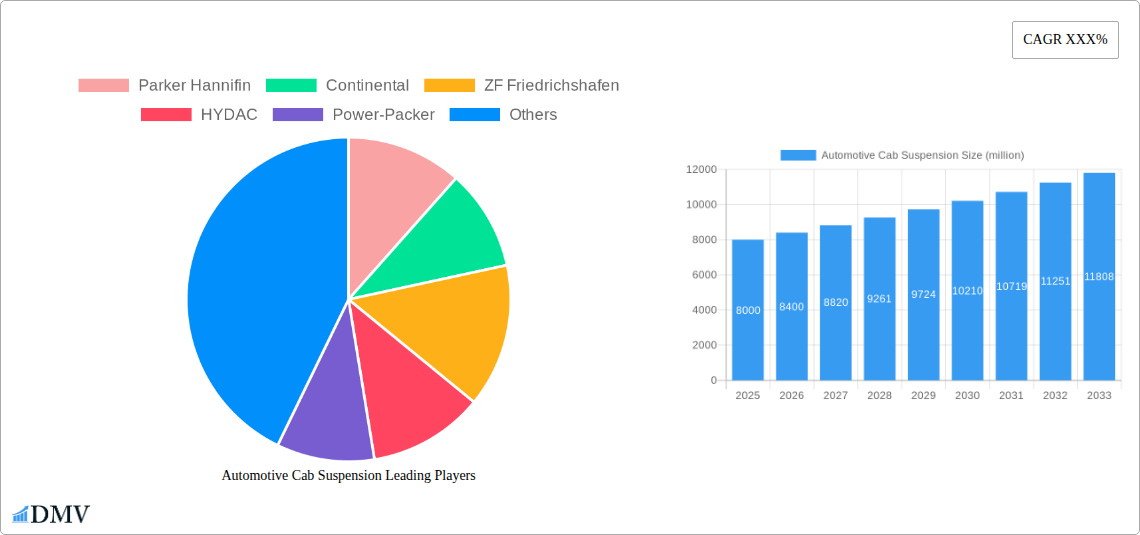
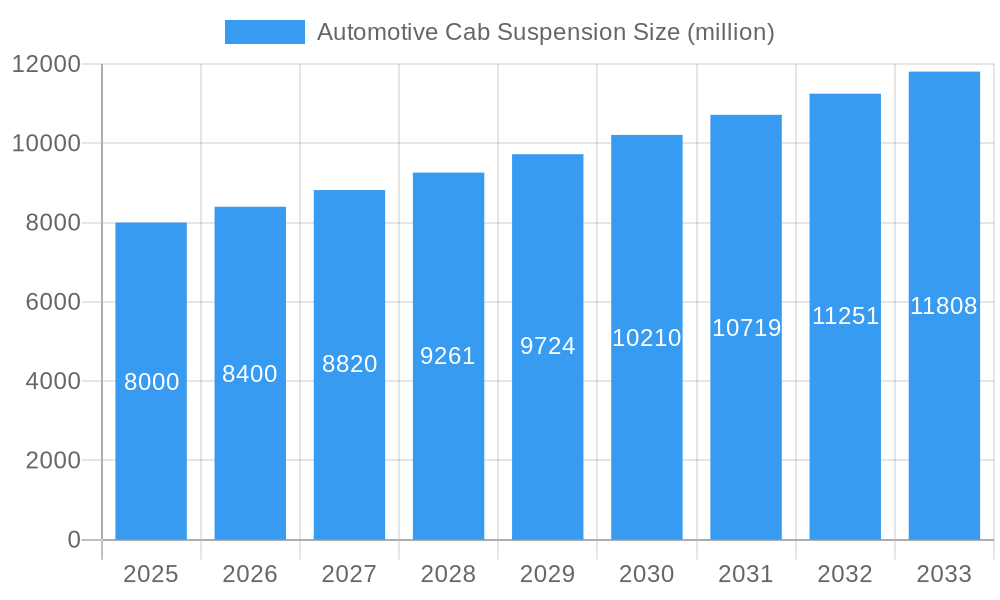
The global automotive cab suspension market is experiencing robust growth, driven by increasing demand for enhanced driver comfort and vehicle safety, particularly in heavy-duty commercial vehicles like trucks and buses. The market's expansion is fueled by several key factors, including advancements in suspension technology, such as air and electronically controlled systems offering superior ride quality and reduced driver fatigue. Stringent government regulations mandating improved driver ergonomics and safety features further contribute to market expansion. The rising adoption of advanced driver-assistance systems (ADAS) and autonomous driving technologies also necessitates more sophisticated cab suspension systems capable of handling the increased computational demands and ensuring stable platform operation. We estimate the market size in 2025 to be around $8 billion, with a compound annual growth rate (CAGR) of approximately 5% projected through 2033. This growth is expected to be driven by increasing vehicle production, particularly in developing economies, and the ongoing trend towards heavier and larger commercial vehicles.
Automotive Cab Suspension Market Size (In Billion)
Key players such as Parker Hannifin, Continental, ZF Friedrichshafen, and HYDAC dominate the market, leveraging their established technological expertise and extensive distribution networks. However, the market is also witnessing the emergence of smaller, innovative companies focusing on niche technologies and specialized applications. The market segmentation reveals a strong focus on air suspension systems, given their superior ride comfort and load-bearing capacity. Regional variations exist, with North America and Europe currently holding significant market shares due to established automotive industries and stricter safety regulations. However, Asia-Pacific is expected to witness substantial growth in the coming years, driven by burgeoning economies and increasing investments in infrastructure development, leading to a greater demand for heavy-duty commercial vehicles. Future market trends include a greater focus on lightweighting materials, the integration of smart suspension systems with connected vehicle technologies, and the development of sustainable and cost-effective solutions.
Automotive Cab Suspension Company Market Share
Automotive Cab Suspension Market Report: A Comprehensive Analysis (2019-2033)
This insightful report provides a comprehensive analysis of the global automotive cab suspension market, projecting a market value exceeding $XX million by 2033. It delves deep into market dynamics, competitive landscapes, technological advancements, and future growth prospects, offering invaluable insights for stakeholders across the automotive industry. The report covers the period from 2019 to 2033, with a base year of 2025 and a forecast period of 2025-2033. Key players like Parker Hannifin, Continental, ZF Friedrichshafen, and others are meticulously analyzed to understand their market positioning and strategic initiatives.
Automotive Cab Suspension Market Composition & Trends
This section analyzes the market's competitive intensity, innovation drivers, regulatory influences, substitute product threats, end-user preferences, and merger & acquisition (M&A) activities. The global automotive cab suspension market showcases a moderately concentrated landscape, with the top five players holding an estimated 40% market share in 2025. Innovation is driven by the demand for enhanced ride comfort, safety, and fuel efficiency. Stringent safety regulations, particularly concerning driver fatigue and vehicle stability, significantly influence market growth. Alternative suspension technologies, such as air suspensions, pose a competitive threat, while the increasing adoption of autonomous vehicles presents both challenges and opportunities. The historical period (2019-2024) witnessed several M&A activities valued at over $XX million, primarily driven by the pursuit of technological synergies and expansion into new markets.
- Market Share Distribution (2025): Top 5 players - 40%; Others - 60%
- M&A Deal Value (2019-2024): $XX million
- Key Innovation Catalysts: Enhanced ride comfort, improved safety, fuel efficiency advancements.
- Regulatory Landscape: Stringent safety standards impacting design and performance.
- Substitute Products: Air suspensions, active suspension systems.
- End-User Profiles: Primarily commercial vehicle manufacturers and automotive OEMs.
Automotive Cab Suspension Industry Evolution
The automotive cab suspension market experienced a Compound Annual Growth Rate (CAGR) of XX% during the historical period (2019-2024), driven by factors such as increasing demand for heavy-duty vehicles, rising disposable incomes in emerging economies, and the growing adoption of advanced driver-assistance systems (ADAS). Technological advancements, including the integration of smart sensors and electronically controlled suspension systems, are transforming the industry. The shift towards lightweight materials and improved durability is another significant trend. Consumer demand is increasingly focused on enhanced ride comfort and reduced vehicle vibrations, particularly in the long-haul trucking and construction sectors. The market is expected to maintain a robust CAGR of XX% during the forecast period (2025-2033), fueled by ongoing technological progress and expanding application areas.
- Historical CAGR (2019-2024): XX%
- Projected CAGR (2025-2033): XX%
- Key Technological Advancements: Smart sensors, electronic control systems, lightweight materials.
- Shifting Consumer Demands: Enhanced ride comfort, reduced vibrations, improved durability.
Leading Regions, Countries, or Segments in Automotive Cab Suspension
North America currently dominates the global automotive cab suspension market, driven by strong demand from the commercial vehicle sector and robust investments in infrastructure development. Europe holds a significant share, with stringent regulations and increasing focus on fuel efficiency driving growth. The Asia-Pacific region is emerging as a significant market, spurred by rapid industrialization and substantial investments in the automotive sector.
- Key Drivers for North American Dominance: High demand for commercial vehicles, significant infrastructure investment, robust regulatory framework.
- Key Drivers for European Market: Stricter emission norms, focus on fuel efficiency, technological advancements.
- Key Drivers for Asia-Pacific Growth: Rapid industrialization, increasing vehicle production, government initiatives promoting vehicle electrification.
Automotive Cab Suspension Product Innovations
Recent innovations include the development of intelligent suspension systems capable of adapting to various road conditions and load capacities. These systems utilize advanced sensors and control algorithms to optimize ride comfort and handling. The adoption of lighter weight, high-strength materials, such as composites and advanced alloys, enhances fuel efficiency and vehicle performance. These advancements offer unique selling propositions, focusing on increased comfort, enhanced safety, improved durability, and reduced maintenance costs.
Propelling Factors for Automotive Cab Suspension Growth
Technological advancements, including the integration of smart sensors and electronically controlled systems, are a primary driver. The growing demand for heavy-duty vehicles in construction, logistics, and mining industries further fuels market growth. Moreover, government regulations concerning vehicle safety and emission standards are creating a favorable environment for the adoption of advanced cab suspension systems.
Obstacles in the Automotive Cab Suspension Market
High manufacturing costs, especially for advanced systems, can present a challenge. Supply chain disruptions, especially related to the availability of raw materials and electronic components, can significantly impact production and delivery timelines. Intense competition amongst established players and emerging market entrants creates pricing pressures, reducing profitability.
Future Opportunities in Automotive Cab Suspension
The integration of active suspension systems into autonomous vehicles presents a significant opportunity. The development of sustainable and eco-friendly materials offers potential for cost reduction and environmental benefits. Expansion into emerging markets with growing infrastructure and vehicle production presents considerable potential for growth.
Major Players in the Automotive Cab Suspension Ecosystem
- Parker Hannifin
- Continental
- ZF Friedrichshafen
- HYDAC
- Power-Packer
- Link Manufacturing
- Lord Corp
- Samo Maschinenbau GmbH
- Monroe
- Bison Parts
Key Developments in Automotive Cab Suspension Industry
- 2022 Q3: ZF Friedrichshafen launched a new generation of electronically controlled air suspension system.
- 2023 Q1: Parker Hannifin acquired a smaller competitor specializing in high-performance dampers.
- 2024 Q4: Continental announced a strategic partnership to develop lightweight suspension components.
Strategic Automotive Cab Suspension Market Forecast
The automotive cab suspension market is poised for substantial growth, driven by technological innovation, increasing demand for commercial vehicles, and stringent regulatory requirements. Emerging opportunities in autonomous driving and sustainable materials will further propel market expansion. The continued focus on enhancing ride comfort, safety, and fuel efficiency will shape the future of the industry.
Automotive Cab Suspension Segmentation
-
1. Application
- 1.1. Passenger Car
- 1.2. Commercial Vehicle
-
2. Type
- 2.1. Hydro-Pneumatic
- 2.2. Steel Spring Modules
- 2.3. Air Spring Module
Automotive Cab Suspension Segmentation By Geography
-
1. North America
- 1.1. United States
- 1.2. Canada
- 1.3. Mexico
-
2. South America
- 2.1. Brazil
- 2.2. Argentina
- 2.3. Rest of South America
-
3. Europe
- 3.1. United Kingdom
- 3.2. Germany
- 3.3. France
- 3.4. Italy
- 3.5. Spain
- 3.6. Russia
- 3.7. Benelux
- 3.8. Nordics
- 3.9. Rest of Europe
-
4. Middle East & Africa
- 4.1. Turkey
- 4.2. Israel
- 4.3. GCC
- 4.4. North Africa
- 4.5. South Africa
- 4.6. Rest of Middle East & Africa
-
5. Asia Pacific
- 5.1. China
- 5.2. India
- 5.3. Japan
- 5.4. South Korea
- 5.5. ASEAN
- 5.6. Oceania
- 5.7. Rest of Asia Pacific

Automotive Cab Suspension Regional Market Share
Geographic Coverage of Automotive Cab Suspension
Automotive Cab Suspension REPORT HIGHLIGHTS
| Aspects | Details |
|---|---|
| Study Period | 2020-2034 |
| Base Year | 2025 |
| Estimated Year | 2026 |
| Forecast Period | 2026-2034 |
| Historical Period | 2020-2025 |
| Growth Rate | CAGR of 0.9% from 2020-2034 |
| Segmentation |
|
Table of Contents
- 1. Introduction
- 1.1. Research Scope
- 1.2. Market Segmentation
- 1.3. Research Methodology
- 1.4. Definitions and Assumptions
- 2. Executive Summary
- 2.1. Introduction
- 3. Market Dynamics
- 3.1. Introduction
- 3.2. Market Drivers
- 3.3. Market Restrains
- 3.4. Market Trends
- 4. Market Factor Analysis
- 4.1. Porters Five Forces
- 4.2. Supply/Value Chain
- 4.3. PESTEL analysis
- 4.4. Market Entropy
- 4.5. Patent/Trademark Analysis
- 5. Global Automotive Cab Suspension Analysis, Insights and Forecast, 2020-2032
- 5.1. Market Analysis, Insights and Forecast - by Application
- 5.1.1. Passenger Car
- 5.1.2. Commercial Vehicle
- 5.2. Market Analysis, Insights and Forecast - by Type
- 5.2.1. Hydro-Pneumatic
- 5.2.2. Steel Spring Modules
- 5.2.3. Air Spring Module
- 5.3. Market Analysis, Insights and Forecast - by Region
- 5.3.1. North America
- 5.3.2. South America
- 5.3.3. Europe
- 5.3.4. Middle East & Africa
- 5.3.5. Asia Pacific
- 5.1. Market Analysis, Insights and Forecast - by Application
- 6. North America Automotive Cab Suspension Analysis, Insights and Forecast, 2020-2032
- 6.1. Market Analysis, Insights and Forecast - by Application
- 6.1.1. Passenger Car
- 6.1.2. Commercial Vehicle
- 6.2. Market Analysis, Insights and Forecast - by Type
- 6.2.1. Hydro-Pneumatic
- 6.2.2. Steel Spring Modules
- 6.2.3. Air Spring Module
- 6.1. Market Analysis, Insights and Forecast - by Application
- 7. South America Automotive Cab Suspension Analysis, Insights and Forecast, 2020-2032
- 7.1. Market Analysis, Insights and Forecast - by Application
- 7.1.1. Passenger Car
- 7.1.2. Commercial Vehicle
- 7.2. Market Analysis, Insights and Forecast - by Type
- 7.2.1. Hydro-Pneumatic
- 7.2.2. Steel Spring Modules
- 7.2.3. Air Spring Module
- 7.1. Market Analysis, Insights and Forecast - by Application
- 8. Europe Automotive Cab Suspension Analysis, Insights and Forecast, 2020-2032
- 8.1. Market Analysis, Insights and Forecast - by Application
- 8.1.1. Passenger Car
- 8.1.2. Commercial Vehicle
- 8.2. Market Analysis, Insights and Forecast - by Type
- 8.2.1. Hydro-Pneumatic
- 8.2.2. Steel Spring Modules
- 8.2.3. Air Spring Module
- 8.1. Market Analysis, Insights and Forecast - by Application
- 9. Middle East & Africa Automotive Cab Suspension Analysis, Insights and Forecast, 2020-2032
- 9.1. Market Analysis, Insights and Forecast - by Application
- 9.1.1. Passenger Car
- 9.1.2. Commercial Vehicle
- 9.2. Market Analysis, Insights and Forecast - by Type
- 9.2.1. Hydro-Pneumatic
- 9.2.2. Steel Spring Modules
- 9.2.3. Air Spring Module
- 9.1. Market Analysis, Insights and Forecast - by Application
- 10. Asia Pacific Automotive Cab Suspension Analysis, Insights and Forecast, 2020-2032
- 10.1. Market Analysis, Insights and Forecast - by Application
- 10.1.1. Passenger Car
- 10.1.2. Commercial Vehicle
- 10.2. Market Analysis, Insights and Forecast - by Type
- 10.2.1. Hydro-Pneumatic
- 10.2.2. Steel Spring Modules
- 10.2.3. Air Spring Module
- 10.1. Market Analysis, Insights and Forecast - by Application
- 11. Competitive Analysis
- 11.1. Global Market Share Analysis 2025
- 11.2. Company Profiles
- 11.2.1 Parker Hannifin
- 11.2.1.1. Overview
- 11.2.1.2. Products
- 11.2.1.3. SWOT Analysis
- 11.2.1.4. Recent Developments
- 11.2.1.5. Financials (Based on Availability)
- 11.2.2 Continental
- 11.2.2.1. Overview
- 11.2.2.2. Products
- 11.2.2.3. SWOT Analysis
- 11.2.2.4. Recent Developments
- 11.2.2.5. Financials (Based on Availability)
- 11.2.3 ZF Friedrichshafen
- 11.2.3.1. Overview
- 11.2.3.2. Products
- 11.2.3.3. SWOT Analysis
- 11.2.3.4. Recent Developments
- 11.2.3.5. Financials (Based on Availability)
- 11.2.4 HYDAC
- 11.2.4.1. Overview
- 11.2.4.2. Products
- 11.2.4.3. SWOT Analysis
- 11.2.4.4. Recent Developments
- 11.2.4.5. Financials (Based on Availability)
- 11.2.5 Power-Packer
- 11.2.5.1. Overview
- 11.2.5.2. Products
- 11.2.5.3. SWOT Analysis
- 11.2.5.4. Recent Developments
- 11.2.5.5. Financials (Based on Availability)
- 11.2.6 Link Manufacturing
- 11.2.6.1. Overview
- 11.2.6.2. Products
- 11.2.6.3. SWOT Analysis
- 11.2.6.4. Recent Developments
- 11.2.6.5. Financials (Based on Availability)
- 11.2.7 Lord Corp
- 11.2.7.1. Overview
- 11.2.7.2. Products
- 11.2.7.3. SWOT Analysis
- 11.2.7.4. Recent Developments
- 11.2.7.5. Financials (Based on Availability)
- 11.2.8 Samo Maschinenbau GmbH
- 11.2.8.1. Overview
- 11.2.8.2. Products
- 11.2.8.3. SWOT Analysis
- 11.2.8.4. Recent Developments
- 11.2.8.5. Financials (Based on Availability)
- 11.2.9 Monroe
- 11.2.9.1. Overview
- 11.2.9.2. Products
- 11.2.9.3. SWOT Analysis
- 11.2.9.4. Recent Developments
- 11.2.9.5. Financials (Based on Availability)
- 11.2.10 Bison Parts
- 11.2.10.1. Overview
- 11.2.10.2. Products
- 11.2.10.3. SWOT Analysis
- 11.2.10.4. Recent Developments
- 11.2.10.5. Financials (Based on Availability)
- 11.2.1 Parker Hannifin
List of Figures
- Figure 1: Global Automotive Cab Suspension Revenue Breakdown (undefined, %) by Region 2025 & 2033
- Figure 2: North America Automotive Cab Suspension Revenue (undefined), by Application 2025 & 2033
- Figure 3: North America Automotive Cab Suspension Revenue Share (%), by Application 2025 & 2033
- Figure 4: North America Automotive Cab Suspension Revenue (undefined), by Type 2025 & 2033
- Figure 5: North America Automotive Cab Suspension Revenue Share (%), by Type 2025 & 2033
- Figure 6: North America Automotive Cab Suspension Revenue (undefined), by Country 2025 & 2033
- Figure 7: North America Automotive Cab Suspension Revenue Share (%), by Country 2025 & 2033
- Figure 8: South America Automotive Cab Suspension Revenue (undefined), by Application 2025 & 2033
- Figure 9: South America Automotive Cab Suspension Revenue Share (%), by Application 2025 & 2033
- Figure 10: South America Automotive Cab Suspension Revenue (undefined), by Type 2025 & 2033
- Figure 11: South America Automotive Cab Suspension Revenue Share (%), by Type 2025 & 2033
- Figure 12: South America Automotive Cab Suspension Revenue (undefined), by Country 2025 & 2033
- Figure 13: South America Automotive Cab Suspension Revenue Share (%), by Country 2025 & 2033
- Figure 14: Europe Automotive Cab Suspension Revenue (undefined), by Application 2025 & 2033
- Figure 15: Europe Automotive Cab Suspension Revenue Share (%), by Application 2025 & 2033
- Figure 16: Europe Automotive Cab Suspension Revenue (undefined), by Type 2025 & 2033
- Figure 17: Europe Automotive Cab Suspension Revenue Share (%), by Type 2025 & 2033
- Figure 18: Europe Automotive Cab Suspension Revenue (undefined), by Country 2025 & 2033
- Figure 19: Europe Automotive Cab Suspension Revenue Share (%), by Country 2025 & 2033
- Figure 20: Middle East & Africa Automotive Cab Suspension Revenue (undefined), by Application 2025 & 2033
- Figure 21: Middle East & Africa Automotive Cab Suspension Revenue Share (%), by Application 2025 & 2033
- Figure 22: Middle East & Africa Automotive Cab Suspension Revenue (undefined), by Type 2025 & 2033
- Figure 23: Middle East & Africa Automotive Cab Suspension Revenue Share (%), by Type 2025 & 2033
- Figure 24: Middle East & Africa Automotive Cab Suspension Revenue (undefined), by Country 2025 & 2033
- Figure 25: Middle East & Africa Automotive Cab Suspension Revenue Share (%), by Country 2025 & 2033
- Figure 26: Asia Pacific Automotive Cab Suspension Revenue (undefined), by Application 2025 & 2033
- Figure 27: Asia Pacific Automotive Cab Suspension Revenue Share (%), by Application 2025 & 2033
- Figure 28: Asia Pacific Automotive Cab Suspension Revenue (undefined), by Type 2025 & 2033
- Figure 29: Asia Pacific Automotive Cab Suspension Revenue Share (%), by Type 2025 & 2033
- Figure 30: Asia Pacific Automotive Cab Suspension Revenue (undefined), by Country 2025 & 2033
- Figure 31: Asia Pacific Automotive Cab Suspension Revenue Share (%), by Country 2025 & 2033
List of Tables
- Table 1: Global Automotive Cab Suspension Revenue undefined Forecast, by Application 2020 & 2033
- Table 2: Global Automotive Cab Suspension Revenue undefined Forecast, by Type 2020 & 2033
- Table 3: Global Automotive Cab Suspension Revenue undefined Forecast, by Region 2020 & 2033
- Table 4: Global Automotive Cab Suspension Revenue undefined Forecast, by Application 2020 & 2033
- Table 5: Global Automotive Cab Suspension Revenue undefined Forecast, by Type 2020 & 2033
- Table 6: Global Automotive Cab Suspension Revenue undefined Forecast, by Country 2020 & 2033
- Table 7: United States Automotive Cab Suspension Revenue (undefined) Forecast, by Application 2020 & 2033
- Table 8: Canada Automotive Cab Suspension Revenue (undefined) Forecast, by Application 2020 & 2033
- Table 9: Mexico Automotive Cab Suspension Revenue (undefined) Forecast, by Application 2020 & 2033
- Table 10: Global Automotive Cab Suspension Revenue undefined Forecast, by Application 2020 & 2033
- Table 11: Global Automotive Cab Suspension Revenue undefined Forecast, by Type 2020 & 2033
- Table 12: Global Automotive Cab Suspension Revenue undefined Forecast, by Country 2020 & 2033
- Table 13: Brazil Automotive Cab Suspension Revenue (undefined) Forecast, by Application 2020 & 2033
- Table 14: Argentina Automotive Cab Suspension Revenue (undefined) Forecast, by Application 2020 & 2033
- Table 15: Rest of South America Automotive Cab Suspension Revenue (undefined) Forecast, by Application 2020 & 2033
- Table 16: Global Automotive Cab Suspension Revenue undefined Forecast, by Application 2020 & 2033
- Table 17: Global Automotive Cab Suspension Revenue undefined Forecast, by Type 2020 & 2033
- Table 18: Global Automotive Cab Suspension Revenue undefined Forecast, by Country 2020 & 2033
- Table 19: United Kingdom Automotive Cab Suspension Revenue (undefined) Forecast, by Application 2020 & 2033
- Table 20: Germany Automotive Cab Suspension Revenue (undefined) Forecast, by Application 2020 & 2033
- Table 21: France Automotive Cab Suspension Revenue (undefined) Forecast, by Application 2020 & 2033
- Table 22: Italy Automotive Cab Suspension Revenue (undefined) Forecast, by Application 2020 & 2033
- Table 23: Spain Automotive Cab Suspension Revenue (undefined) Forecast, by Application 2020 & 2033
- Table 24: Russia Automotive Cab Suspension Revenue (undefined) Forecast, by Application 2020 & 2033
- Table 25: Benelux Automotive Cab Suspension Revenue (undefined) Forecast, by Application 2020 & 2033
- Table 26: Nordics Automotive Cab Suspension Revenue (undefined) Forecast, by Application 2020 & 2033
- Table 27: Rest of Europe Automotive Cab Suspension Revenue (undefined) Forecast, by Application 2020 & 2033
- Table 28: Global Automotive Cab Suspension Revenue undefined Forecast, by Application 2020 & 2033
- Table 29: Global Automotive Cab Suspension Revenue undefined Forecast, by Type 2020 & 2033
- Table 30: Global Automotive Cab Suspension Revenue undefined Forecast, by Country 2020 & 2033
- Table 31: Turkey Automotive Cab Suspension Revenue (undefined) Forecast, by Application 2020 & 2033
- Table 32: Israel Automotive Cab Suspension Revenue (undefined) Forecast, by Application 2020 & 2033
- Table 33: GCC Automotive Cab Suspension Revenue (undefined) Forecast, by Application 2020 & 2033
- Table 34: North Africa Automotive Cab Suspension Revenue (undefined) Forecast, by Application 2020 & 2033
- Table 35: South Africa Automotive Cab Suspension Revenue (undefined) Forecast, by Application 2020 & 2033
- Table 36: Rest of Middle East & Africa Automotive Cab Suspension Revenue (undefined) Forecast, by Application 2020 & 2033
- Table 37: Global Automotive Cab Suspension Revenue undefined Forecast, by Application 2020 & 2033
- Table 38: Global Automotive Cab Suspension Revenue undefined Forecast, by Type 2020 & 2033
- Table 39: Global Automotive Cab Suspension Revenue undefined Forecast, by Country 2020 & 2033
- Table 40: China Automotive Cab Suspension Revenue (undefined) Forecast, by Application 2020 & 2033
- Table 41: India Automotive Cab Suspension Revenue (undefined) Forecast, by Application 2020 & 2033
- Table 42: Japan Automotive Cab Suspension Revenue (undefined) Forecast, by Application 2020 & 2033
- Table 43: South Korea Automotive Cab Suspension Revenue (undefined) Forecast, by Application 2020 & 2033
- Table 44: ASEAN Automotive Cab Suspension Revenue (undefined) Forecast, by Application 2020 & 2033
- Table 45: Oceania Automotive Cab Suspension Revenue (undefined) Forecast, by Application 2020 & 2033
- Table 46: Rest of Asia Pacific Automotive Cab Suspension Revenue (undefined) Forecast, by Application 2020 & 2033
Frequently Asked Questions
1. What is the projected Compound Annual Growth Rate (CAGR) of the Automotive Cab Suspension?
The projected CAGR is approximately 0.9%.
2. Which companies are prominent players in the Automotive Cab Suspension?
Key companies in the market include Parker Hannifin, Continental, ZF Friedrichshafen, HYDAC, Power-Packer, Link Manufacturing, Lord Corp, Samo Maschinenbau GmbH, Monroe, Bison Parts.
3. What are the main segments of the Automotive Cab Suspension?
The market segments include Application, Type.
4. Can you provide details about the market size?
The market size is estimated to be USD XXX N/A as of 2022.
5. What are some drivers contributing to market growth?
N/A
6. What are the notable trends driving market growth?
N/A
7. Are there any restraints impacting market growth?
N/A
8. Can you provide examples of recent developments in the market?
N/A
9. What pricing options are available for accessing the report?
Pricing options include single-user, multi-user, and enterprise licenses priced at USD 2900.00, USD 4350.00, and USD 5800.00 respectively.
10. Is the market size provided in terms of value or volume?
The market size is provided in terms of value, measured in N/A.
11. Are there any specific market keywords associated with the report?
Yes, the market keyword associated with the report is "Automotive Cab Suspension," which aids in identifying and referencing the specific market segment covered.
12. How do I determine which pricing option suits my needs best?
The pricing options vary based on user requirements and access needs. Individual users may opt for single-user licenses, while businesses requiring broader access may choose multi-user or enterprise licenses for cost-effective access to the report.
13. Are there any additional resources or data provided in the Automotive Cab Suspension report?
While the report offers comprehensive insights, it's advisable to review the specific contents or supplementary materials provided to ascertain if additional resources or data are available.
14. How can I stay updated on further developments or reports in the Automotive Cab Suspension?
To stay informed about further developments, trends, and reports in the Automotive Cab Suspension, consider subscribing to industry newsletters, following relevant companies and organizations, or regularly checking reputable industry news sources and publications.
Methodology
Step 1 - Identification of Relevant Samples Size from Population Database


Step 2 - Approaches for Defining Global Market Size (Value, Volume* & Price*)

Note*: In applicable scenarios
Step 3 - Data Sources
Primary Research
- Web Analytics
- Survey Reports
- Research Institute
- Latest Research Reports
- Opinion Leaders
Secondary Research
- Annual Reports
- White Paper
- Latest Press Release
- Industry Association
- Paid Database
- Investor Presentations

Step 4 - Data Triangulation
Involves using different sources of information in order to increase the validity of a study
These sources are likely to be stakeholders in a program - participants, other researchers, program staff, other community members, and so on.
Then we put all data in single framework & apply various statistical tools to find out the dynamic on the market.
During the analysis stage, feedback from the stakeholder groups would be compared to determine areas of agreement as well as areas of divergence