

Key Insights
The global automobile front-end module market is experiencing robust growth, driven by increasing demand for lightweight vehicles, enhanced safety features, and the rising adoption of advanced driver-assistance systems (ADAS). The market is characterized by a high degree of technological innovation, with manufacturers continually striving to improve fuel efficiency, reduce emissions, and enhance aesthetic appeal. The integration of radar, cameras, and other sensors within the front-end module is a key trend, facilitating the development of more sophisticated ADAS functionalities. Furthermore, the shift towards electric vehicles (EVs) presents both challenges and opportunities. While EVs require different design considerations compared to internal combustion engine (ICE) vehicles, the demand for efficient and aesthetically pleasing front-end modules remains high, stimulating innovation in materials and design. Competition in the market is fierce, with established players and emerging companies vying for market share. Pricing pressures and the need for continuous innovation are key challenges for manufacturers. The market is segmented by vehicle type (passenger cars, commercial vehicles), module type (integrated, non-integrated), and region, with North America and Europe currently dominating.

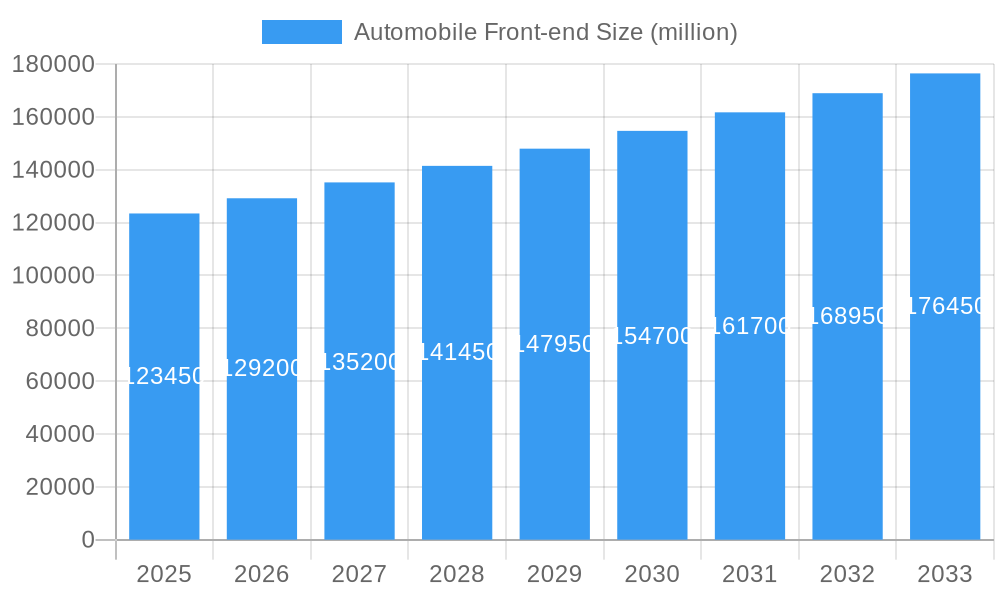
Automobile Front-end Market Size (In Billion)
Looking ahead, the market is poised for sustained growth, fueled by the ongoing development of autonomous driving technologies and the increasing demand for personalized vehicle design. Strategic partnerships and collaborations between automotive manufacturers and component suppliers are becoming increasingly important, enabling the development of more advanced and integrated front-end solutions. The adoption of new materials, such as lightweight composites, is expected to further enhance fuel efficiency and reduce vehicle weight. However, fluctuating raw material prices and geopolitical uncertainties pose potential risks to the market's growth trajectory. Despite these challenges, the long-term outlook for the automobile front-end module market remains positive, driven by the continuous evolution of automotive technology and consumer preferences. We estimate a market size of $100 billion USD in 2025, growing at a compound annual growth rate (CAGR) of approximately 5% for the forecast period 2025-2033.
Automobile Front-end Company Market Share
Automobile Front-end Market: A Comprehensive Report (2019-2033)
This insightful report provides a comprehensive analysis of the global automobile front-end market, projecting a market value exceeding $XX million by 2033. The study covers the period from 2019 to 2033, with a focus on the forecast period of 2025-2033 and a base year of 2025. This report is essential for stakeholders seeking to understand market dynamics, identify growth opportunities, and make informed strategic decisions within this rapidly evolving sector.
Automobile Front-end Market Composition & Trends
This section delves into the competitive landscape of the automobile front-end market, analyzing market concentration, innovation drivers, regulatory influences, substitute products, end-user behavior, and merger & acquisition (M&A) activities. The report meticulously examines the market share distribution among key players, including Magna International Inc., Faurecia SA, Valeo SA, Denso Corporation, Continental AG, Robert Bosch GmbH, BorgWarner Inc., Marelli Holdings Co., Ltd., Johnson Controls International plc, Webasto SE, Benteler Automotive, Mahle GmbH, Plastic Omnium, Hella GmbH & Co. KGaA, and Brose Fahrzeugteile GmbH & Co. KG. We analyze M&A activities, quantifying deal values in millions of dollars and their impact on market consolidation. The analysis includes:
- Market Share Distribution: A detailed breakdown of market share held by each major player in 2024 and projected for 2025 and 2033. (Data will be presented in the full report).
- M&A Activity: Analysis of significant mergers and acquisitions within the industry during the historical period (2019-2024) and projected for the forecast period (2025-2033), including deal values exceeding $XX million. (Specific deals and values detailed in the full report).
- Innovation Catalysts: Examination of key technological advancements driving innovation within the automobile front-end market.
- Regulatory Landscape: Analysis of current and upcoming regulations impacting the industry, including emission standards and safety regulations.
- Substitute Products: Assessment of alternative materials and technologies impacting market demand.
- End-User Profiles: Profiling of key end-users (OEMs and Tier-1 suppliers) and their purchasing patterns.
Automobile Front-end Industry Evolution
This section provides an in-depth analysis of the automobile front-end market's evolution, examining market growth trajectories, technological advancements, and the shifting preferences of consumers. The report uses specific data points such as compound annual growth rates (CAGRs) and adoption metrics to illustrate market trends. The analysis encompasses:
- Market Growth Trajectories: Detailed analysis of historical growth (2019-2024) and projected future growth (2025-2033), highlighting key periods of acceleration and deceleration. (Specific CAGR figures will be included in the full report).
- Technological Advancements: In-depth exploration of technological advancements such as lightweight materials, advanced driver-assistance systems (ADAS), and autonomous driving technologies impacting the design and functionality of automobile front-ends.
- Shifting Consumer Demands: Analysis of how consumer preferences for fuel efficiency, safety, and aesthetics are influencing market trends.
Leading Regions, Countries, or Segments in Automobile Front-end
This section identifies the dominant regions, countries, or segments within the global automobile front-end market. The analysis will highlight the factors contributing to their market leadership:
Key Drivers:
- Investment Trends: Analysis of investment patterns in research & development and manufacturing capacity within the leading regions.
- Regulatory Support: Examination of government policies and incentives supporting the growth of the automobile front-end industry in specific regions.
- Market Size and Growth Rates: Detailed analysis of regional and segment-wise market size and growth during the study period.
Dominance Factors: A detailed analysis providing specific reasons behind the dominance of the leading regions/countries/segments, including factors like manufacturing infrastructure, consumer demand, and government policies. (Detailed analysis provided in the full report).
Automobile Front-end Product Innovations
This section highlights the latest product innovations in the automobile front-end market, focusing on key applications and performance metrics. This section will detail unique selling propositions and cutting-edge technological advancements. (Specific product innovations with details provided in the full report).
Propelling Factors for Automobile Front-end Growth
Several key factors are driving the growth of the automobile front-end market. These include advancements in lightweight materials leading to increased fuel efficiency, stringent government regulations promoting vehicle safety and emissions reduction, and the rising demand for advanced driver-assistance systems (ADAS). The increasing adoption of electric vehicles (EVs) is also a significant driver, as they often require specialized front-end designs.
Obstacles in the Automobile Front-end Market
The automobile front-end market faces several challenges. Stringent emission regulations and safety standards, coupled with fluctuating raw material prices, can impact profitability. Supply chain disruptions and intense competition from established and emerging players further contribute to market volatility. These challenges necessitate effective strategies for cost optimization, technological innovation, and supply chain resilience.
Future Opportunities in Automobile Front-end
The future of the automobile front-end market is bright. Emerging opportunities lie in the growing demand for autonomous vehicles, the increasing adoption of lightweight materials, and the development of advanced sensor technologies. These trends, along with the expansion of electric vehicle (EV) markets, are expected to fuel market growth in the coming years.
Major Players in the Automobile Front-end Ecosystem
- Magna International Inc.
- Faurecia SA
- Valeo SA
- Denso Corporation
- Continental AG
- Robert Bosch GmbH
- BorgWarner Inc.
- Marelli Holdings Co., Ltd.
- Johnson Controls International plc
- Webasto SE
- Benteler Automotive
- Mahle GmbH
- Plastic Omnium
- Hella GmbH & Co. KGaA
- Brose Fahrzeugteile GmbH & Co. KG
Key Developments in Automobile Front-end Industry
- (Specific key developments with dates will be included in the full report).
Strategic Automobile Front-end Market Forecast
The automobile front-end market is poised for substantial growth, driven by technological advancements, stringent regulations, and the increasing adoption of EVs and autonomous vehicles. This presents significant opportunities for market players to innovate, expand their product portfolios, and capitalize on emerging market segments. The report forecasts robust growth exceeding $XX million by 2033, driven by these factors.
Automobile Front-end Segmentation
-
1. Application
- 1.1. Car
- 1.2. SUV
- 1.3. Bus
- 1.4. Others
-
2. Types
- 2.1. Steel
- 2.2. Aluminum Alloy
Automobile Front-end Segmentation By Geography
-
1. North America
- 1.1. United States
- 1.2. Canada
- 1.3. Mexico
-
2. South America
- 2.1. Brazil
- 2.2. Argentina
- 2.3. Rest of South America
-
3. Europe
- 3.1. United Kingdom
- 3.2. Germany
- 3.3. France
- 3.4. Italy
- 3.5. Spain
- 3.6. Russia
- 3.7. Benelux
- 3.8. Nordics
- 3.9. Rest of Europe
-
4. Middle East & Africa
- 4.1. Turkey
- 4.2. Israel
- 4.3. GCC
- 4.4. North Africa
- 4.5. South Africa
- 4.6. Rest of Middle East & Africa
-
5. Asia Pacific
- 5.1. China
- 5.2. India
- 5.3. Japan
- 5.4. South Korea
- 5.5. ASEAN
- 5.6. Oceania
- 5.7. Rest of Asia Pacific

Automobile Front-end Regional Market Share
Geographic Coverage of Automobile Front-end
Automobile Front-end REPORT HIGHLIGHTS
| Aspects | Details |
|---|---|
| Study Period | 2020-2034 |
| Base Year | 2025 |
| Estimated Year | 2026 |
| Forecast Period | 2026-2034 |
| Historical Period | 2020-2025 |
| Growth Rate | CAGR of 4.7% from 2020-2034 |
| Segmentation |
|
Table of Contents
- 1. Introduction
- 1.1. Research Scope
- 1.2. Market Segmentation
- 1.3. Research Methodology
- 1.4. Definitions and Assumptions
- 2. Executive Summary
- 2.1. Introduction
- 3. Market Dynamics
- 3.1. Introduction
- 3.2. Market Drivers
- 3.3. Market Restrains
- 3.4. Market Trends
- 4. Market Factor Analysis
- 4.1. Porters Five Forces
- 4.2. Supply/Value Chain
- 4.3. PESTEL analysis
- 4.4. Market Entropy
- 4.5. Patent/Trademark Analysis
- 5. Global Automobile Front-end Analysis, Insights and Forecast, 2020-2032
- 5.1. Market Analysis, Insights and Forecast - by Application
- 5.1.1. Car
- 5.1.2. SUV
- 5.1.3. Bus
- 5.1.4. Others
- 5.2. Market Analysis, Insights and Forecast - by Types
- 5.2.1. Steel
- 5.2.2. Aluminum Alloy
- 5.3. Market Analysis, Insights and Forecast - by Region
- 5.3.1. North America
- 5.3.2. South America
- 5.3.3. Europe
- 5.3.4. Middle East & Africa
- 5.3.5. Asia Pacific
- 5.1. Market Analysis, Insights and Forecast - by Application
- 6. North America Automobile Front-end Analysis, Insights and Forecast, 2020-2032
- 6.1. Market Analysis, Insights and Forecast - by Application
- 6.1.1. Car
- 6.1.2. SUV
- 6.1.3. Bus
- 6.1.4. Others
- 6.2. Market Analysis, Insights and Forecast - by Types
- 6.2.1. Steel
- 6.2.2. Aluminum Alloy
- 6.1. Market Analysis, Insights and Forecast - by Application
- 7. South America Automobile Front-end Analysis, Insights and Forecast, 2020-2032
- 7.1. Market Analysis, Insights and Forecast - by Application
- 7.1.1. Car
- 7.1.2. SUV
- 7.1.3. Bus
- 7.1.4. Others
- 7.2. Market Analysis, Insights and Forecast - by Types
- 7.2.1. Steel
- 7.2.2. Aluminum Alloy
- 7.1. Market Analysis, Insights and Forecast - by Application
- 8. Europe Automobile Front-end Analysis, Insights and Forecast, 2020-2032
- 8.1. Market Analysis, Insights and Forecast - by Application
- 8.1.1. Car
- 8.1.2. SUV
- 8.1.3. Bus
- 8.1.4. Others
- 8.2. Market Analysis, Insights and Forecast - by Types
- 8.2.1. Steel
- 8.2.2. Aluminum Alloy
- 8.1. Market Analysis, Insights and Forecast - by Application
- 9. Middle East & Africa Automobile Front-end Analysis, Insights and Forecast, 2020-2032
- 9.1. Market Analysis, Insights and Forecast - by Application
- 9.1.1. Car
- 9.1.2. SUV
- 9.1.3. Bus
- 9.1.4. Others
- 9.2. Market Analysis, Insights and Forecast - by Types
- 9.2.1. Steel
- 9.2.2. Aluminum Alloy
- 9.1. Market Analysis, Insights and Forecast - by Application
- 10. Asia Pacific Automobile Front-end Analysis, Insights and Forecast, 2020-2032
- 10.1. Market Analysis, Insights and Forecast - by Application
- 10.1.1. Car
- 10.1.2. SUV
- 10.1.3. Bus
- 10.1.4. Others
- 10.2. Market Analysis, Insights and Forecast - by Types
- 10.2.1. Steel
- 10.2.2. Aluminum Alloy
- 10.1. Market Analysis, Insights and Forecast - by Application
- 11. Competitive Analysis
- 11.1. Global Market Share Analysis 2025
- 11.2. Company Profiles
- 11.2.1 Magna International Inc.
- 11.2.1.1. Overview
- 11.2.1.2. Products
- 11.2.1.3. SWOT Analysis
- 11.2.1.4. Recent Developments
- 11.2.1.5. Financials (Based on Availability)
- 11.2.2 Faurecia SA
- 11.2.2.1. Overview
- 11.2.2.2. Products
- 11.2.2.3. SWOT Analysis
- 11.2.2.4. Recent Developments
- 11.2.2.5. Financials (Based on Availability)
- 11.2.3 Valeo SA
- 11.2.3.1. Overview
- 11.2.3.2. Products
- 11.2.3.3. SWOT Analysis
- 11.2.3.4. Recent Developments
- 11.2.3.5. Financials (Based on Availability)
- 11.2.4 Denso Corporation
- 11.2.4.1. Overview
- 11.2.4.2. Products
- 11.2.4.3. SWOT Analysis
- 11.2.4.4. Recent Developments
- 11.2.4.5. Financials (Based on Availability)
- 11.2.5 Continental AG
- 11.2.5.1. Overview
- 11.2.5.2. Products
- 11.2.5.3. SWOT Analysis
- 11.2.5.4. Recent Developments
- 11.2.5.5. Financials (Based on Availability)
- 11.2.6 Robert Bosch GmbH
- 11.2.6.1. Overview
- 11.2.6.2. Products
- 11.2.6.3. SWOT Analysis
- 11.2.6.4. Recent Developments
- 11.2.6.5. Financials (Based on Availability)
- 11.2.7 BorgWarner Inc.
- 11.2.7.1. Overview
- 11.2.7.2. Products
- 11.2.7.3. SWOT Analysis
- 11.2.7.4. Recent Developments
- 11.2.7.5. Financials (Based on Availability)
- 11.2.8 Marelli Holdings Co.
- 11.2.8.1. Overview
- 11.2.8.2. Products
- 11.2.8.3. SWOT Analysis
- 11.2.8.4. Recent Developments
- 11.2.8.5. Financials (Based on Availability)
- 11.2.9 Ltd.
- 11.2.9.1. Overview
- 11.2.9.2. Products
- 11.2.9.3. SWOT Analysis
- 11.2.9.4. Recent Developments
- 11.2.9.5. Financials (Based on Availability)
- 11.2.10 Johnson Controls International plc
- 11.2.10.1. Overview
- 11.2.10.2. Products
- 11.2.10.3. SWOT Analysis
- 11.2.10.4. Recent Developments
- 11.2.10.5. Financials (Based on Availability)
- 11.2.11 Webasto SE
- 11.2.11.1. Overview
- 11.2.11.2. Products
- 11.2.11.3. SWOT Analysis
- 11.2.11.4. Recent Developments
- 11.2.11.5. Financials (Based on Availability)
- 11.2.12 Benteler Automotive
- 11.2.12.1. Overview
- 11.2.12.2. Products
- 11.2.12.3. SWOT Analysis
- 11.2.12.4. Recent Developments
- 11.2.12.5. Financials (Based on Availability)
- 11.2.13 Mahle GmbH
- 11.2.13.1. Overview
- 11.2.13.2. Products
- 11.2.13.3. SWOT Analysis
- 11.2.13.4. Recent Developments
- 11.2.13.5. Financials (Based on Availability)
- 11.2.14 Plastic Omnium
- 11.2.14.1. Overview
- 11.2.14.2. Products
- 11.2.14.3. SWOT Analysis
- 11.2.14.4. Recent Developments
- 11.2.14.5. Financials (Based on Availability)
- 11.2.15 Hella GmbH & Co. KGaA
- 11.2.15.1. Overview
- 11.2.15.2. Products
- 11.2.15.3. SWOT Analysis
- 11.2.15.4. Recent Developments
- 11.2.15.5. Financials (Based on Availability)
- 11.2.16 Brose Fahrzeugteile GmbH & Co. KG
- 11.2.16.1. Overview
- 11.2.16.2. Products
- 11.2.16.3. SWOT Analysis
- 11.2.16.4. Recent Developments
- 11.2.16.5. Financials (Based on Availability)
- 11.2.1 Magna International Inc.
List of Figures
- Figure 1: Global Automobile Front-end Revenue Breakdown (undefined, %) by Region 2025 & 2033
- Figure 2: Global Automobile Front-end Volume Breakdown (K, %) by Region 2025 & 2033
- Figure 3: North America Automobile Front-end Revenue (undefined), by Application 2025 & 2033
- Figure 4: North America Automobile Front-end Volume (K), by Application 2025 & 2033
- Figure 5: North America Automobile Front-end Revenue Share (%), by Application 2025 & 2033
- Figure 6: North America Automobile Front-end Volume Share (%), by Application 2025 & 2033
- Figure 7: North America Automobile Front-end Revenue (undefined), by Types 2025 & 2033
- Figure 8: North America Automobile Front-end Volume (K), by Types 2025 & 2033
- Figure 9: North America Automobile Front-end Revenue Share (%), by Types 2025 & 2033
- Figure 10: North America Automobile Front-end Volume Share (%), by Types 2025 & 2033
- Figure 11: North America Automobile Front-end Revenue (undefined), by Country 2025 & 2033
- Figure 12: North America Automobile Front-end Volume (K), by Country 2025 & 2033
- Figure 13: North America Automobile Front-end Revenue Share (%), by Country 2025 & 2033
- Figure 14: North America Automobile Front-end Volume Share (%), by Country 2025 & 2033
- Figure 15: South America Automobile Front-end Revenue (undefined), by Application 2025 & 2033
- Figure 16: South America Automobile Front-end Volume (K), by Application 2025 & 2033
- Figure 17: South America Automobile Front-end Revenue Share (%), by Application 2025 & 2033
- Figure 18: South America Automobile Front-end Volume Share (%), by Application 2025 & 2033
- Figure 19: South America Automobile Front-end Revenue (undefined), by Types 2025 & 2033
- Figure 20: South America Automobile Front-end Volume (K), by Types 2025 & 2033
- Figure 21: South America Automobile Front-end Revenue Share (%), by Types 2025 & 2033
- Figure 22: South America Automobile Front-end Volume Share (%), by Types 2025 & 2033
- Figure 23: South America Automobile Front-end Revenue (undefined), by Country 2025 & 2033
- Figure 24: South America Automobile Front-end Volume (K), by Country 2025 & 2033
- Figure 25: South America Automobile Front-end Revenue Share (%), by Country 2025 & 2033
- Figure 26: South America Automobile Front-end Volume Share (%), by Country 2025 & 2033
- Figure 27: Europe Automobile Front-end Revenue (undefined), by Application 2025 & 2033
- Figure 28: Europe Automobile Front-end Volume (K), by Application 2025 & 2033
- Figure 29: Europe Automobile Front-end Revenue Share (%), by Application 2025 & 2033
- Figure 30: Europe Automobile Front-end Volume Share (%), by Application 2025 & 2033
- Figure 31: Europe Automobile Front-end Revenue (undefined), by Types 2025 & 2033
- Figure 32: Europe Automobile Front-end Volume (K), by Types 2025 & 2033
- Figure 33: Europe Automobile Front-end Revenue Share (%), by Types 2025 & 2033
- Figure 34: Europe Automobile Front-end Volume Share (%), by Types 2025 & 2033
- Figure 35: Europe Automobile Front-end Revenue (undefined), by Country 2025 & 2033
- Figure 36: Europe Automobile Front-end Volume (K), by Country 2025 & 2033
- Figure 37: Europe Automobile Front-end Revenue Share (%), by Country 2025 & 2033
- Figure 38: Europe Automobile Front-end Volume Share (%), by Country 2025 & 2033
- Figure 39: Middle East & Africa Automobile Front-end Revenue (undefined), by Application 2025 & 2033
- Figure 40: Middle East & Africa Automobile Front-end Volume (K), by Application 2025 & 2033
- Figure 41: Middle East & Africa Automobile Front-end Revenue Share (%), by Application 2025 & 2033
- Figure 42: Middle East & Africa Automobile Front-end Volume Share (%), by Application 2025 & 2033
- Figure 43: Middle East & Africa Automobile Front-end Revenue (undefined), by Types 2025 & 2033
- Figure 44: Middle East & Africa Automobile Front-end Volume (K), by Types 2025 & 2033
- Figure 45: Middle East & Africa Automobile Front-end Revenue Share (%), by Types 2025 & 2033
- Figure 46: Middle East & Africa Automobile Front-end Volume Share (%), by Types 2025 & 2033
- Figure 47: Middle East & Africa Automobile Front-end Revenue (undefined), by Country 2025 & 2033
- Figure 48: Middle East & Africa Automobile Front-end Volume (K), by Country 2025 & 2033
- Figure 49: Middle East & Africa Automobile Front-end Revenue Share (%), by Country 2025 & 2033
- Figure 50: Middle East & Africa Automobile Front-end Volume Share (%), by Country 2025 & 2033
- Figure 51: Asia Pacific Automobile Front-end Revenue (undefined), by Application 2025 & 2033
- Figure 52: Asia Pacific Automobile Front-end Volume (K), by Application 2025 & 2033
- Figure 53: Asia Pacific Automobile Front-end Revenue Share (%), by Application 2025 & 2033
- Figure 54: Asia Pacific Automobile Front-end Volume Share (%), by Application 2025 & 2033
- Figure 55: Asia Pacific Automobile Front-end Revenue (undefined), by Types 2025 & 2033
- Figure 56: Asia Pacific Automobile Front-end Volume (K), by Types 2025 & 2033
- Figure 57: Asia Pacific Automobile Front-end Revenue Share (%), by Types 2025 & 2033
- Figure 58: Asia Pacific Automobile Front-end Volume Share (%), by Types 2025 & 2033
- Figure 59: Asia Pacific Automobile Front-end Revenue (undefined), by Country 2025 & 2033
- Figure 60: Asia Pacific Automobile Front-end Volume (K), by Country 2025 & 2033
- Figure 61: Asia Pacific Automobile Front-end Revenue Share (%), by Country 2025 & 2033
- Figure 62: Asia Pacific Automobile Front-end Volume Share (%), by Country 2025 & 2033
List of Tables
- Table 1: Global Automobile Front-end Revenue undefined Forecast, by Application 2020 & 2033
- Table 2: Global Automobile Front-end Volume K Forecast, by Application 2020 & 2033
- Table 3: Global Automobile Front-end Revenue undefined Forecast, by Types 2020 & 2033
- Table 4: Global Automobile Front-end Volume K Forecast, by Types 2020 & 2033
- Table 5: Global Automobile Front-end Revenue undefined Forecast, by Region 2020 & 2033
- Table 6: Global Automobile Front-end Volume K Forecast, by Region 2020 & 2033
- Table 7: Global Automobile Front-end Revenue undefined Forecast, by Application 2020 & 2033
- Table 8: Global Automobile Front-end Volume K Forecast, by Application 2020 & 2033
- Table 9: Global Automobile Front-end Revenue undefined Forecast, by Types 2020 & 2033
- Table 10: Global Automobile Front-end Volume K Forecast, by Types 2020 & 2033
- Table 11: Global Automobile Front-end Revenue undefined Forecast, by Country 2020 & 2033
- Table 12: Global Automobile Front-end Volume K Forecast, by Country 2020 & 2033
- Table 13: United States Automobile Front-end Revenue (undefined) Forecast, by Application 2020 & 2033
- Table 14: United States Automobile Front-end Volume (K) Forecast, by Application 2020 & 2033
- Table 15: Canada Automobile Front-end Revenue (undefined) Forecast, by Application 2020 & 2033
- Table 16: Canada Automobile Front-end Volume (K) Forecast, by Application 2020 & 2033
- Table 17: Mexico Automobile Front-end Revenue (undefined) Forecast, by Application 2020 & 2033
- Table 18: Mexico Automobile Front-end Volume (K) Forecast, by Application 2020 & 2033
- Table 19: Global Automobile Front-end Revenue undefined Forecast, by Application 2020 & 2033
- Table 20: Global Automobile Front-end Volume K Forecast, by Application 2020 & 2033
- Table 21: Global Automobile Front-end Revenue undefined Forecast, by Types 2020 & 2033
- Table 22: Global Automobile Front-end Volume K Forecast, by Types 2020 & 2033
- Table 23: Global Automobile Front-end Revenue undefined Forecast, by Country 2020 & 2033
- Table 24: Global Automobile Front-end Volume K Forecast, by Country 2020 & 2033
- Table 25: Brazil Automobile Front-end Revenue (undefined) Forecast, by Application 2020 & 2033
- Table 26: Brazil Automobile Front-end Volume (K) Forecast, by Application 2020 & 2033
- Table 27: Argentina Automobile Front-end Revenue (undefined) Forecast, by Application 2020 & 2033
- Table 28: Argentina Automobile Front-end Volume (K) Forecast, by Application 2020 & 2033
- Table 29: Rest of South America Automobile Front-end Revenue (undefined) Forecast, by Application 2020 & 2033
- Table 30: Rest of South America Automobile Front-end Volume (K) Forecast, by Application 2020 & 2033
- Table 31: Global Automobile Front-end Revenue undefined Forecast, by Application 2020 & 2033
- Table 32: Global Automobile Front-end Volume K Forecast, by Application 2020 & 2033
- Table 33: Global Automobile Front-end Revenue undefined Forecast, by Types 2020 & 2033
- Table 34: Global Automobile Front-end Volume K Forecast, by Types 2020 & 2033
- Table 35: Global Automobile Front-end Revenue undefined Forecast, by Country 2020 & 2033
- Table 36: Global Automobile Front-end Volume K Forecast, by Country 2020 & 2033
- Table 37: United Kingdom Automobile Front-end Revenue (undefined) Forecast, by Application 2020 & 2033
- Table 38: United Kingdom Automobile Front-end Volume (K) Forecast, by Application 2020 & 2033
- Table 39: Germany Automobile Front-end Revenue (undefined) Forecast, by Application 2020 & 2033
- Table 40: Germany Automobile Front-end Volume (K) Forecast, by Application 2020 & 2033
- Table 41: France Automobile Front-end Revenue (undefined) Forecast, by Application 2020 & 2033
- Table 42: France Automobile Front-end Volume (K) Forecast, by Application 2020 & 2033
- Table 43: Italy Automobile Front-end Revenue (undefined) Forecast, by Application 2020 & 2033
- Table 44: Italy Automobile Front-end Volume (K) Forecast, by Application 2020 & 2033
- Table 45: Spain Automobile Front-end Revenue (undefined) Forecast, by Application 2020 & 2033
- Table 46: Spain Automobile Front-end Volume (K) Forecast, by Application 2020 & 2033
- Table 47: Russia Automobile Front-end Revenue (undefined) Forecast, by Application 2020 & 2033
- Table 48: Russia Automobile Front-end Volume (K) Forecast, by Application 2020 & 2033
- Table 49: Benelux Automobile Front-end Revenue (undefined) Forecast, by Application 2020 & 2033
- Table 50: Benelux Automobile Front-end Volume (K) Forecast, by Application 2020 & 2033
- Table 51: Nordics Automobile Front-end Revenue (undefined) Forecast, by Application 2020 & 2033
- Table 52: Nordics Automobile Front-end Volume (K) Forecast, by Application 2020 & 2033
- Table 53: Rest of Europe Automobile Front-end Revenue (undefined) Forecast, by Application 2020 & 2033
- Table 54: Rest of Europe Automobile Front-end Volume (K) Forecast, by Application 2020 & 2033
- Table 55: Global Automobile Front-end Revenue undefined Forecast, by Application 2020 & 2033
- Table 56: Global Automobile Front-end Volume K Forecast, by Application 2020 & 2033
- Table 57: Global Automobile Front-end Revenue undefined Forecast, by Types 2020 & 2033
- Table 58: Global Automobile Front-end Volume K Forecast, by Types 2020 & 2033
- Table 59: Global Automobile Front-end Revenue undefined Forecast, by Country 2020 & 2033
- Table 60: Global Automobile Front-end Volume K Forecast, by Country 2020 & 2033
- Table 61: Turkey Automobile Front-end Revenue (undefined) Forecast, by Application 2020 & 2033
- Table 62: Turkey Automobile Front-end Volume (K) Forecast, by Application 2020 & 2033
- Table 63: Israel Automobile Front-end Revenue (undefined) Forecast, by Application 2020 & 2033
- Table 64: Israel Automobile Front-end Volume (K) Forecast, by Application 2020 & 2033
- Table 65: GCC Automobile Front-end Revenue (undefined) Forecast, by Application 2020 & 2033
- Table 66: GCC Automobile Front-end Volume (K) Forecast, by Application 2020 & 2033
- Table 67: North Africa Automobile Front-end Revenue (undefined) Forecast, by Application 2020 & 2033
- Table 68: North Africa Automobile Front-end Volume (K) Forecast, by Application 2020 & 2033
- Table 69: South Africa Automobile Front-end Revenue (undefined) Forecast, by Application 2020 & 2033
- Table 70: South Africa Automobile Front-end Volume (K) Forecast, by Application 2020 & 2033
- Table 71: Rest of Middle East & Africa Automobile Front-end Revenue (undefined) Forecast, by Application 2020 & 2033
- Table 72: Rest of Middle East & Africa Automobile Front-end Volume (K) Forecast, by Application 2020 & 2033
- Table 73: Global Automobile Front-end Revenue undefined Forecast, by Application 2020 & 2033
- Table 74: Global Automobile Front-end Volume K Forecast, by Application 2020 & 2033
- Table 75: Global Automobile Front-end Revenue undefined Forecast, by Types 2020 & 2033
- Table 76: Global Automobile Front-end Volume K Forecast, by Types 2020 & 2033
- Table 77: Global Automobile Front-end Revenue undefined Forecast, by Country 2020 & 2033
- Table 78: Global Automobile Front-end Volume K Forecast, by Country 2020 & 2033
- Table 79: China Automobile Front-end Revenue (undefined) Forecast, by Application 2020 & 2033
- Table 80: China Automobile Front-end Volume (K) Forecast, by Application 2020 & 2033
- Table 81: India Automobile Front-end Revenue (undefined) Forecast, by Application 2020 & 2033
- Table 82: India Automobile Front-end Volume (K) Forecast, by Application 2020 & 2033
- Table 83: Japan Automobile Front-end Revenue (undefined) Forecast, by Application 2020 & 2033
- Table 84: Japan Automobile Front-end Volume (K) Forecast, by Application 2020 & 2033
- Table 85: South Korea Automobile Front-end Revenue (undefined) Forecast, by Application 2020 & 2033
- Table 86: South Korea Automobile Front-end Volume (K) Forecast, by Application 2020 & 2033
- Table 87: ASEAN Automobile Front-end Revenue (undefined) Forecast, by Application 2020 & 2033
- Table 88: ASEAN Automobile Front-end Volume (K) Forecast, by Application 2020 & 2033
- Table 89: Oceania Automobile Front-end Revenue (undefined) Forecast, by Application 2020 & 2033
- Table 90: Oceania Automobile Front-end Volume (K) Forecast, by Application 2020 & 2033
- Table 91: Rest of Asia Pacific Automobile Front-end Revenue (undefined) Forecast, by Application 2020 & 2033
- Table 92: Rest of Asia Pacific Automobile Front-end Volume (K) Forecast, by Application 2020 & 2033
Frequently Asked Questions
1. What is the projected Compound Annual Growth Rate (CAGR) of the Automobile Front-end?
The projected CAGR is approximately 4.7%.
2. Which companies are prominent players in the Automobile Front-end?
Key companies in the market include Magna International Inc., Faurecia SA, Valeo SA, Denso Corporation, Continental AG, Robert Bosch GmbH, BorgWarner Inc., Marelli Holdings Co., Ltd., Johnson Controls International plc, Webasto SE, Benteler Automotive, Mahle GmbH, Plastic Omnium, Hella GmbH & Co. KGaA, Brose Fahrzeugteile GmbH & Co. KG.
3. What are the main segments of the Automobile Front-end?
The market segments include Application, Types.
4. Can you provide details about the market size?
The market size is estimated to be USD XXX N/A as of 2022.
5. What are some drivers contributing to market growth?
N/A
6. What are the notable trends driving market growth?
N/A
7. Are there any restraints impacting market growth?
N/A
8. Can you provide examples of recent developments in the market?
N/A
9. What pricing options are available for accessing the report?
Pricing options include single-user, multi-user, and enterprise licenses priced at USD 3950.00, USD 5925.00, and USD 7900.00 respectively.
10. Is the market size provided in terms of value or volume?
The market size is provided in terms of value, measured in N/A and volume, measured in K.
11. Are there any specific market keywords associated with the report?
Yes, the market keyword associated with the report is "Automobile Front-end," which aids in identifying and referencing the specific market segment covered.
12. How do I determine which pricing option suits my needs best?
The pricing options vary based on user requirements and access needs. Individual users may opt for single-user licenses, while businesses requiring broader access may choose multi-user or enterprise licenses for cost-effective access to the report.
13. Are there any additional resources or data provided in the Automobile Front-end report?
While the report offers comprehensive insights, it's advisable to review the specific contents or supplementary materials provided to ascertain if additional resources or data are available.
14. How can I stay updated on further developments or reports in the Automobile Front-end?
To stay informed about further developments, trends, and reports in the Automobile Front-end, consider subscribing to industry newsletters, following relevant companies and organizations, or regularly checking reputable industry news sources and publications.
Methodology
Step 1 - Identification of Relevant Samples Size from Population Database


Step 2 - Approaches for Defining Global Market Size (Value, Volume* & Price*)

Note*: In applicable scenarios
Step 3 - Data Sources
Primary Research
- Web Analytics
- Survey Reports
- Research Institute
- Latest Research Reports
- Opinion Leaders
Secondary Research
- Annual Reports
- White Paper
- Latest Press Release
- Industry Association
- Paid Database
- Investor Presentations

Step 4 - Data Triangulation
Involves using different sources of information in order to increase the validity of a study
These sources are likely to be stakeholders in a program - participants, other researchers, program staff, other community members, and so on.
Then we put all data in single framework & apply various statistical tools to find out the dynamic on the market.
During the analysis stage, feedback from the stakeholder groups would be compared to determine areas of agreement as well as areas of divergence