

Key Insights
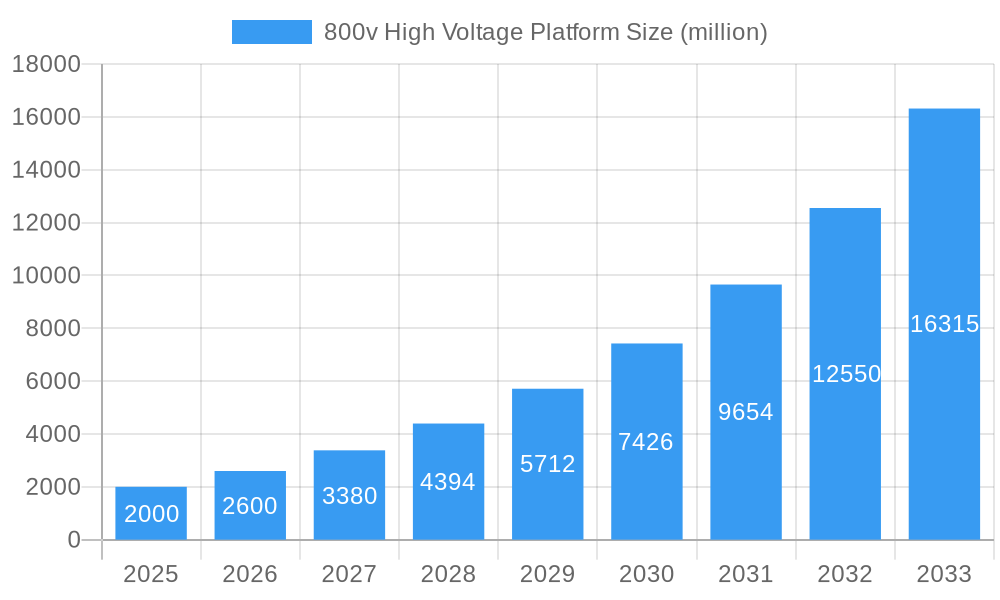
The 800V high-voltage platform market is experiencing rapid growth, driven by the increasing demand for high-performance electric vehicles (EVs) and the need for faster charging times. The adoption of 800V architectures significantly reduces charging times, enhancing the overall EV user experience and addressing a key barrier to wider EV adoption. Key players like Huawei, Farasis Energy, and several major automotive manufacturers (including Volkswagen, Mercedes-Benz, and BYD) are heavily investing in R&D and production capabilities, indicating a strong belief in the long-term potential of this technology. This market is segmented by vehicle type (passenger cars, commercial vehicles), battery technology (solid-state, lithium-ion), and geographic region. The significant investments and collaborations across the supply chain suggest a robust ecosystem is emerging, accelerating innovation and driving down costs. We estimate the market size in 2025 to be around $2 Billion, with a Compound Annual Growth Rate (CAGR) of approximately 30% projected through 2033. This growth is primarily fueled by expanding EV sales, stricter emission regulations globally, and continuous advancements in battery technology that enable the efficient and safe utilization of higher voltages.
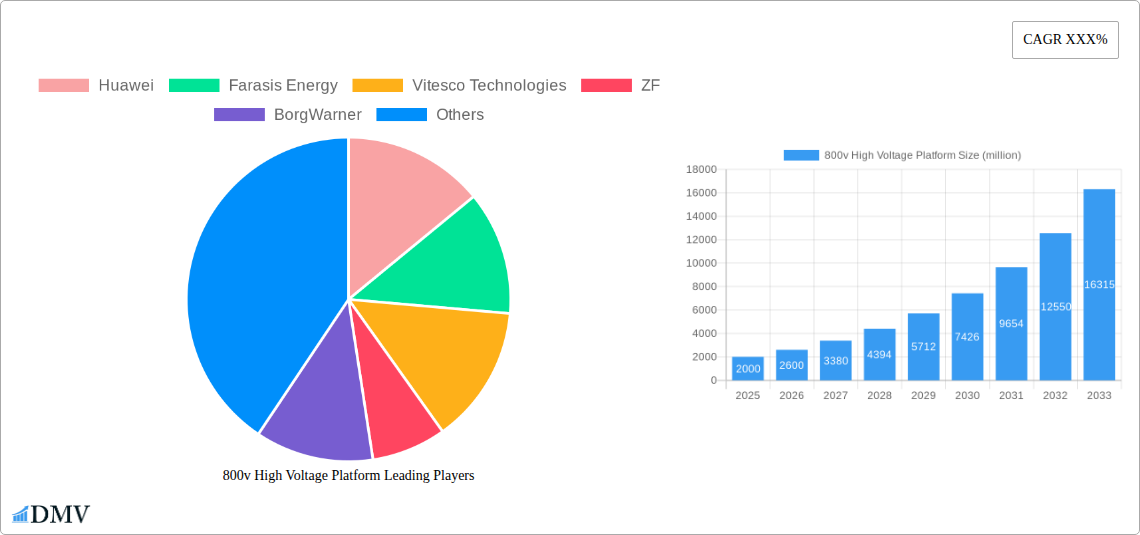
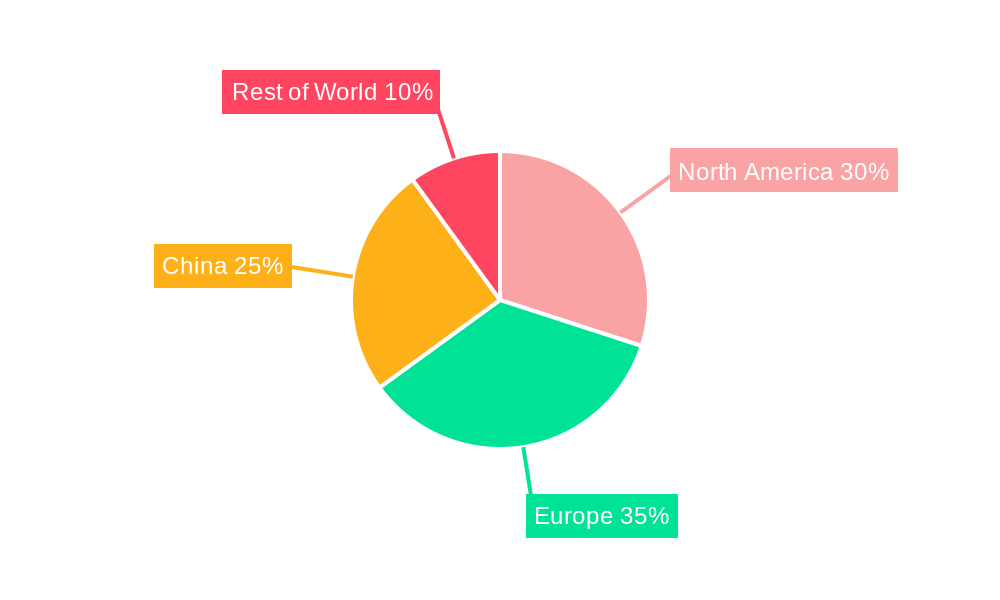
800v High Voltage Platform Market Size (In Billion)
The restraints on market growth primarily involve the high initial investment costs associated with developing and manufacturing 800V components and infrastructure. The need for specialized charging stations also poses a challenge to rapid market penetration. However, government incentives, decreasing battery costs, and the scalability of production are mitigating these factors. The geographical distribution of the market will likely see a strong concentration initially in regions with robust EV adoption and supportive government policies, such as Europe, China, and North America, eventually expanding globally as the technology matures and becomes more cost-effective. The competition within the market is fierce, with established automotive players and technology companies vying for market share. Strategic partnerships and mergers & acquisitions are expected to reshape the competitive landscape in the coming years.
800v High Voltage Platform Company Market Share
800V High Voltage Platform Market: A Comprehensive Report (2019-2033)
This insightful report provides a comprehensive analysis of the burgeoning 800V high voltage platform market, projecting a market value exceeding $XX million by 2033. The study covers the historical period (2019-2024), the base year (2025), and forecasts until 2033, offering invaluable insights for stakeholders across the automotive, energy, and technology sectors. Key players such as Huawei, Farasis Energy, Vitesco Technologies, ZF, BorgWarner, AVL, Voyah, Xpeng, Porsche, Hyundai, Volkswagen Group, Mercedes-Benz, BYD Company, and Geely are analyzed in detail.
800V High Voltage Platform Market Composition & Trends
This section meticulously evaluates the 800V high voltage platform market's composition and prevailing trends. We delve into market concentration, identifying key players and their respective market share distributions. For instance, in 2025, we estimate that the top 5 players command approximately xx% of the market, with a projected shift towards a more fragmented landscape by 2033 due to increasing innovation and new entrants. The report also examines innovation drivers, such as advancements in battery technology and power electronics, alongside regulatory landscapes impacting adoption rates. Further analysis covers substitute products and their competitive threat, alongside detailed end-user profiles (e.g., luxury EVs vs. mass-market EVs) and a comprehensive overview of M&A activities in the sector, including deal values exceeding $XX million in recent years. Key aspects include:
- Market Share Distribution: Detailed breakdown by key players for 2025 and projected shares for 2033.
- M&A Activity: Analysis of significant mergers and acquisitions, including deal values and their impact on market consolidation.
- Regulatory Landscape: Assessment of governmental regulations and standards impacting the 800V high-voltage platform market globally.
- Substitute Product Analysis: Evaluation of alternative technologies and their potential impact on market growth.
800V High Voltage Platform Industry Evolution
This section provides a detailed analysis of the 800V high voltage platform market's evolution. We analyze the market's growth trajectory, projecting a Compound Annual Growth Rate (CAGR) of xx% from 2025 to 2033, driven by increasing demand for high-performance electric vehicles (EVs) and the continuous improvement of battery technology. Technological advancements, including improvements in battery chemistry, thermal management systems, and charging infrastructure, are examined. The report also considers shifting consumer demands, such as the preference for faster charging times and extended driving ranges, influencing the adoption rate of 800V systems. Specific data points detailing market penetration and technological adoption are incorporated throughout the analysis, highlighting the transition from lower-voltage systems to the 800V platform.
Leading Regions, Countries, or Segments in 800V High Voltage Platform
This section pinpoints the leading regions and segments driving the 800V high voltage platform market. Analysis suggests that [Region/Country] currently holds the largest market share, primarily due to [specific reasons].
- Key Drivers in [Dominant Region/Country]:
- Robust governmental support and incentives for EV adoption.
- Significant investments in charging infrastructure development.
- A thriving domestic automotive industry with strong focus on electric vehicles.
- Favorable regulatory frameworks promoting technological advancements.
Further analysis provides a nuanced understanding of the factors contributing to the dominance of this region. This includes a detailed examination of investment trends, government policies, consumer preferences, and the competitive landscape within that specific area.
800V High Voltage Platform Product Innovations
This section explores the latest product innovations, showcasing advancements in battery technology, power electronics, and thermal management systems. The focus is on unique selling propositions, such as significantly reduced charging times and improved energy efficiency compared to lower-voltage systems, and the technological advancements driving these improvements. Analysis includes metrics such as charging speeds, energy density, and system efficiency.
Propelling Factors for 800V High Voltage Platform Growth
The growth of the 800V high voltage platform market is primarily driven by technological advancements, economic factors, and supportive regulations. Technological breakthroughs in battery technology, resulting in increased energy density and faster charging capabilities, are a key driver. Government incentives and subsidies promoting EV adoption, alongside the decreasing cost of battery packs, further stimulate market expansion. Stringent emission regulations worldwide are pushing automakers to adopt more efficient and sustainable solutions, accelerating the transition towards 800V systems.
Obstacles in the 800v High Voltage Platform Market
Despite the significant growth potential, several obstacles hinder the widespread adoption of 800V high voltage platforms. High initial investment costs for infrastructure and vehicle integration remain a significant barrier. Supply chain disruptions, particularly regarding critical battery materials and components, can also negatively impact production and market growth. Intense competition amongst established and emerging players adds further complexity. These factors can lead to price fluctuations and affect the overall market dynamics.
Future Opportunities in 800v High Voltage Platform
The 800V high voltage platform market presents several promising opportunities. Expansion into new markets, particularly developing economies with burgeoning EV sectors, offers significant potential for growth. Advancements in solid-state batteries, wireless charging technologies, and improved thermal management systems will further enhance the appeal of 800V systems. Emerging consumer trends, such as a growing preference for high-performance EVs with extended ranges and fast charging capabilities, create favorable conditions for market expansion.
Major Players in the 800v High Voltage Platform Ecosystem
- Huawei
- Farasis Energy
- Vitesco Technologies
- ZF
- BorgWarner
- AVL
- Voyah
- Xpeng
- Porsche
- Hyundai
- Volkswagen Group
- Mercedes-Benz
- BYD Company
- Geely
Key Developments in 800v High Voltage Platform Industry
- [Month, Year]: [Company] announces the launch of a new 800V battery system with enhanced charging capabilities.
- [Month, Year]: [Company A] and [Company B] partner to develop advanced 800V power electronics for electric vehicles.
- [Month, Year]: Government [Country] announces significant investments in 800V charging infrastructure.
- [Month, Year]: [Company] unveils a new electric vehicle model featuring an 800V high-voltage platform.
Strategic 800V High Voltage Platform Market Forecast
The 800V high voltage platform market is poised for significant growth over the forecast period (2025-2033), driven by continuous technological innovations, increasing EV adoption, and supportive government policies. The market's potential is immense, with projections indicating a substantial increase in market value. Continued advancements in battery technology, coupled with expanding charging infrastructure, will further accelerate the adoption of 800V systems across various segments of the electric vehicle market.
800v High Voltage Platform Segmentation
-
1. Application
- 1.1. In-vehicle
- 1.2. Charging Pile
-
2. Type
- 2.1. Maximum Charging Power: Less than 270kW
- 2.2. Maximum Charging Power: 270-360kW
- 2.3. Maximum Charging Power: More than 360kW
800v High Voltage Platform Segmentation By Geography
-
1. North America
- 1.1. United States
- 1.2. Canada
- 1.3. Mexico
-
2. South America
- 2.1. Brazil
- 2.2. Argentina
- 2.3. Rest of South America
-
3. Europe
- 3.1. United Kingdom
- 3.2. Germany
- 3.3. France
- 3.4. Italy
- 3.5. Spain
- 3.6. Russia
- 3.7. Benelux
- 3.8. Nordics
- 3.9. Rest of Europe
-
4. Middle East & Africa
- 4.1. Turkey
- 4.2. Israel
- 4.3. GCC
- 4.4. North Africa
- 4.5. South Africa
- 4.6. Rest of Middle East & Africa
-
5. Asia Pacific
- 5.1. China
- 5.2. India
- 5.3. Japan
- 5.4. South Korea
- 5.5. ASEAN
- 5.6. Oceania
- 5.7. Rest of Asia Pacific
800v High Voltage Platform Regional Market Share
Geographic Coverage of 800v High Voltage Platform
800v High Voltage Platform REPORT HIGHLIGHTS
| Aspects | Details |
|---|---|
| Study Period | 2020-2034 |
| Base Year | 2025 |
| Estimated Year | 2026 |
| Forecast Period | 2026-2034 |
| Historical Period | 2020-2025 |
| Growth Rate | CAGR of XXX% from 2020-2034 |
| Segmentation |
|
Table of Contents
- 1. Introduction
- 1.1. Research Scope
- 1.2. Market Segmentation
- 1.3. Research Methodology
- 1.4. Definitions and Assumptions
- 2. Executive Summary
- 2.1. Introduction
- 3. Market Dynamics
- 3.1. Introduction
- 3.2. Market Drivers
- 3.3. Market Restrains
- 3.4. Market Trends
- 4. Market Factor Analysis
- 4.1. Porters Five Forces
- 4.2. Supply/Value Chain
- 4.3. PESTEL analysis
- 4.4. Market Entropy
- 4.5. Patent/Trademark Analysis
- 5. Global 800v High Voltage Platform Analysis, Insights and Forecast, 2020-2032
- 5.1. Market Analysis, Insights and Forecast - by Application
- 5.1.1. In-vehicle
- 5.1.2. Charging Pile
- 5.2. Market Analysis, Insights and Forecast - by Type
- 5.2.1. Maximum Charging Power: Less than 270kW
- 5.2.2. Maximum Charging Power: 270-360kW
- 5.2.3. Maximum Charging Power: More than 360kW
- 5.3. Market Analysis, Insights and Forecast - by Region
- 5.3.1. North America
- 5.3.2. South America
- 5.3.3. Europe
- 5.3.4. Middle East & Africa
- 5.3.5. Asia Pacific
- 5.1. Market Analysis, Insights and Forecast - by Application
- 6. North America 800v High Voltage Platform Analysis, Insights and Forecast, 2020-2032
- 6.1. Market Analysis, Insights and Forecast - by Application
- 6.1.1. In-vehicle
- 6.1.2. Charging Pile
- 6.2. Market Analysis, Insights and Forecast - by Type
- 6.2.1. Maximum Charging Power: Less than 270kW
- 6.2.2. Maximum Charging Power: 270-360kW
- 6.2.3. Maximum Charging Power: More than 360kW
- 6.1. Market Analysis, Insights and Forecast - by Application
- 7. South America 800v High Voltage Platform Analysis, Insights and Forecast, 2020-2032
- 7.1. Market Analysis, Insights and Forecast - by Application
- 7.1.1. In-vehicle
- 7.1.2. Charging Pile
- 7.2. Market Analysis, Insights and Forecast - by Type
- 7.2.1. Maximum Charging Power: Less than 270kW
- 7.2.2. Maximum Charging Power: 270-360kW
- 7.2.3. Maximum Charging Power: More than 360kW
- 7.1. Market Analysis, Insights and Forecast - by Application
- 8. Europe 800v High Voltage Platform Analysis, Insights and Forecast, 2020-2032
- 8.1. Market Analysis, Insights and Forecast - by Application
- 8.1.1. In-vehicle
- 8.1.2. Charging Pile
- 8.2. Market Analysis, Insights and Forecast - by Type
- 8.2.1. Maximum Charging Power: Less than 270kW
- 8.2.2. Maximum Charging Power: 270-360kW
- 8.2.3. Maximum Charging Power: More than 360kW
- 8.1. Market Analysis, Insights and Forecast - by Application
- 9. Middle East & Africa 800v High Voltage Platform Analysis, Insights and Forecast, 2020-2032
- 9.1. Market Analysis, Insights and Forecast - by Application
- 9.1.1. In-vehicle
- 9.1.2. Charging Pile
- 9.2. Market Analysis, Insights and Forecast - by Type
- 9.2.1. Maximum Charging Power: Less than 270kW
- 9.2.2. Maximum Charging Power: 270-360kW
- 9.2.3. Maximum Charging Power: More than 360kW
- 9.1. Market Analysis, Insights and Forecast - by Application
- 10. Asia Pacific 800v High Voltage Platform Analysis, Insights and Forecast, 2020-2032
- 10.1. Market Analysis, Insights and Forecast - by Application
- 10.1.1. In-vehicle
- 10.1.2. Charging Pile
- 10.2. Market Analysis, Insights and Forecast - by Type
- 10.2.1. Maximum Charging Power: Less than 270kW
- 10.2.2. Maximum Charging Power: 270-360kW
- 10.2.3. Maximum Charging Power: More than 360kW
- 10.1. Market Analysis, Insights and Forecast - by Application
- 11. Competitive Analysis
- 11.1. Global Market Share Analysis 2025
- 11.2. Company Profiles
- 11.2.1 Huawei
- 11.2.1.1. Overview
- 11.2.1.2. Products
- 11.2.1.3. SWOT Analysis
- 11.2.1.4. Recent Developments
- 11.2.1.5. Financials (Based on Availability)
- 11.2.2 Farasis Energy
- 11.2.2.1. Overview
- 11.2.2.2. Products
- 11.2.2.3. SWOT Analysis
- 11.2.2.4. Recent Developments
- 11.2.2.5. Financials (Based on Availability)
- 11.2.3 Vitesco Technologies
- 11.2.3.1. Overview
- 11.2.3.2. Products
- 11.2.3.3. SWOT Analysis
- 11.2.3.4. Recent Developments
- 11.2.3.5. Financials (Based on Availability)
- 11.2.4 ZF
- 11.2.4.1. Overview
- 11.2.4.2. Products
- 11.2.4.3. SWOT Analysis
- 11.2.4.4. Recent Developments
- 11.2.4.5. Financials (Based on Availability)
- 11.2.5 BorgWarner
- 11.2.5.1. Overview
- 11.2.5.2. Products
- 11.2.5.3. SWOT Analysis
- 11.2.5.4. Recent Developments
- 11.2.5.5. Financials (Based on Availability)
- 11.2.6 AVL
- 11.2.6.1. Overview
- 11.2.6.2. Products
- 11.2.6.3. SWOT Analysis
- 11.2.6.4. Recent Developments
- 11.2.6.5. Financials (Based on Availability)
- 11.2.7 Voyah
- 11.2.7.1. Overview
- 11.2.7.2. Products
- 11.2.7.3. SWOT Analysis
- 11.2.7.4. Recent Developments
- 11.2.7.5. Financials (Based on Availability)
- 11.2.8 Xpeng
- 11.2.8.1. Overview
- 11.2.8.2. Products
- 11.2.8.3. SWOT Analysis
- 11.2.8.4. Recent Developments
- 11.2.8.5. Financials (Based on Availability)
- 11.2.9 Porsche
- 11.2.9.1. Overview
- 11.2.9.2. Products
- 11.2.9.3. SWOT Analysis
- 11.2.9.4. Recent Developments
- 11.2.9.5. Financials (Based on Availability)
- 11.2.10 Hyundai
- 11.2.10.1. Overview
- 11.2.10.2. Products
- 11.2.10.3. SWOT Analysis
- 11.2.10.4. Recent Developments
- 11.2.10.5. Financials (Based on Availability)
- 11.2.11 Volkswagen Group
- 11.2.11.1. Overview
- 11.2.11.2. Products
- 11.2.11.3. SWOT Analysis
- 11.2.11.4. Recent Developments
- 11.2.11.5. Financials (Based on Availability)
- 11.2.12 Mercedes-Benz
- 11.2.12.1. Overview
- 11.2.12.2. Products
- 11.2.12.3. SWOT Analysis
- 11.2.12.4. Recent Developments
- 11.2.12.5. Financials (Based on Availability)
- 11.2.13 BYD Company
- 11.2.13.1. Overview
- 11.2.13.2. Products
- 11.2.13.3. SWOT Analysis
- 11.2.13.4. Recent Developments
- 11.2.13.5. Financials (Based on Availability)
- 11.2.14 Geely
- 11.2.14.1. Overview
- 11.2.14.2. Products
- 11.2.14.3. SWOT Analysis
- 11.2.14.4. Recent Developments
- 11.2.14.5. Financials (Based on Availability)
- 11.2.1 Huawei
List of Figures
- Figure 1: Global 800v High Voltage Platform Revenue Breakdown (million, %) by Region 2025 & 2033
- Figure 2: Global 800v High Voltage Platform Volume Breakdown (K, %) by Region 2025 & 2033
- Figure 3: North America 800v High Voltage Platform Revenue (million), by Application 2025 & 2033
- Figure 4: North America 800v High Voltage Platform Volume (K), by Application 2025 & 2033
- Figure 5: North America 800v High Voltage Platform Revenue Share (%), by Application 2025 & 2033
- Figure 6: North America 800v High Voltage Platform Volume Share (%), by Application 2025 & 2033
- Figure 7: North America 800v High Voltage Platform Revenue (million), by Type 2025 & 2033
- Figure 8: North America 800v High Voltage Platform Volume (K), by Type 2025 & 2033
- Figure 9: North America 800v High Voltage Platform Revenue Share (%), by Type 2025 & 2033
- Figure 10: North America 800v High Voltage Platform Volume Share (%), by Type 2025 & 2033
- Figure 11: North America 800v High Voltage Platform Revenue (million), by Country 2025 & 2033
- Figure 12: North America 800v High Voltage Platform Volume (K), by Country 2025 & 2033
- Figure 13: North America 800v High Voltage Platform Revenue Share (%), by Country 2025 & 2033
- Figure 14: North America 800v High Voltage Platform Volume Share (%), by Country 2025 & 2033
- Figure 15: South America 800v High Voltage Platform Revenue (million), by Application 2025 & 2033
- Figure 16: South America 800v High Voltage Platform Volume (K), by Application 2025 & 2033
- Figure 17: South America 800v High Voltage Platform Revenue Share (%), by Application 2025 & 2033
- Figure 18: South America 800v High Voltage Platform Volume Share (%), by Application 2025 & 2033
- Figure 19: South America 800v High Voltage Platform Revenue (million), by Type 2025 & 2033
- Figure 20: South America 800v High Voltage Platform Volume (K), by Type 2025 & 2033
- Figure 21: South America 800v High Voltage Platform Revenue Share (%), by Type 2025 & 2033
- Figure 22: South America 800v High Voltage Platform Volume Share (%), by Type 2025 & 2033
- Figure 23: South America 800v High Voltage Platform Revenue (million), by Country 2025 & 2033
- Figure 24: South America 800v High Voltage Platform Volume (K), by Country 2025 & 2033
- Figure 25: South America 800v High Voltage Platform Revenue Share (%), by Country 2025 & 2033
- Figure 26: South America 800v High Voltage Platform Volume Share (%), by Country 2025 & 2033
- Figure 27: Europe 800v High Voltage Platform Revenue (million), by Application 2025 & 2033
- Figure 28: Europe 800v High Voltage Platform Volume (K), by Application 2025 & 2033
- Figure 29: Europe 800v High Voltage Platform Revenue Share (%), by Application 2025 & 2033
- Figure 30: Europe 800v High Voltage Platform Volume Share (%), by Application 2025 & 2033
- Figure 31: Europe 800v High Voltage Platform Revenue (million), by Type 2025 & 2033
- Figure 32: Europe 800v High Voltage Platform Volume (K), by Type 2025 & 2033
- Figure 33: Europe 800v High Voltage Platform Revenue Share (%), by Type 2025 & 2033
- Figure 34: Europe 800v High Voltage Platform Volume Share (%), by Type 2025 & 2033
- Figure 35: Europe 800v High Voltage Platform Revenue (million), by Country 2025 & 2033
- Figure 36: Europe 800v High Voltage Platform Volume (K), by Country 2025 & 2033
- Figure 37: Europe 800v High Voltage Platform Revenue Share (%), by Country 2025 & 2033
- Figure 38: Europe 800v High Voltage Platform Volume Share (%), by Country 2025 & 2033
- Figure 39: Middle East & Africa 800v High Voltage Platform Revenue (million), by Application 2025 & 2033
- Figure 40: Middle East & Africa 800v High Voltage Platform Volume (K), by Application 2025 & 2033
- Figure 41: Middle East & Africa 800v High Voltage Platform Revenue Share (%), by Application 2025 & 2033
- Figure 42: Middle East & Africa 800v High Voltage Platform Volume Share (%), by Application 2025 & 2033
- Figure 43: Middle East & Africa 800v High Voltage Platform Revenue (million), by Type 2025 & 2033
- Figure 44: Middle East & Africa 800v High Voltage Platform Volume (K), by Type 2025 & 2033
- Figure 45: Middle East & Africa 800v High Voltage Platform Revenue Share (%), by Type 2025 & 2033
- Figure 46: Middle East & Africa 800v High Voltage Platform Volume Share (%), by Type 2025 & 2033
- Figure 47: Middle East & Africa 800v High Voltage Platform Revenue (million), by Country 2025 & 2033
- Figure 48: Middle East & Africa 800v High Voltage Platform Volume (K), by Country 2025 & 2033
- Figure 49: Middle East & Africa 800v High Voltage Platform Revenue Share (%), by Country 2025 & 2033
- Figure 50: Middle East & Africa 800v High Voltage Platform Volume Share (%), by Country 2025 & 2033
- Figure 51: Asia Pacific 800v High Voltage Platform Revenue (million), by Application 2025 & 2033
- Figure 52: Asia Pacific 800v High Voltage Platform Volume (K), by Application 2025 & 2033
- Figure 53: Asia Pacific 800v High Voltage Platform Revenue Share (%), by Application 2025 & 2033
- Figure 54: Asia Pacific 800v High Voltage Platform Volume Share (%), by Application 2025 & 2033
- Figure 55: Asia Pacific 800v High Voltage Platform Revenue (million), by Type 2025 & 2033
- Figure 56: Asia Pacific 800v High Voltage Platform Volume (K), by Type 2025 & 2033
- Figure 57: Asia Pacific 800v High Voltage Platform Revenue Share (%), by Type 2025 & 2033
- Figure 58: Asia Pacific 800v High Voltage Platform Volume Share (%), by Type 2025 & 2033
- Figure 59: Asia Pacific 800v High Voltage Platform Revenue (million), by Country 2025 & 2033
- Figure 60: Asia Pacific 800v High Voltage Platform Volume (K), by Country 2025 & 2033
- Figure 61: Asia Pacific 800v High Voltage Platform Revenue Share (%), by Country 2025 & 2033
- Figure 62: Asia Pacific 800v High Voltage Platform Volume Share (%), by Country 2025 & 2033
List of Tables
- Table 1: Global 800v High Voltage Platform Revenue million Forecast, by Application 2020 & 2033
- Table 2: Global 800v High Voltage Platform Volume K Forecast, by Application 2020 & 2033
- Table 3: Global 800v High Voltage Platform Revenue million Forecast, by Type 2020 & 2033
- Table 4: Global 800v High Voltage Platform Volume K Forecast, by Type 2020 & 2033
- Table 5: Global 800v High Voltage Platform Revenue million Forecast, by Region 2020 & 2033
- Table 6: Global 800v High Voltage Platform Volume K Forecast, by Region 2020 & 2033
- Table 7: Global 800v High Voltage Platform Revenue million Forecast, by Application 2020 & 2033
- Table 8: Global 800v High Voltage Platform Volume K Forecast, by Application 2020 & 2033
- Table 9: Global 800v High Voltage Platform Revenue million Forecast, by Type 2020 & 2033
- Table 10: Global 800v High Voltage Platform Volume K Forecast, by Type 2020 & 2033
- Table 11: Global 800v High Voltage Platform Revenue million Forecast, by Country 2020 & 2033
- Table 12: Global 800v High Voltage Platform Volume K Forecast, by Country 2020 & 2033
- Table 13: United States 800v High Voltage Platform Revenue (million) Forecast, by Application 2020 & 2033
- Table 14: United States 800v High Voltage Platform Volume (K) Forecast, by Application 2020 & 2033
- Table 15: Canada 800v High Voltage Platform Revenue (million) Forecast, by Application 2020 & 2033
- Table 16: Canada 800v High Voltage Platform Volume (K) Forecast, by Application 2020 & 2033
- Table 17: Mexico 800v High Voltage Platform Revenue (million) Forecast, by Application 2020 & 2033
- Table 18: Mexico 800v High Voltage Platform Volume (K) Forecast, by Application 2020 & 2033
- Table 19: Global 800v High Voltage Platform Revenue million Forecast, by Application 2020 & 2033
- Table 20: Global 800v High Voltage Platform Volume K Forecast, by Application 2020 & 2033
- Table 21: Global 800v High Voltage Platform Revenue million Forecast, by Type 2020 & 2033
- Table 22: Global 800v High Voltage Platform Volume K Forecast, by Type 2020 & 2033
- Table 23: Global 800v High Voltage Platform Revenue million Forecast, by Country 2020 & 2033
- Table 24: Global 800v High Voltage Platform Volume K Forecast, by Country 2020 & 2033
- Table 25: Brazil 800v High Voltage Platform Revenue (million) Forecast, by Application 2020 & 2033
- Table 26: Brazil 800v High Voltage Platform Volume (K) Forecast, by Application 2020 & 2033
- Table 27: Argentina 800v High Voltage Platform Revenue (million) Forecast, by Application 2020 & 2033
- Table 28: Argentina 800v High Voltage Platform Volume (K) Forecast, by Application 2020 & 2033
- Table 29: Rest of South America 800v High Voltage Platform Revenue (million) Forecast, by Application 2020 & 2033
- Table 30: Rest of South America 800v High Voltage Platform Volume (K) Forecast, by Application 2020 & 2033
- Table 31: Global 800v High Voltage Platform Revenue million Forecast, by Application 2020 & 2033
- Table 32: Global 800v High Voltage Platform Volume K Forecast, by Application 2020 & 2033
- Table 33: Global 800v High Voltage Platform Revenue million Forecast, by Type 2020 & 2033
- Table 34: Global 800v High Voltage Platform Volume K Forecast, by Type 2020 & 2033
- Table 35: Global 800v High Voltage Platform Revenue million Forecast, by Country 2020 & 2033
- Table 36: Global 800v High Voltage Platform Volume K Forecast, by Country 2020 & 2033
- Table 37: United Kingdom 800v High Voltage Platform Revenue (million) Forecast, by Application 2020 & 2033
- Table 38: United Kingdom 800v High Voltage Platform Volume (K) Forecast, by Application 2020 & 2033
- Table 39: Germany 800v High Voltage Platform Revenue (million) Forecast, by Application 2020 & 2033
- Table 40: Germany 800v High Voltage Platform Volume (K) Forecast, by Application 2020 & 2033
- Table 41: France 800v High Voltage Platform Revenue (million) Forecast, by Application 2020 & 2033
- Table 42: France 800v High Voltage Platform Volume (K) Forecast, by Application 2020 & 2033
- Table 43: Italy 800v High Voltage Platform Revenue (million) Forecast, by Application 2020 & 2033
- Table 44: Italy 800v High Voltage Platform Volume (K) Forecast, by Application 2020 & 2033
- Table 45: Spain 800v High Voltage Platform Revenue (million) Forecast, by Application 2020 & 2033
- Table 46: Spain 800v High Voltage Platform Volume (K) Forecast, by Application 2020 & 2033
- Table 47: Russia 800v High Voltage Platform Revenue (million) Forecast, by Application 2020 & 2033
- Table 48: Russia 800v High Voltage Platform Volume (K) Forecast, by Application 2020 & 2033
- Table 49: Benelux 800v High Voltage Platform Revenue (million) Forecast, by Application 2020 & 2033
- Table 50: Benelux 800v High Voltage Platform Volume (K) Forecast, by Application 2020 & 2033
- Table 51: Nordics 800v High Voltage Platform Revenue (million) Forecast, by Application 2020 & 2033
- Table 52: Nordics 800v High Voltage Platform Volume (K) Forecast, by Application 2020 & 2033
- Table 53: Rest of Europe 800v High Voltage Platform Revenue (million) Forecast, by Application 2020 & 2033
- Table 54: Rest of Europe 800v High Voltage Platform Volume (K) Forecast, by Application 2020 & 2033
- Table 55: Global 800v High Voltage Platform Revenue million Forecast, by Application 2020 & 2033
- Table 56: Global 800v High Voltage Platform Volume K Forecast, by Application 2020 & 2033
- Table 57: Global 800v High Voltage Platform Revenue million Forecast, by Type 2020 & 2033
- Table 58: Global 800v High Voltage Platform Volume K Forecast, by Type 2020 & 2033
- Table 59: Global 800v High Voltage Platform Revenue million Forecast, by Country 2020 & 2033
- Table 60: Global 800v High Voltage Platform Volume K Forecast, by Country 2020 & 2033
- Table 61: Turkey 800v High Voltage Platform Revenue (million) Forecast, by Application 2020 & 2033
- Table 62: Turkey 800v High Voltage Platform Volume (K) Forecast, by Application 2020 & 2033
- Table 63: Israel 800v High Voltage Platform Revenue (million) Forecast, by Application 2020 & 2033
- Table 64: Israel 800v High Voltage Platform Volume (K) Forecast, by Application 2020 & 2033
- Table 65: GCC 800v High Voltage Platform Revenue (million) Forecast, by Application 2020 & 2033
- Table 66: GCC 800v High Voltage Platform Volume (K) Forecast, by Application 2020 & 2033
- Table 67: North Africa 800v High Voltage Platform Revenue (million) Forecast, by Application 2020 & 2033
- Table 68: North Africa 800v High Voltage Platform Volume (K) Forecast, by Application 2020 & 2033
- Table 69: South Africa 800v High Voltage Platform Revenue (million) Forecast, by Application 2020 & 2033
- Table 70: South Africa 800v High Voltage Platform Volume (K) Forecast, by Application 2020 & 2033
- Table 71: Rest of Middle East & Africa 800v High Voltage Platform Revenue (million) Forecast, by Application 2020 & 2033
- Table 72: Rest of Middle East & Africa 800v High Voltage Platform Volume (K) Forecast, by Application 2020 & 2033
- Table 73: Global 800v High Voltage Platform Revenue million Forecast, by Application 2020 & 2033
- Table 74: Global 800v High Voltage Platform Volume K Forecast, by Application 2020 & 2033
- Table 75: Global 800v High Voltage Platform Revenue million Forecast, by Type 2020 & 2033
- Table 76: Global 800v High Voltage Platform Volume K Forecast, by Type 2020 & 2033
- Table 77: Global 800v High Voltage Platform Revenue million Forecast, by Country 2020 & 2033
- Table 78: Global 800v High Voltage Platform Volume K Forecast, by Country 2020 & 2033
- Table 79: China 800v High Voltage Platform Revenue (million) Forecast, by Application 2020 & 2033
- Table 80: China 800v High Voltage Platform Volume (K) Forecast, by Application 2020 & 2033
- Table 81: India 800v High Voltage Platform Revenue (million) Forecast, by Application 2020 & 2033
- Table 82: India 800v High Voltage Platform Volume (K) Forecast, by Application 2020 & 2033
- Table 83: Japan 800v High Voltage Platform Revenue (million) Forecast, by Application 2020 & 2033
- Table 84: Japan 800v High Voltage Platform Volume (K) Forecast, by Application 2020 & 2033
- Table 85: South Korea 800v High Voltage Platform Revenue (million) Forecast, by Application 2020 & 2033
- Table 86: South Korea 800v High Voltage Platform Volume (K) Forecast, by Application 2020 & 2033
- Table 87: ASEAN 800v High Voltage Platform Revenue (million) Forecast, by Application 2020 & 2033
- Table 88: ASEAN 800v High Voltage Platform Volume (K) Forecast, by Application 2020 & 2033
- Table 89: Oceania 800v High Voltage Platform Revenue (million) Forecast, by Application 2020 & 2033
- Table 90: Oceania 800v High Voltage Platform Volume (K) Forecast, by Application 2020 & 2033
- Table 91: Rest of Asia Pacific 800v High Voltage Platform Revenue (million) Forecast, by Application 2020 & 2033
- Table 92: Rest of Asia Pacific 800v High Voltage Platform Volume (K) Forecast, by Application 2020 & 2033
Frequently Asked Questions
1. What is the projected Compound Annual Growth Rate (CAGR) of the 800v High Voltage Platform?
The projected CAGR is approximately XXX%.
2. Which companies are prominent players in the 800v High Voltage Platform?
Key companies in the market include Huawei, Farasis Energy, Vitesco Technologies, ZF, BorgWarner, AVL, Voyah, Xpeng, Porsche, Hyundai, Volkswagen Group, Mercedes-Benz, BYD Company, Geely.
3. What are the main segments of the 800v High Voltage Platform?
The market segments include Application, Type.
4. Can you provide details about the market size?
The market size is estimated to be USD XXX million as of 2022.
5. What are some drivers contributing to market growth?
N/A
6. What are the notable trends driving market growth?
N/A
7. Are there any restraints impacting market growth?
N/A
8. Can you provide examples of recent developments in the market?
N/A
9. What pricing options are available for accessing the report?
Pricing options include single-user, multi-user, and enterprise licenses priced at USD 3950.00, USD 5925.00, and USD 7900.00 respectively.
10. Is the market size provided in terms of value or volume?
The market size is provided in terms of value, measured in million and volume, measured in K.
11. Are there any specific market keywords associated with the report?
Yes, the market keyword associated with the report is "800v High Voltage Platform," which aids in identifying and referencing the specific market segment covered.
12. How do I determine which pricing option suits my needs best?
The pricing options vary based on user requirements and access needs. Individual users may opt for single-user licenses, while businesses requiring broader access may choose multi-user or enterprise licenses for cost-effective access to the report.
13. Are there any additional resources or data provided in the 800v High Voltage Platform report?
While the report offers comprehensive insights, it's advisable to review the specific contents or supplementary materials provided to ascertain if additional resources or data are available.
14. How can I stay updated on further developments or reports in the 800v High Voltage Platform?
To stay informed about further developments, trends, and reports in the 800v High Voltage Platform, consider subscribing to industry newsletters, following relevant companies and organizations, or regularly checking reputable industry news sources and publications.
Methodology
Step 1 - Identification of Relevant Samples Size from Population Database


Step 2 - Approaches for Defining Global Market Size (Value, Volume* & Price*)

Note*: In applicable scenarios
Step 3 - Data Sources
Primary Research
- Web Analytics
- Survey Reports
- Research Institute
- Latest Research Reports
- Opinion Leaders
Secondary Research
- Annual Reports
- White Paper
- Latest Press Release
- Industry Association
- Paid Database
- Investor Presentations

Step 4 - Data Triangulation
Involves using different sources of information in order to increase the validity of a study
These sources are likely to be stakeholders in a program - participants, other researchers, program staff, other community members, and so on.
Then we put all data in single framework & apply various statistical tools to find out the dynamic on the market.
During the analysis stage, feedback from the stakeholder groups would be compared to determine areas of agreement as well as areas of divergence