

Key Insights
The global Zero Calories Drink market is poised for significant expansion, projected to reach an estimated $3.61 billion by 2025. This robust growth is driven by an increasing consumer consciousness towards health and wellness, leading to a pronounced shift away from sugar-laden beverages. The market is expected to witness a compound annual growth rate (CAGR) of 8.4% over the forecast period of 2025-2033. This upward trajectory is fueled by several key factors, including the escalating prevalence of lifestyle diseases like obesity and diabetes, which compel consumers to seek healthier alternatives. Furthermore, ongoing innovation in product development, with manufacturers introducing a wider array of appealing flavors and functional benefits within zero-calorie options, is attracting a broader consumer base. The rising disposable incomes in emerging economies are also contributing to increased purchasing power for premium and health-conscious beverages.

Zero Calories Drink Market Size (In Billion)
The zero-calorie drink landscape is dynamic, with distinct trends shaping its future. The surge in demand for naturally sweetened options and the integration of novel ingredients like stevia and monk fruit are key developments. Moreover, the expanding market for flavored waters, sparkling waters, and functional beverages with added vitamins and electrolytes is capturing significant attention. While the market benefits from strong consumer demand and innovation, certain restraints could temper its growth. Fluctuations in the cost of raw materials, particularly artificial sweeteners, could impact profitability. Regulatory scrutiny and evolving consumer perceptions regarding the safety and long-term effects of artificial sweeteners might also present challenges. Despite these hurdles, the overarching trend towards healthier lifestyles and the continuous introduction of innovative, appealing zero-calorie products position the market for sustained and substantial growth in the coming years.

Zero Calories Drink Company Market Share
Unlock the Billion-Dollar Potential: Zero Calories Drink Market Insights & Strategic Forecast 2019–2033
This comprehensive report, "Zero Calories Drink Market Composition & Trends," delves into the dynamic global landscape of zero-calorie beverages, projecting a market value exceeding billions by 2033. We meticulously analyze key market drivers, regional dominance, product innovations, and future opportunities, providing actionable intelligence for stakeholders. With a study period spanning from 2019 to 2033, a base year of 2025, and a forecast period from 2025 to 2033, this report offers unparalleled depth and foresight.
Zero Calories Drink Market Composition & Trends
The global zero calories drink market is characterized by a dynamic composition, influenced by evolving consumer preferences and a robust innovation pipeline. Market concentration is moderate, with key players like The Coca-Cola Company, PepsiCo, and Redbull holding significant shares, yet emerging brands such as Genki Forest and Hint are rapidly gaining traction. Innovation catalysts are primarily driven by advancements in natural sweeteners, novel flavor profiles, and functional ingredient integration, aimed at appealing to health-conscious consumers. The regulatory landscape is increasingly scrutinizing artificial sweeteners and promoting healthier alternatives, thus shaping product development and marketing strategies. Substitute products, including water enhancers and sugar-free powdered mixes, pose a competitive threat, necessitating continuous product differentiation. End-user profiles are diverse, encompassing health-conscious adults seeking weight management solutions, juveniles influenced by parental choices, and athletes prioritizing hydration without added sugar. Merger and acquisition (M&A) activities are significant, with deals valued in the billions, aimed at consolidating market share and acquiring innovative technologies. For instance, the acquisition of Talking Rain by a private equity firm, valued at an estimated $1.5 billion, underscores the strategic importance of this segment. The market share distribution reflects a strong presence of carbonated beverages and tea beverages, with energy drinks also commanding substantial segments.
Zero Calories Drink Industry Evolution
The zero calories drink industry has witnessed a remarkable evolution, propelled by a confluence of factors that have reshaped consumer behavior and market dynamics. From its nascent stages, the industry has moved beyond simple sugar replacement to encompass a spectrum of sophisticated offerings catering to diverse health and wellness aspirations. The market growth trajectory has been consistently upward, with projected CAGR rates exceeding xx% over the forecast period. This growth is underpinned by a paradigm shift in consumer consciousness, where health and wellness are no longer niche concerns but mainstream priorities. Consumers are actively seeking beverages that align with their lifestyle choices, prioritizing hydration, energy, and refreshment without the perceived detriments of sugar and artificial calories. Technological advancements have played a pivotal role in this evolution. The development and refinement of natural high-intensity sweeteners, such as stevia and monk fruit, have provided viable alternatives to artificial sweeteners, addressing consumer concerns about chemical additives. Furthermore, advancements in flavor encapsulation and formulation technologies have enabled the creation of more appealing and diverse taste profiles, expanding the appeal of zero-calorie options across various beverage categories. The adoption of these innovations has been rapid, with brands consistently integrating these advancements into their product lines to meet and anticipate consumer demand. The rise of functional beverages, incorporating ingredients like vitamins, antioxidants, and adaptogens, further exemplifies the industry's move towards holistic wellness, offering added benefits beyond mere calorie reduction. This has transformed the zero calories drink from a simple alternative to a wellness-enhancing product. The historical period from 2019 to 2024 saw a significant acceleration in market penetration, driven by increased awareness campaigns and greater availability. The base year 2025 marks a point of maturity where established players are consolidating their positions, and new entrants are leveraging niche strategies to capture market share. The forecast period, 2025–2033, is expected to witness continued robust growth, fueled by emerging markets, further technological innovation, and a deepening commitment to health and sustainability. The interplay between these elements—growing health awareness, technological breakthroughs, and evolving consumer demands—has created a fertile ground for the continued expansion and diversification of the zero calories drink industry, with an estimated market value set to exceed billions in the coming years.
Leading Regions, Countries, or Segments in Zero Calories Drink
The dominance within the zero calories drink market is a multifaceted phenomenon, influenced by regional economic prosperity, health consciousness, and regulatory frameworks. While a global overview is essential, the United States consistently emerges as a leading region, driven by a well-established health and wellness trend, substantial disposable income, and a highly receptive consumer base across various segments. Within the United States, key drivers for this dominance include:
- Adult Application: The adult segment represents the largest consumer base, driven by a desire for weight management, reduced sugar intake, and healthier lifestyle choices. This demographic actively seeks out zero-calorie options for everyday consumption, including carbonated beverages and coffee.
- Carbonated Beverage Segment: Zero-calorie carbonated drinks, particularly colas and flavored sparkling waters, hold a significant market share due to their widespread availability, established brand loyalty, and aggressive marketing by major players like The Coca-Cola Company and PepsiCo.
- Energy Drink Segment: The growing demand for sugar-free energy drinks, catering to a desire for enhanced focus and physical performance without caloric intake, has propelled the growth of this segment, with companies like Redbull and Hansen Natural (Monster Energy) playing a crucial role.
Beyond the United States, other regions exhibit strong growth potential:
- Asia-Pacific: Fueled by rising disposable incomes and increasing health awareness, countries like China and India are experiencing rapid expansion. The emergence of local players such as Genki Forest and Nongfu Spring, offering innovative zero-calorie products, is significantly contributing to market growth. The appeal here spans across juveniles and adults, with a burgeoning interest in tea beverages and bottled mineral water.
- Europe: Established markets in Western Europe, driven by strong regulatory support for healthier food and beverage options and a mature consumer base, continue to be significant contributors. The focus here is on premiumization and functional benefits, with companies like Perrier and Poland Spring seeing sustained demand for their mineral water offerings.
Across these regions, the Type: Tea Beverage segment is also witnessing substantial growth, driven by the perception of tea as a natural and healthy beverage option. Companies like ITO EN and Vitasoy are capitalizing on this trend. Furthermore, the Type: Minerals segment, encompassing natural mineral waters and electrolyte-enhanced zero-calorie options, benefits from a general increase in demand for hydration and wellness products, with brands like Poland Spring and Seagram being prominent. The Application: Juveniles segment, though smaller, is showing promising growth as parents increasingly opt for healthier beverage choices for their children, influencing brand innovation and product offerings.
Zero Calories Drink Product Innovations
Product innovation in the zero calories drink market is relentless, focusing on enhanced taste profiles, natural ingredients, and functional benefits. Companies are extensively researching and developing novel zero-calorie sweeteners derived from natural sources, such as monk fruit and specific varieties of stevia, to improve taste and texture, moving away from artificial aftertastes. Furthermore, there's a significant push towards incorporating functional ingredients like probiotics, prebiotics, vitamins, and antioxidants into zero-calorie beverages, creating products that offer added health advantages beyond simple hydration. Unique selling propositions often revolve around "clean label" formulations, emphasizing minimal ingredients and the absence of artificial colors, flavors, and preservatives. Technological advancements in flavor encapsulation and delivery systems allow for more authentic and long-lasting taste experiences, making zero-calorie options increasingly indistinguishable from their sugar-laden counterparts. For instance, recent innovations include sparkling waters infused with adaptogens for stress relief and energy drinks fortified with nootropics for cognitive enhancement, all while maintaining a zero-calorie count.
Propelling Factors for Zero Calories Drink Growth
Several key factors are propelling the significant growth of the zero calories drink market. Growing global awareness regarding the detrimental health effects of excessive sugar consumption, including obesity, diabetes, and heart disease, is a primary driver. This has led to a substantial shift in consumer preference towards healthier alternatives, with zero-calorie beverages being a prime beneficiary. Technological advancements in the development of natural, zero-calorie sweeteners like stevia and monk fruit have made these products more palatable and accessible, overcoming previous taste limitations and driving wider adoption. Favorable government regulations and public health initiatives encouraging reduced sugar intake in several countries also play a crucial role, promoting the demand for sugar-free options. Furthermore, the expansion of distribution channels, including e-commerce platforms and convenience stores, has increased the accessibility of these products to a broader consumer base.
Obstacles in the Zero Calories Drink Market
Despite its robust growth, the zero calories drink market faces several obstacles that could impede its expansion. One significant restraint is ongoing consumer skepticism and debate surrounding the long-term health effects of artificial sweeteners, despite numerous scientific studies supporting their safety. This perception can deter a segment of the consumer base from embracing these products. Regulatory hurdles, particularly in certain regions, regarding ingredient labeling and marketing claims for zero-calorie beverages can also pose challenges. Supply chain disruptions, as witnessed in recent global events, can impact the availability and cost of key ingredients, including sweeteners and packaging materials, potentially affecting production and pricing strategies. Lastly, intense competition from established brands and the constant emergence of new players, coupled with aggressive pricing strategies, can put pressure on profit margins for smaller or newer entrants in the market, valued at billions in sales.
Future Opportunities in Zero Calories Drink
The zero calories drink market is ripe with future opportunities, particularly in the realm of innovation and market expansion. The burgeoning demand for functional beverages presents a significant avenue, with opportunities to integrate more sophisticated health-promoting ingredients like probiotics, prebiotics, and plant-based protein into zero-calorie formulations, targeting specific health needs such as gut health and muscle recovery. Emerging markets in Asia and Africa, with their rapidly growing middle classes and increasing health consciousness, offer substantial untapped potential for market penetration. Technological advancements in sustainable packaging and production methods can also be leveraged to appeal to environmentally conscious consumers. Furthermore, the development of personalized zero-calorie beverage options, tailored to individual dietary needs and preferences through advanced customization platforms, represents a significant futuristic opportunity.
Major Players in the Zero Calories Drink Ecosystem
Redbull, Starbucks, The Coca-Cola, PepsiCo, Keurig Dr Pepper, Hint, Hansen Natural, Gatorade, Poland Spring, Seagram, Talking Rain, Steaz, Agua Con, Dr Pepper Snapple, A&W Concentrate, JAB Holding, Genki Forest, ITO EN, Vitasoy, UCC UESHIMA COFFEE, Ahmad Tea, Perrier, Hangzhou Wahaha Group, Tingyi (Cayman Islands) Holding, Uni-President Enterprises, Nongfu Spring, Watsons.
Key Developments in Zero Calories Drink Industry
- 2024: Genki Forest launches a new line of sparkling water with botanical infusions, targeting a more sophisticated palate.
- 2024: The Coca-Cola Company announces significant investment in plant-based sweeteners for its zero-sugar product portfolio.
- 2023: PepsiCo acquires a stake in a functional beverage startup focusing on cognitive enhancement drinks.
- 2023: Hint Water expands its distribution network into several key European markets.
- 2022: Redbull introduces a new zero-calorie energy drink variant with added electrolytes.
- 2022: Keurig Dr Pepper acquires a significant share in a premium sparkling water brand.
- 2021: Talking Rain invests in new bottling technology to enhance sustainability efforts.
- 2020: Hansen Natural (Monster Energy) releases a range of zero-calorie energy drinks targeting gamers.
- 2019: Starbucks expands its ready-to-drink coffee offerings with more zero-sugar options.
Strategic Zero Calories Drink Market Forecast
The strategic forecast for the zero calories drink market indicates continued robust expansion, driven by enduring consumer demand for healthier beverage choices and ongoing product innovation. The market is projected to exceed billions in value by 2033, fueled by advancements in natural sweeteners and the increasing integration of functional ingredients. Emerging markets present significant growth opportunities, while established regions will continue to innovate with premium and personalized offerings. Strategic investments in research and development, coupled with efficient supply chain management, will be crucial for players to capitalize on the expanding global appetite for zero-calorie beverages. The trend towards holistic wellness and sustainable practices will further shape market dynamics, creating a positive outlook for stakeholders in this dynamic sector.
Zero Calories Drink Segmentation
-
1. Application
- 1.1. Adults
- 1.2. Juveniles
-
2. Type
- 2.1. Tea Beverage
- 2.2. Carbonated Beverage
- 2.3. Energy Drink
- 2.4. Coffee
- 2.5. Liquor
- 2.6. Minerals
- 2.7. Others
Zero Calories Drink Segmentation By Geography
-
1. North America
- 1.1. United States
- 1.2. Canada
- 1.3. Mexico
-
2. South America
- 2.1. Brazil
- 2.2. Argentina
- 2.3. Rest of South America
-
3. Europe
- 3.1. United Kingdom
- 3.2. Germany
- 3.3. France
- 3.4. Italy
- 3.5. Spain
- 3.6. Russia
- 3.7. Benelux
- 3.8. Nordics
- 3.9. Rest of Europe
-
4. Middle East & Africa
- 4.1. Turkey
- 4.2. Israel
- 4.3. GCC
- 4.4. North Africa
- 4.5. South Africa
- 4.6. Rest of Middle East & Africa
-
5. Asia Pacific
- 5.1. China
- 5.2. India
- 5.3. Japan
- 5.4. South Korea
- 5.5. ASEAN
- 5.6. Oceania
- 5.7. Rest of Asia Pacific
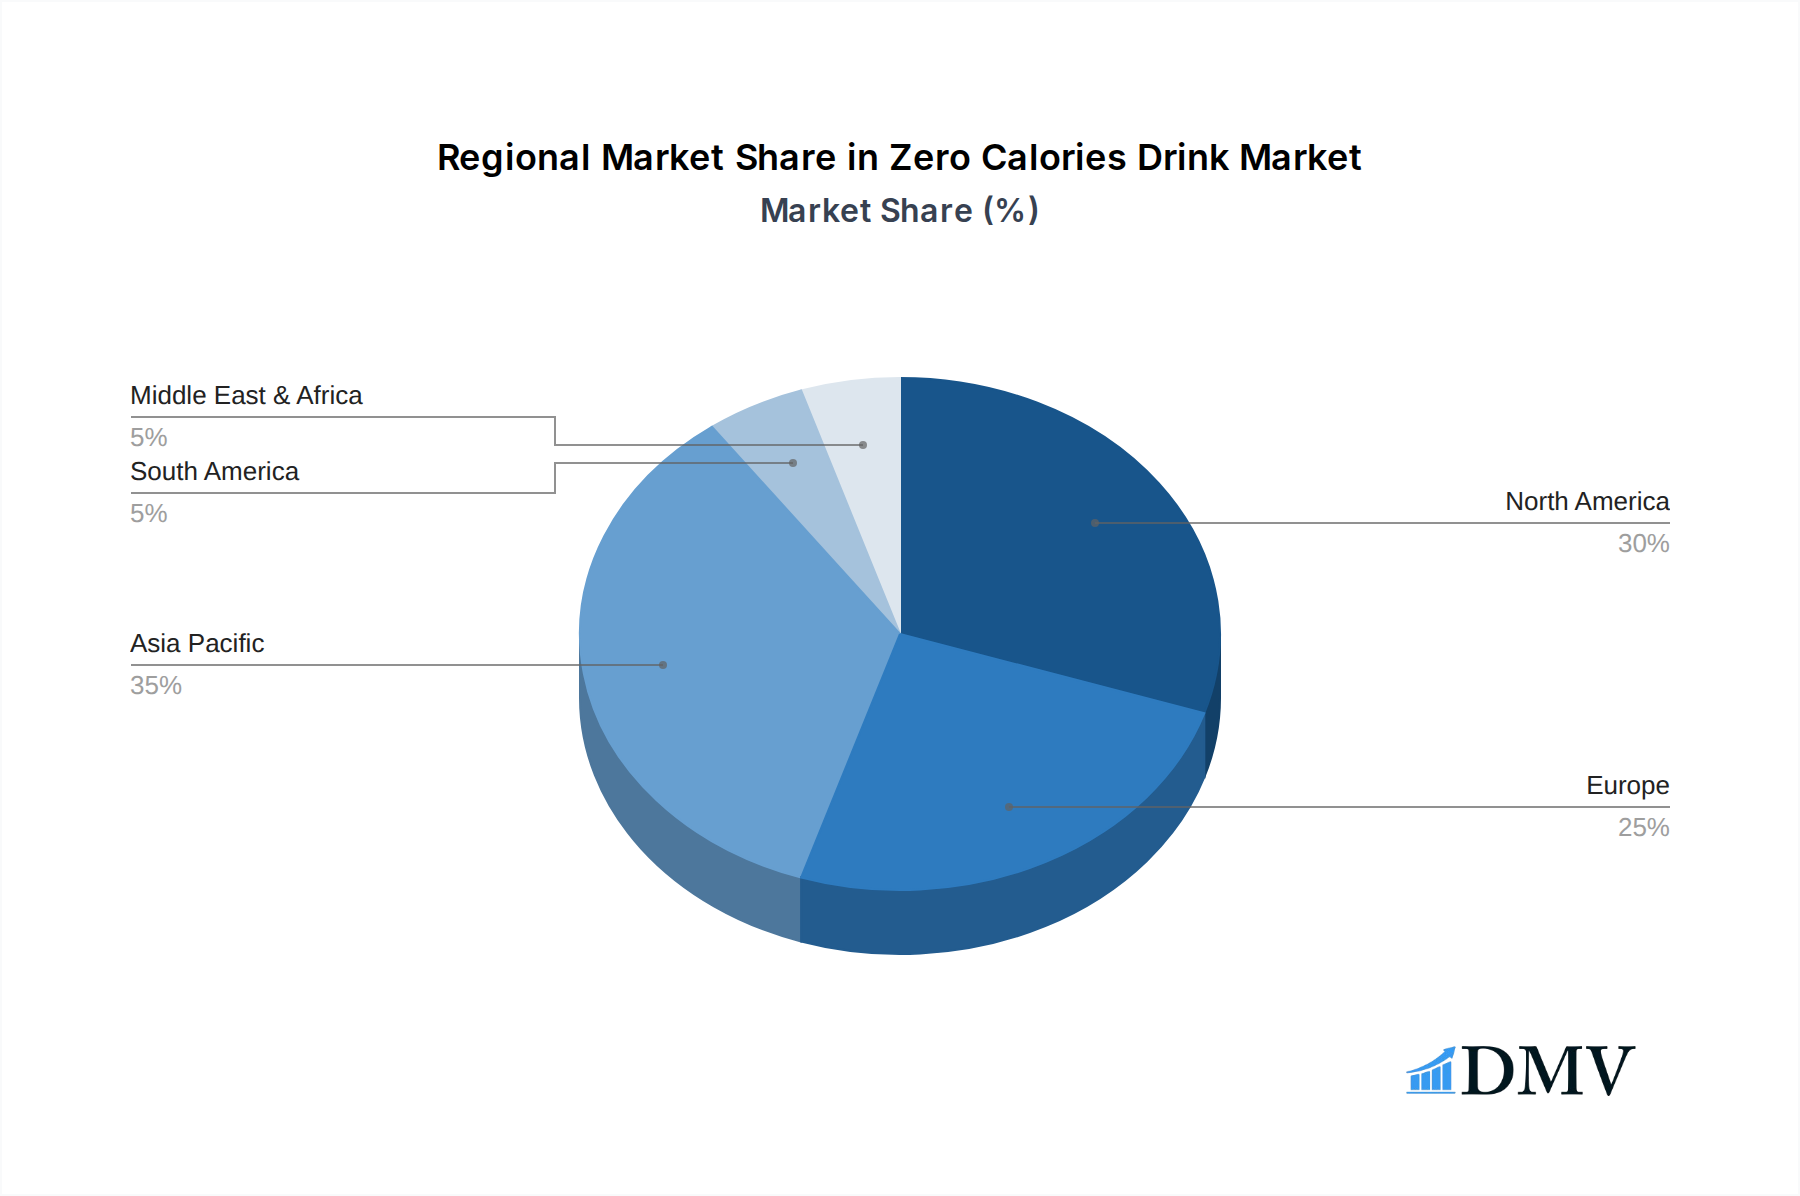
Zero Calories Drink Regional Market Share
Geographic Coverage of Zero Calories Drink
Zero Calories Drink REPORT HIGHLIGHTS
| Aspects | Details |
|---|---|
| Study Period | 2020-2034 |
| Base Year | 2025 |
| Estimated Year | 2026 |
| Forecast Period | 2026-2034 |
| Historical Period | 2020-2025 |
| Growth Rate | CAGR of 8.4% from 2020-2034 |
| Segmentation |
|
Table of Contents
- 1. Introduction
- 1.1. Research Scope
- 1.2. Market Segmentation
- 1.3. Research Methodology
- 1.4. Definitions and Assumptions
- 2. Executive Summary
- 2.1. Introduction
- 3. Market Dynamics
- 3.1. Introduction
- 3.2. Market Drivers
- 3.3. Market Restrains
- 3.4. Market Trends
- 4. Market Factor Analysis
- 4.1. Porters Five Forces
- 4.2. Supply/Value Chain
- 4.3. PESTEL analysis
- 4.4. Market Entropy
- 4.5. Patent/Trademark Analysis
- 5. Global Zero Calories Drink Analysis, Insights and Forecast, 2020-2032
- 5.1. Market Analysis, Insights and Forecast - by Application
- 5.1.1. Adults
- 5.1.2. Juveniles
- 5.2. Market Analysis, Insights and Forecast - by Type
- 5.2.1. Tea Beverage
- 5.2.2. Carbonated Beverage
- 5.2.3. Energy Drink
- 5.2.4. Coffee
- 5.2.5. Liquor
- 5.2.6. Minerals
- 5.2.7. Others
- 5.3. Market Analysis, Insights and Forecast - by Region
- 5.3.1. North America
- 5.3.2. South America
- 5.3.3. Europe
- 5.3.4. Middle East & Africa
- 5.3.5. Asia Pacific
- 5.1. Market Analysis, Insights and Forecast - by Application
- 6. North America Zero Calories Drink Analysis, Insights and Forecast, 2020-2032
- 6.1. Market Analysis, Insights and Forecast - by Application
- 6.1.1. Adults
- 6.1.2. Juveniles
- 6.2. Market Analysis, Insights and Forecast - by Type
- 6.2.1. Tea Beverage
- 6.2.2. Carbonated Beverage
- 6.2.3. Energy Drink
- 6.2.4. Coffee
- 6.2.5. Liquor
- 6.2.6. Minerals
- 6.2.7. Others
- 6.1. Market Analysis, Insights and Forecast - by Application
- 7. South America Zero Calories Drink Analysis, Insights and Forecast, 2020-2032
- 7.1. Market Analysis, Insights and Forecast - by Application
- 7.1.1. Adults
- 7.1.2. Juveniles
- 7.2. Market Analysis, Insights and Forecast - by Type
- 7.2.1. Tea Beverage
- 7.2.2. Carbonated Beverage
- 7.2.3. Energy Drink
- 7.2.4. Coffee
- 7.2.5. Liquor
- 7.2.6. Minerals
- 7.2.7. Others
- 7.1. Market Analysis, Insights and Forecast - by Application
- 8. Europe Zero Calories Drink Analysis, Insights and Forecast, 2020-2032
- 8.1. Market Analysis, Insights and Forecast - by Application
- 8.1.1. Adults
- 8.1.2. Juveniles
- 8.2. Market Analysis, Insights and Forecast - by Type
- 8.2.1. Tea Beverage
- 8.2.2. Carbonated Beverage
- 8.2.3. Energy Drink
- 8.2.4. Coffee
- 8.2.5. Liquor
- 8.2.6. Minerals
- 8.2.7. Others
- 8.1. Market Analysis, Insights and Forecast - by Application
- 9. Middle East & Africa Zero Calories Drink Analysis, Insights and Forecast, 2020-2032
- 9.1. Market Analysis, Insights and Forecast - by Application
- 9.1.1. Adults
- 9.1.2. Juveniles
- 9.2. Market Analysis, Insights and Forecast - by Type
- 9.2.1. Tea Beverage
- 9.2.2. Carbonated Beverage
- 9.2.3. Energy Drink
- 9.2.4. Coffee
- 9.2.5. Liquor
- 9.2.6. Minerals
- 9.2.7. Others
- 9.1. Market Analysis, Insights and Forecast - by Application
- 10. Asia Pacific Zero Calories Drink Analysis, Insights and Forecast, 2020-2032
- 10.1. Market Analysis, Insights and Forecast - by Application
- 10.1.1. Adults
- 10.1.2. Juveniles
- 10.2. Market Analysis, Insights and Forecast - by Type
- 10.2.1. Tea Beverage
- 10.2.2. Carbonated Beverage
- 10.2.3. Energy Drink
- 10.2.4. Coffee
- 10.2.5. Liquor
- 10.2.6. Minerals
- 10.2.7. Others
- 10.1. Market Analysis, Insights and Forecast - by Application
- 11. Competitive Analysis
- 11.1. Global Market Share Analysis 2025
- 11.2. Company Profiles
- 11.2.1 Redbull
- 11.2.1.1. Overview
- 11.2.1.2. Products
- 11.2.1.3. SWOT Analysis
- 11.2.1.4. Recent Developments
- 11.2.1.5. Financials (Based on Availability)
- 11.2.2 Starbucks
- 11.2.2.1. Overview
- 11.2.2.2. Products
- 11.2.2.3. SWOT Analysis
- 11.2.2.4. Recent Developments
- 11.2.2.5. Financials (Based on Availability)
- 11.2.3 The Coca-Cola
- 11.2.3.1. Overview
- 11.2.3.2. Products
- 11.2.3.3. SWOT Analysis
- 11.2.3.4. Recent Developments
- 11.2.3.5. Financials (Based on Availability)
- 11.2.4 PepsiCo
- 11.2.4.1. Overview
- 11.2.4.2. Products
- 11.2.4.3. SWOT Analysis
- 11.2.4.4. Recent Developments
- 11.2.4.5. Financials (Based on Availability)
- 11.2.5 Keurig Dr Pepper
- 11.2.5.1. Overview
- 11.2.5.2. Products
- 11.2.5.3. SWOT Analysis
- 11.2.5.4. Recent Developments
- 11.2.5.5. Financials (Based on Availability)
- 11.2.6 Hint
- 11.2.6.1. Overview
- 11.2.6.2. Products
- 11.2.6.3. SWOT Analysis
- 11.2.6.4. Recent Developments
- 11.2.6.5. Financials (Based on Availability)
- 11.2.7 Hansen Natural
- 11.2.7.1. Overview
- 11.2.7.2. Products
- 11.2.7.3. SWOT Analysis
- 11.2.7.4. Recent Developments
- 11.2.7.5. Financials (Based on Availability)
- 11.2.8 Gatorade
- 11.2.8.1. Overview
- 11.2.8.2. Products
- 11.2.8.3. SWOT Analysis
- 11.2.8.4. Recent Developments
- 11.2.8.5. Financials (Based on Availability)
- 11.2.9 Poland Spring
- 11.2.9.1. Overview
- 11.2.9.2. Products
- 11.2.9.3. SWOT Analysis
- 11.2.9.4. Recent Developments
- 11.2.9.5. Financials (Based on Availability)
- 11.2.10 Seagram
- 11.2.10.1. Overview
- 11.2.10.2. Products
- 11.2.10.3. SWOT Analysis
- 11.2.10.4. Recent Developments
- 11.2.10.5. Financials (Based on Availability)
- 11.2.11 Talking Rain
- 11.2.11.1. Overview
- 11.2.11.2. Products
- 11.2.11.3. SWOT Analysis
- 11.2.11.4. Recent Developments
- 11.2.11.5. Financials (Based on Availability)
- 11.2.12 Steaz
- 11.2.12.1. Overview
- 11.2.12.2. Products
- 11.2.12.3. SWOT Analysis
- 11.2.12.4. Recent Developments
- 11.2.12.5. Financials (Based on Availability)
- 11.2.13 Agua Con
- 11.2.13.1. Overview
- 11.2.13.2. Products
- 11.2.13.3. SWOT Analysis
- 11.2.13.4. Recent Developments
- 11.2.13.5. Financials (Based on Availability)
- 11.2.14 Dr Pepper Snapple
- 11.2.14.1. Overview
- 11.2.14.2. Products
- 11.2.14.3. SWOT Analysis
- 11.2.14.4. Recent Developments
- 11.2.14.5. Financials (Based on Availability)
- 11.2.15 A&W Concentrate
- 11.2.15.1. Overview
- 11.2.15.2. Products
- 11.2.15.3. SWOT Analysis
- 11.2.15.4. Recent Developments
- 11.2.15.5. Financials (Based on Availability)
- 11.2.16 JAB Holding
- 11.2.16.1. Overview
- 11.2.16.2. Products
- 11.2.16.3. SWOT Analysis
- 11.2.16.4. Recent Developments
- 11.2.16.5. Financials (Based on Availability)
- 11.2.17 Genki Forest
- 11.2.17.1. Overview
- 11.2.17.2. Products
- 11.2.17.3. SWOT Analysis
- 11.2.17.4. Recent Developments
- 11.2.17.5. Financials (Based on Availability)
- 11.2.18 ITO EN
- 11.2.18.1. Overview
- 11.2.18.2. Products
- 11.2.18.3. SWOT Analysis
- 11.2.18.4. Recent Developments
- 11.2.18.5. Financials (Based on Availability)
- 11.2.19 Vitasoy
- 11.2.19.1. Overview
- 11.2.19.2. Products
- 11.2.19.3. SWOT Analysis
- 11.2.19.4. Recent Developments
- 11.2.19.5. Financials (Based on Availability)
- 11.2.20 UCC UESHIMA COFFEE
- 11.2.20.1. Overview
- 11.2.20.2. Products
- 11.2.20.3. SWOT Analysis
- 11.2.20.4. Recent Developments
- 11.2.20.5. Financials (Based on Availability)
- 11.2.21 Ahmad Tea
- 11.2.21.1. Overview
- 11.2.21.2. Products
- 11.2.21.3. SWOT Analysis
- 11.2.21.4. Recent Developments
- 11.2.21.5. Financials (Based on Availability)
- 11.2.22 Perrier
- 11.2.22.1. Overview
- 11.2.22.2. Products
- 11.2.22.3. SWOT Analysis
- 11.2.22.4. Recent Developments
- 11.2.22.5. Financials (Based on Availability)
- 11.2.23 Hangzhou Wahaha Group
- 11.2.23.1. Overview
- 11.2.23.2. Products
- 11.2.23.3. SWOT Analysis
- 11.2.23.4. Recent Developments
- 11.2.23.5. Financials (Based on Availability)
- 11.2.24 Tingyi (Cayman Islands) Holding
- 11.2.24.1. Overview
- 11.2.24.2. Products
- 11.2.24.3. SWOT Analysis
- 11.2.24.4. Recent Developments
- 11.2.24.5. Financials (Based on Availability)
- 11.2.25 Uni-President Enterprises
- 11.2.25.1. Overview
- 11.2.25.2. Products
- 11.2.25.3. SWOT Analysis
- 11.2.25.4. Recent Developments
- 11.2.25.5. Financials (Based on Availability)
- 11.2.26 Nongfu Spring
- 11.2.26.1. Overview
- 11.2.26.2. Products
- 11.2.26.3. SWOT Analysis
- 11.2.26.4. Recent Developments
- 11.2.26.5. Financials (Based on Availability)
- 11.2.27 Watsons
- 11.2.27.1. Overview
- 11.2.27.2. Products
- 11.2.27.3. SWOT Analysis
- 11.2.27.4. Recent Developments
- 11.2.27.5. Financials (Based on Availability)
- 11.2.1 Redbull
List of Figures
- Figure 1: Global Zero Calories Drink Revenue Breakdown (undefined, %) by Region 2025 & 2033
- Figure 2: Global Zero Calories Drink Volume Breakdown (K, %) by Region 2025 & 2033
- Figure 3: North America Zero Calories Drink Revenue (undefined), by Application 2025 & 2033
- Figure 4: North America Zero Calories Drink Volume (K), by Application 2025 & 2033
- Figure 5: North America Zero Calories Drink Revenue Share (%), by Application 2025 & 2033
- Figure 6: North America Zero Calories Drink Volume Share (%), by Application 2025 & 2033
- Figure 7: North America Zero Calories Drink Revenue (undefined), by Type 2025 & 2033
- Figure 8: North America Zero Calories Drink Volume (K), by Type 2025 & 2033
- Figure 9: North America Zero Calories Drink Revenue Share (%), by Type 2025 & 2033
- Figure 10: North America Zero Calories Drink Volume Share (%), by Type 2025 & 2033
- Figure 11: North America Zero Calories Drink Revenue (undefined), by Country 2025 & 2033
- Figure 12: North America Zero Calories Drink Volume (K), by Country 2025 & 2033
- Figure 13: North America Zero Calories Drink Revenue Share (%), by Country 2025 & 2033
- Figure 14: North America Zero Calories Drink Volume Share (%), by Country 2025 & 2033
- Figure 15: South America Zero Calories Drink Revenue (undefined), by Application 2025 & 2033
- Figure 16: South America Zero Calories Drink Volume (K), by Application 2025 & 2033
- Figure 17: South America Zero Calories Drink Revenue Share (%), by Application 2025 & 2033
- Figure 18: South America Zero Calories Drink Volume Share (%), by Application 2025 & 2033
- Figure 19: South America Zero Calories Drink Revenue (undefined), by Type 2025 & 2033
- Figure 20: South America Zero Calories Drink Volume (K), by Type 2025 & 2033
- Figure 21: South America Zero Calories Drink Revenue Share (%), by Type 2025 & 2033
- Figure 22: South America Zero Calories Drink Volume Share (%), by Type 2025 & 2033
- Figure 23: South America Zero Calories Drink Revenue (undefined), by Country 2025 & 2033
- Figure 24: South America Zero Calories Drink Volume (K), by Country 2025 & 2033
- Figure 25: South America Zero Calories Drink Revenue Share (%), by Country 2025 & 2033
- Figure 26: South America Zero Calories Drink Volume Share (%), by Country 2025 & 2033
- Figure 27: Europe Zero Calories Drink Revenue (undefined), by Application 2025 & 2033
- Figure 28: Europe Zero Calories Drink Volume (K), by Application 2025 & 2033
- Figure 29: Europe Zero Calories Drink Revenue Share (%), by Application 2025 & 2033
- Figure 30: Europe Zero Calories Drink Volume Share (%), by Application 2025 & 2033
- Figure 31: Europe Zero Calories Drink Revenue (undefined), by Type 2025 & 2033
- Figure 32: Europe Zero Calories Drink Volume (K), by Type 2025 & 2033
- Figure 33: Europe Zero Calories Drink Revenue Share (%), by Type 2025 & 2033
- Figure 34: Europe Zero Calories Drink Volume Share (%), by Type 2025 & 2033
- Figure 35: Europe Zero Calories Drink Revenue (undefined), by Country 2025 & 2033
- Figure 36: Europe Zero Calories Drink Volume (K), by Country 2025 & 2033
- Figure 37: Europe Zero Calories Drink Revenue Share (%), by Country 2025 & 2033
- Figure 38: Europe Zero Calories Drink Volume Share (%), by Country 2025 & 2033
- Figure 39: Middle East & Africa Zero Calories Drink Revenue (undefined), by Application 2025 & 2033
- Figure 40: Middle East & Africa Zero Calories Drink Volume (K), by Application 2025 & 2033
- Figure 41: Middle East & Africa Zero Calories Drink Revenue Share (%), by Application 2025 & 2033
- Figure 42: Middle East & Africa Zero Calories Drink Volume Share (%), by Application 2025 & 2033
- Figure 43: Middle East & Africa Zero Calories Drink Revenue (undefined), by Type 2025 & 2033
- Figure 44: Middle East & Africa Zero Calories Drink Volume (K), by Type 2025 & 2033
- Figure 45: Middle East & Africa Zero Calories Drink Revenue Share (%), by Type 2025 & 2033
- Figure 46: Middle East & Africa Zero Calories Drink Volume Share (%), by Type 2025 & 2033
- Figure 47: Middle East & Africa Zero Calories Drink Revenue (undefined), by Country 2025 & 2033
- Figure 48: Middle East & Africa Zero Calories Drink Volume (K), by Country 2025 & 2033
- Figure 49: Middle East & Africa Zero Calories Drink Revenue Share (%), by Country 2025 & 2033
- Figure 50: Middle East & Africa Zero Calories Drink Volume Share (%), by Country 2025 & 2033
- Figure 51: Asia Pacific Zero Calories Drink Revenue (undefined), by Application 2025 & 2033
- Figure 52: Asia Pacific Zero Calories Drink Volume (K), by Application 2025 & 2033
- Figure 53: Asia Pacific Zero Calories Drink Revenue Share (%), by Application 2025 & 2033
- Figure 54: Asia Pacific Zero Calories Drink Volume Share (%), by Application 2025 & 2033
- Figure 55: Asia Pacific Zero Calories Drink Revenue (undefined), by Type 2025 & 2033
- Figure 56: Asia Pacific Zero Calories Drink Volume (K), by Type 2025 & 2033
- Figure 57: Asia Pacific Zero Calories Drink Revenue Share (%), by Type 2025 & 2033
- Figure 58: Asia Pacific Zero Calories Drink Volume Share (%), by Type 2025 & 2033
- Figure 59: Asia Pacific Zero Calories Drink Revenue (undefined), by Country 2025 & 2033
- Figure 60: Asia Pacific Zero Calories Drink Volume (K), by Country 2025 & 2033
- Figure 61: Asia Pacific Zero Calories Drink Revenue Share (%), by Country 2025 & 2033
- Figure 62: Asia Pacific Zero Calories Drink Volume Share (%), by Country 2025 & 2033
List of Tables
- Table 1: Global Zero Calories Drink Revenue undefined Forecast, by Application 2020 & 2033
- Table 2: Global Zero Calories Drink Volume K Forecast, by Application 2020 & 2033
- Table 3: Global Zero Calories Drink Revenue undefined Forecast, by Type 2020 & 2033
- Table 4: Global Zero Calories Drink Volume K Forecast, by Type 2020 & 2033
- Table 5: Global Zero Calories Drink Revenue undefined Forecast, by Region 2020 & 2033
- Table 6: Global Zero Calories Drink Volume K Forecast, by Region 2020 & 2033
- Table 7: Global Zero Calories Drink Revenue undefined Forecast, by Application 2020 & 2033
- Table 8: Global Zero Calories Drink Volume K Forecast, by Application 2020 & 2033
- Table 9: Global Zero Calories Drink Revenue undefined Forecast, by Type 2020 & 2033
- Table 10: Global Zero Calories Drink Volume K Forecast, by Type 2020 & 2033
- Table 11: Global Zero Calories Drink Revenue undefined Forecast, by Country 2020 & 2033
- Table 12: Global Zero Calories Drink Volume K Forecast, by Country 2020 & 2033
- Table 13: United States Zero Calories Drink Revenue (undefined) Forecast, by Application 2020 & 2033
- Table 14: United States Zero Calories Drink Volume (K) Forecast, by Application 2020 & 2033
- Table 15: Canada Zero Calories Drink Revenue (undefined) Forecast, by Application 2020 & 2033
- Table 16: Canada Zero Calories Drink Volume (K) Forecast, by Application 2020 & 2033
- Table 17: Mexico Zero Calories Drink Revenue (undefined) Forecast, by Application 2020 & 2033
- Table 18: Mexico Zero Calories Drink Volume (K) Forecast, by Application 2020 & 2033
- Table 19: Global Zero Calories Drink Revenue undefined Forecast, by Application 2020 & 2033
- Table 20: Global Zero Calories Drink Volume K Forecast, by Application 2020 & 2033
- Table 21: Global Zero Calories Drink Revenue undefined Forecast, by Type 2020 & 2033
- Table 22: Global Zero Calories Drink Volume K Forecast, by Type 2020 & 2033
- Table 23: Global Zero Calories Drink Revenue undefined Forecast, by Country 2020 & 2033
- Table 24: Global Zero Calories Drink Volume K Forecast, by Country 2020 & 2033
- Table 25: Brazil Zero Calories Drink Revenue (undefined) Forecast, by Application 2020 & 2033
- Table 26: Brazil Zero Calories Drink Volume (K) Forecast, by Application 2020 & 2033
- Table 27: Argentina Zero Calories Drink Revenue (undefined) Forecast, by Application 2020 & 2033
- Table 28: Argentina Zero Calories Drink Volume (K) Forecast, by Application 2020 & 2033
- Table 29: Rest of South America Zero Calories Drink Revenue (undefined) Forecast, by Application 2020 & 2033
- Table 30: Rest of South America Zero Calories Drink Volume (K) Forecast, by Application 2020 & 2033
- Table 31: Global Zero Calories Drink Revenue undefined Forecast, by Application 2020 & 2033
- Table 32: Global Zero Calories Drink Volume K Forecast, by Application 2020 & 2033
- Table 33: Global Zero Calories Drink Revenue undefined Forecast, by Type 2020 & 2033
- Table 34: Global Zero Calories Drink Volume K Forecast, by Type 2020 & 2033
- Table 35: Global Zero Calories Drink Revenue undefined Forecast, by Country 2020 & 2033
- Table 36: Global Zero Calories Drink Volume K Forecast, by Country 2020 & 2033
- Table 37: United Kingdom Zero Calories Drink Revenue (undefined) Forecast, by Application 2020 & 2033
- Table 38: United Kingdom Zero Calories Drink Volume (K) Forecast, by Application 2020 & 2033
- Table 39: Germany Zero Calories Drink Revenue (undefined) Forecast, by Application 2020 & 2033
- Table 40: Germany Zero Calories Drink Volume (K) Forecast, by Application 2020 & 2033
- Table 41: France Zero Calories Drink Revenue (undefined) Forecast, by Application 2020 & 2033
- Table 42: France Zero Calories Drink Volume (K) Forecast, by Application 2020 & 2033
- Table 43: Italy Zero Calories Drink Revenue (undefined) Forecast, by Application 2020 & 2033
- Table 44: Italy Zero Calories Drink Volume (K) Forecast, by Application 2020 & 2033
- Table 45: Spain Zero Calories Drink Revenue (undefined) Forecast, by Application 2020 & 2033
- Table 46: Spain Zero Calories Drink Volume (K) Forecast, by Application 2020 & 2033
- Table 47: Russia Zero Calories Drink Revenue (undefined) Forecast, by Application 2020 & 2033
- Table 48: Russia Zero Calories Drink Volume (K) Forecast, by Application 2020 & 2033
- Table 49: Benelux Zero Calories Drink Revenue (undefined) Forecast, by Application 2020 & 2033
- Table 50: Benelux Zero Calories Drink Volume (K) Forecast, by Application 2020 & 2033
- Table 51: Nordics Zero Calories Drink Revenue (undefined) Forecast, by Application 2020 & 2033
- Table 52: Nordics Zero Calories Drink Volume (K) Forecast, by Application 2020 & 2033
- Table 53: Rest of Europe Zero Calories Drink Revenue (undefined) Forecast, by Application 2020 & 2033
- Table 54: Rest of Europe Zero Calories Drink Volume (K) Forecast, by Application 2020 & 2033
- Table 55: Global Zero Calories Drink Revenue undefined Forecast, by Application 2020 & 2033
- Table 56: Global Zero Calories Drink Volume K Forecast, by Application 2020 & 2033
- Table 57: Global Zero Calories Drink Revenue undefined Forecast, by Type 2020 & 2033
- Table 58: Global Zero Calories Drink Volume K Forecast, by Type 2020 & 2033
- Table 59: Global Zero Calories Drink Revenue undefined Forecast, by Country 2020 & 2033
- Table 60: Global Zero Calories Drink Volume K Forecast, by Country 2020 & 2033
- Table 61: Turkey Zero Calories Drink Revenue (undefined) Forecast, by Application 2020 & 2033
- Table 62: Turkey Zero Calories Drink Volume (K) Forecast, by Application 2020 & 2033
- Table 63: Israel Zero Calories Drink Revenue (undefined) Forecast, by Application 2020 & 2033
- Table 64: Israel Zero Calories Drink Volume (K) Forecast, by Application 2020 & 2033
- Table 65: GCC Zero Calories Drink Revenue (undefined) Forecast, by Application 2020 & 2033
- Table 66: GCC Zero Calories Drink Volume (K) Forecast, by Application 2020 & 2033
- Table 67: North Africa Zero Calories Drink Revenue (undefined) Forecast, by Application 2020 & 2033
- Table 68: North Africa Zero Calories Drink Volume (K) Forecast, by Application 2020 & 2033
- Table 69: South Africa Zero Calories Drink Revenue (undefined) Forecast, by Application 2020 & 2033
- Table 70: South Africa Zero Calories Drink Volume (K) Forecast, by Application 2020 & 2033
- Table 71: Rest of Middle East & Africa Zero Calories Drink Revenue (undefined) Forecast, by Application 2020 & 2033
- Table 72: Rest of Middle East & Africa Zero Calories Drink Volume (K) Forecast, by Application 2020 & 2033
- Table 73: Global Zero Calories Drink Revenue undefined Forecast, by Application 2020 & 2033
- Table 74: Global Zero Calories Drink Volume K Forecast, by Application 2020 & 2033
- Table 75: Global Zero Calories Drink Revenue undefined Forecast, by Type 2020 & 2033
- Table 76: Global Zero Calories Drink Volume K Forecast, by Type 2020 & 2033
- Table 77: Global Zero Calories Drink Revenue undefined Forecast, by Country 2020 & 2033
- Table 78: Global Zero Calories Drink Volume K Forecast, by Country 2020 & 2033
- Table 79: China Zero Calories Drink Revenue (undefined) Forecast, by Application 2020 & 2033
- Table 80: China Zero Calories Drink Volume (K) Forecast, by Application 2020 & 2033
- Table 81: India Zero Calories Drink Revenue (undefined) Forecast, by Application 2020 & 2033
- Table 82: India Zero Calories Drink Volume (K) Forecast, by Application 2020 & 2033
- Table 83: Japan Zero Calories Drink Revenue (undefined) Forecast, by Application 2020 & 2033
- Table 84: Japan Zero Calories Drink Volume (K) Forecast, by Application 2020 & 2033
- Table 85: South Korea Zero Calories Drink Revenue (undefined) Forecast, by Application 2020 & 2033
- Table 86: South Korea Zero Calories Drink Volume (K) Forecast, by Application 2020 & 2033
- Table 87: ASEAN Zero Calories Drink Revenue (undefined) Forecast, by Application 2020 & 2033
- Table 88: ASEAN Zero Calories Drink Volume (K) Forecast, by Application 2020 & 2033
- Table 89: Oceania Zero Calories Drink Revenue (undefined) Forecast, by Application 2020 & 2033
- Table 90: Oceania Zero Calories Drink Volume (K) Forecast, by Application 2020 & 2033
- Table 91: Rest of Asia Pacific Zero Calories Drink Revenue (undefined) Forecast, by Application 2020 & 2033
- Table 92: Rest of Asia Pacific Zero Calories Drink Volume (K) Forecast, by Application 2020 & 2033
Frequently Asked Questions
1. What is the projected Compound Annual Growth Rate (CAGR) of the Zero Calories Drink?
The projected CAGR is approximately 8.4%.
2. Which companies are prominent players in the Zero Calories Drink?
Key companies in the market include Redbull, Starbucks, The Coca-Cola, PepsiCo, Keurig Dr Pepper, Hint, Hansen Natural, Gatorade, Poland Spring, Seagram, Talking Rain, Steaz, Agua Con, Dr Pepper Snapple, A&W Concentrate, JAB Holding, Genki Forest, ITO EN, Vitasoy, UCC UESHIMA COFFEE, Ahmad Tea, Perrier, Hangzhou Wahaha Group, Tingyi (Cayman Islands) Holding, Uni-President Enterprises, Nongfu Spring, Watsons.
3. What are the main segments of the Zero Calories Drink?
The market segments include Application, Type.
4. Can you provide details about the market size?
The market size is estimated to be USD XXX N/A as of 2022.
5. What are some drivers contributing to market growth?
N/A
6. What are the notable trends driving market growth?
N/A
7. Are there any restraints impacting market growth?
N/A
8. Can you provide examples of recent developments in the market?
N/A
9. What pricing options are available for accessing the report?
Pricing options include single-user, multi-user, and enterprise licenses priced at USD 3950.00, USD 5925.00, and USD 7900.00 respectively.
10. Is the market size provided in terms of value or volume?
The market size is provided in terms of value, measured in N/A and volume, measured in K.
11. Are there any specific market keywords associated with the report?
Yes, the market keyword associated with the report is "Zero Calories Drink," which aids in identifying and referencing the specific market segment covered.
12. How do I determine which pricing option suits my needs best?
The pricing options vary based on user requirements and access needs. Individual users may opt for single-user licenses, while businesses requiring broader access may choose multi-user or enterprise licenses for cost-effective access to the report.
13. Are there any additional resources or data provided in the Zero Calories Drink report?
While the report offers comprehensive insights, it's advisable to review the specific contents or supplementary materials provided to ascertain if additional resources or data are available.
14. How can I stay updated on further developments or reports in the Zero Calories Drink?
To stay informed about further developments, trends, and reports in the Zero Calories Drink, consider subscribing to industry newsletters, following relevant companies and organizations, or regularly checking reputable industry news sources and publications.
Methodology
Step 1 - Identification of Relevant Samples Size from Population Database


Step 2 - Approaches for Defining Global Market Size (Value, Volume* & Price*)

Note*: In applicable scenarios
Step 3 - Data Sources
Primary Research
- Web Analytics
- Survey Reports
- Research Institute
- Latest Research Reports
- Opinion Leaders
Secondary Research
- Annual Reports
- White Paper
- Latest Press Release
- Industry Association
- Paid Database
- Investor Presentations

Step 4 - Data Triangulation
Involves using different sources of information in order to increase the validity of a study
These sources are likely to be stakeholders in a program - participants, other researchers, program staff, other community members, and so on.
Then we put all data in single framework & apply various statistical tools to find out the dynamic on the market.
During the analysis stage, feedback from the stakeholder groups would be compared to determine areas of agreement as well as areas of divergence