

Key Insights
The global turbine air filtration market, valued at approximately $2.09 billion in 2025, is projected to experience robust expansion at a compound annual growth rate (CAGR) of 3.73% from 2025 to 2033. This growth is predominantly fueled by the escalating demand for cleaner energy, particularly in power generation. Increasingly stringent environmental regulations worldwide are compelling power plants to adopt advanced filtration solutions to reduce emissions and enhance operational efficiency. The expansion of the oil and gas sector, coupled with the critical need for improved safety and equipment durability in challenging environments, also significantly contributes to market growth. Technological innovations in filtration media, including HEPA and ULPA filters, are further driving the market by offering superior filtration performance and extended service life. However, substantial initial investment costs for advanced filtration systems and potential increases in maintenance expenses may present market restraints. Power generation holds the dominant share among applications, while high-velocity filtration systems lead the face velocity segment due to their efficacy in high-pressure scenarios. Leading market participants such as Daikin Industries Ltd., Donaldson Company Inc., and MANN+HUMMEL GmbH are prioritizing research and development to introduce innovative and more efficient filtration solutions, addressing industry demands and reinforcing their competitive positions. Geographically, North America and Europe currently lead the market, with the Asia-Pacific region expected to witness substantial growth driven by rapid industrialization and infrastructure development.
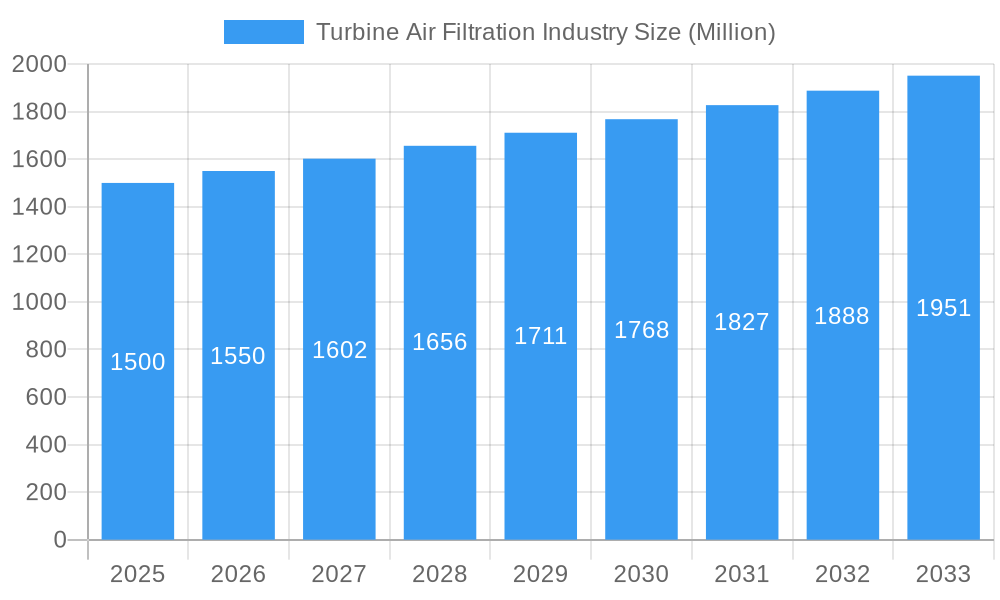
Turbine Air Filtration Industry Market Size (In Billion)
The market's sustained expansion is anticipated throughout the forecast period, underpinned by ongoing investments in renewable energy infrastructure and growing recognition of the environmental and economic advantages of efficient air filtration. While economic volatility and potential supply chain disruptions may pose challenges, the long-term outlook for the turbine air filtration market remains optimistic. The market is characterized by intense competition among established firms and emerging companies focused on innovation, strategic alliances, and global expansion. Future market developments are likely to include further consolidation as companies aim to broaden their product offerings and extend their international presence. Moreover, the persistent drive towards sustainability and environmental compliance will continue to be a primary catalyst for market growth, stimulating the development of more eco-friendly and energy-efficient filtration technologies.
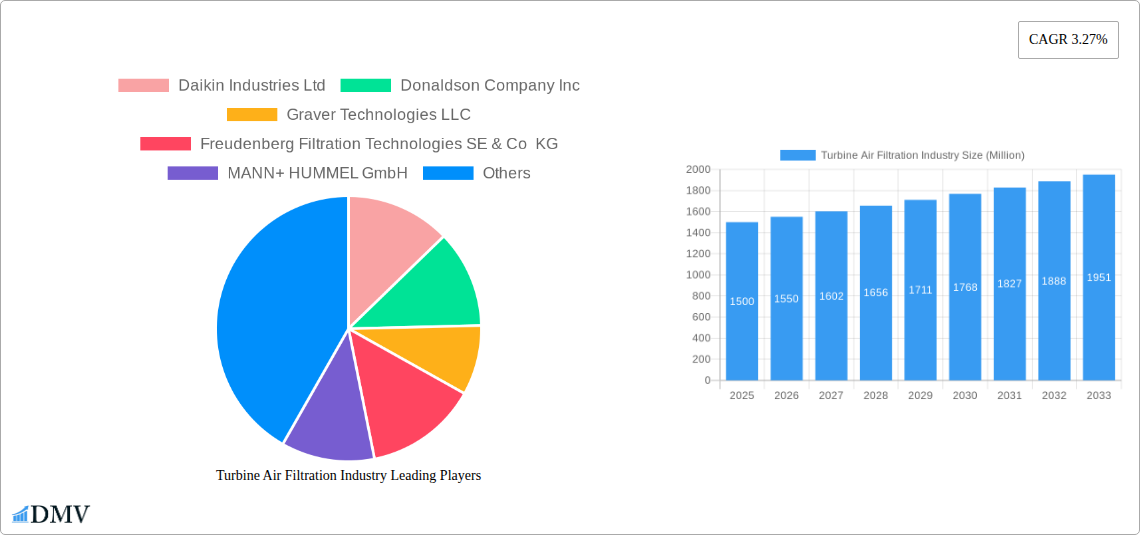
Turbine Air Filtration Industry Company Market Share
Turbine Air Filtration Industry Market Report: 2019-2033
This comprehensive report provides an in-depth analysis of the global turbine air filtration industry, offering invaluable insights for stakeholders seeking to navigate this dynamic market. With a detailed study period spanning 2019-2033, a base year of 2025, and a forecast period extending to 2033, this report leverages extensive data and expert analysis to provide a clear picture of current market dynamics and future growth trajectories. The market is valued at $XX Million in 2025 and is projected to reach $XX Million by 2033, exhibiting a robust CAGR.
Turbine Air Filtration Industry Market Composition & Trends
This section delves into the intricate composition of the turbine air filtration market, encompassing market concentration, innovation drivers, regulatory landscapes, substitute product analysis, end-user profiles, and mergers & acquisitions (M&A) activities. Key players like Daikin Industries Ltd, Donaldson Company Inc, and Parker Hannifin Corporation shape the competitive landscape, with market share distribution varying across segments.
- Market Concentration: The market exhibits a moderately consolidated structure with the top 5 players holding approximately XX% of the market share in 2025.
- Innovation Catalysts: Advancements in filtration technologies, including nanomaterials and smart sensors, are driving innovation. Stringent emission regulations are also pushing technological improvements.
- Regulatory Landscape: Government regulations concerning air quality and emission standards significantly impact market growth, varying across regions.
- Substitute Products: Limited viable substitutes exist, reinforcing the market's growth potential.
- End-User Profiles: Power generation, oil & gas, and other industrial sectors are the primary end-users.
- M&A Activities: Significant M&A activity, with deal values exceeding $XX Million in the past five years, reflects market consolidation and strategic expansion. Examples include [Insert specific M&A examples if available, otherwise state "Further detailed M&A information is available within the full report"].
Turbine Air Filtration Industry Industry Evolution
The turbine air filtration industry is a dynamic sector experiencing significant evolution driven by a confluence of robust market expansion, rapid technological innovation, and evolving customer demands. Over the historical period (2019-2024), the market demonstrated a strong Compound Annual Growth Rate (CAGR) of XX%. This growth trajectory was primarily propelled by factors such as the escalating pace of industrialization across key global regions, the implementation of increasingly stringent emission control regulations designed to mitigate air pollution, and a sustained surge in demand from critical sectors including power generation, oil and gas, and manufacturing.
Technological advancements have been instrumental in redefining the industry's capabilities. Notably, the integration of High-Efficiency Particulate Air (HEPA) filtration technologies and sophisticated membrane-based systems has led to a dramatic improvement in filtration efficiency, offering superior particulate capture while simultaneously reducing operational and maintenance expenditures. In parallel, a growing global consciousness surrounding environmental sustainability and a concerted push towards greener industrial practices are increasingly shaping consumer preferences. This shift is creating a heightened demand for filtration solutions that are not only highly effective but also environmentally responsible and eco-friendly.
Looking ahead, the market is poised for continued substantial growth throughout the forecast period (2025-2033). This optimistic outlook is underpinned by several key drivers. The expanding industrial base in emerging economies, coupled with proactive government initiatives promoting the adoption of cleaner energy sources and more sustainable industrial processes, will serve as significant catalysts. Furthermore, ongoing technological breakthroughs, particularly in the development of smart filtration systems and advanced material science, are expected to further propel market expansion. The rate of adoption for these cutting-edge filtration technologies is on an upward trend, projected to increase from XX% in 2025 to an anticipated XX% by 2033. Detailed quantitative data on growth rates, adoption metrics for diverse filtration technologies, and market segmentation are comprehensively elaborated within the complete industry report.
Leading Regions, Countries, or Segments in Turbine Air Filtration Industry
This section identifies the dominant regions, countries, and segments within the turbine air filtration market.
Dominant Segments:
- Application: Power generation currently holds the largest market share, driven by stringent emission regulations and increasing power generation capacity. The Oil and Gas sector is also a significant contributor.
- Face Velocity: Medium velocity filters currently dominate due to their balance of efficiency and cost-effectiveness.
Key Drivers:
- Power Generation: Growing demand for electricity and the implementation of stricter emission regulations are key drivers in this segment. Significant investments in renewable energy sources are further stimulating growth.
- Oil & Gas: Expanding exploration and production activities coupled with environmental regulations are boosting demand for efficient filtration systems.
- High Velocity Filters: Increased adoption is expected, driven by the need for higher filtration efficiency in specialized applications.
The North American region currently leads the market, followed by Europe and Asia Pacific. Detailed country-specific analysis and market share distribution are presented in the full report.
Turbine Air Filtration Industry Product Innovations
Recent product innovations in the turbine air filtration sector are sharply focused on elevating filter performance through enhanced efficiency, extended durability, and optimized maintenance protocols. The integration of advanced materials, such as next-generation nanofiber filter media, and the development of sophisticated self-cleaning mechanisms are at the forefront of these advancements, promising superior operational performance and extended service life. A paramount emphasis is placed on developing sustainable and cost-effective filtration solutions meticulously tailored to meet the unique demands of various industrial applications. These innovations frequently incorporate enhanced media longevity, the integration of remote monitoring and diagnostic capabilities for proactive maintenance, and a significant reduction in energy consumption.
Propelling Factors for Turbine Air Filtration Industry Growth
The Turbine Air Filtration Industry is experiencing robust growth propelled by a confluence of powerful drivers. A primary impetus stems from the global imposition of stringent environmental regulations, which mandate reductions in airborne emissions from industrial operations, particularly from gas turbines. The continuously increasing reliance on gas turbines for efficient power generation and critical industrial processes across diverse sectors further fuels this demand. Technological advancements, including the development of filters with significantly higher efficiency ratings and the implementation of sophisticated real-time monitoring systems, are also playing a pivotal role in propelling market expansion. Moreover, robust economic growth observed in developing nations, coupled with substantial investments in infrastructure development and modernization projects, acts as an additional stimulus for market growth.
Obstacles in the Turbine Air Filtration Industry Market
Despite its strong growth trajectory, the Turbine Air Filtration Industry encounters several significant challenges. Volatility in the prices of essential raw materials and the potential for disruptions within global supply chains can exert considerable pressure on production costs and overall profitability. The intensely competitive landscape, characterized by the presence of well-established market leaders and the continuous emergence of new entrants, often leads to significant pricing pressures within the market. Furthermore, navigating a complex web of regulatory uncertainties and the varying environmental standards adopted across different geographical regions can present substantial hurdles for companies aiming for seamless global expansion.
Future Opportunities in Turbine Air Filtration Industry
Emerging markets in developing economies present significant growth opportunities. The increasing adoption of advanced filtration technologies, such as membrane-based systems and nanofiber filters, offers avenues for innovation. The development of smart filters with integrated monitoring capabilities and predictive maintenance features opens new avenues for market expansion.
Major Players in the Turbine Air Filtration Industry Ecosystem
- Daikin Industries Ltd
- Donaldson Company Inc
- Graver Technologies LLC
- Freudenberg Filtration Technologies SE & Co KG
- MANN+ HUMMEL GmbH
- Koch Filter Corporation
- Camfil AB
- Advanced Filtration Concepts
- W L Gore & Associates Inc
- Parker Hannifin Corporation
- Nordic Air Filtration A/S
Key Developments in Turbine Air Filtration Industry Industry
- June 2021: Camfil Group, a leader in air filtration solutions, announced a substantial expansion of its technical research and development center. This strategic investment underscores the company's commitment to fostering innovation and enhancing its R&D capabilities to meet future industry demands.
- May 2021: Parker Hannifin, a global diversified industrial manufacturer, successfully launched ASSURE, a groundbreaking new line of filtration products. This launch highlights the company's dedication to product innovation and its drive to maintain a competitive edge in the market.
- March 2021: The Transcontinental Gas Pipeline Company's REAE project marked a significant development, signaling increased investment in critical pipeline infrastructure. This expansion is expected to drive a corresponding increase in the demand for specialized filtration systems necessary for the efficient and safe operation of such extensive energy networks.
Strategic Turbine Air Filtration Industry Market Forecast
The turbine air filtration market is poised for significant growth, driven by increasing demand from key sectors, stringent environmental regulations, and technological advancements. The market's future prospects remain positive, with continued growth expected across various regions and segments. The report provides detailed forecasts for market size, segment growth, and key players' performance, offering actionable insights for informed strategic decision-making.
Turbine Air Filtration Industry Segmentation
-
1. Application
- 1.1. Power Generation
- 1.2. Oil and Gas
- 1.3. Others
-
2. Face Velocity
- 2.1. Low Velocity
- 2.2. Medium Velocity
- 2.3. High Velocity
Turbine Air Filtration Industry Segmentation By Geography
- 1. North America
- 2. Europe
- 3. Asia Pacific
- 4. South America
- 5. Middle East and Africa
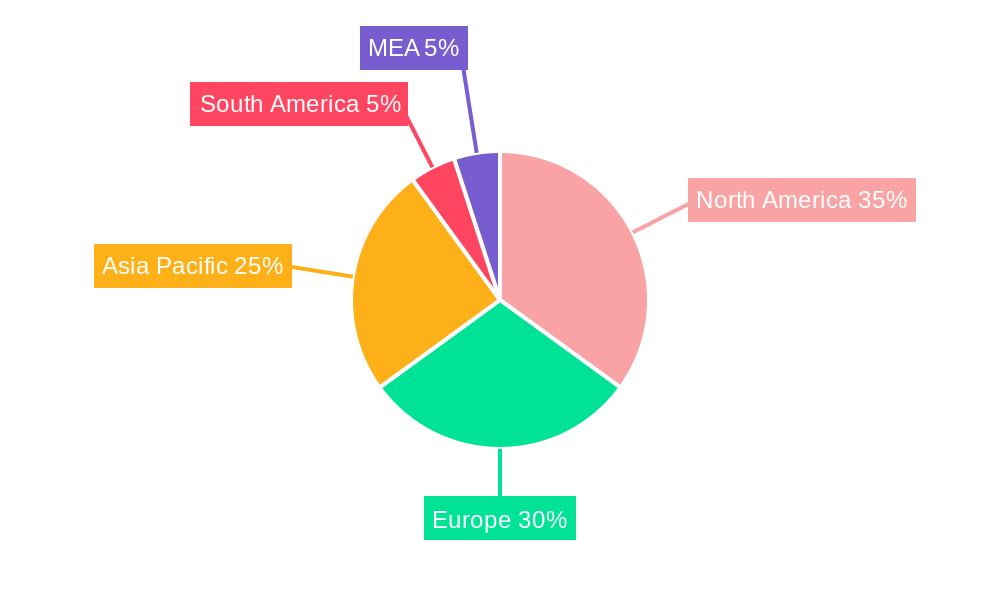
Turbine Air Filtration Industry Regional Market Share
Geographic Coverage of Turbine Air Filtration Industry
Turbine Air Filtration Industry REPORT HIGHLIGHTS
| Aspects | Details |
|---|---|
| Study Period | 2020-2034 |
| Base Year | 2025 |
| Estimated Year | 2026 |
| Forecast Period | 2026-2034 |
| Historical Period | 2020-2025 |
| Growth Rate | CAGR of 3.73% from 2020-2034 |
| Segmentation |
|
Table of Contents
- 1. Introduction
- 1.1. Research Scope
- 1.2. Market Segmentation
- 1.3. Research Objective
- 1.4. Definitions and Assumptions
- 2. Executive Summary
- 2.1. Market Snapshot
- 3. Market Dynamics
- 3.1. Market Drivers
- 3.2. Market Restrains
- 3.3. Market Trends
- 3.4. Market Opportunities
- 4. Market Factor Analysis
- 4.1. Porters Five Forces
- 4.1.1. Bargaining Power of Suppliers
- 4.1.2. Bargaining Power of Buyers
- 4.1.3. Threat of New Entrants
- 4.1.4. Threat of Substitutes
- 4.1.5. Competitive Rivalry
- 4.2. PESTEL analysis
- 4.3. BCG Analysis
- 4.3.1. Stars (High Growth, High Market Share)
- 4.3.2. Cash Cows (Low Growth, High Market Share)
- 4.3.3. Question Mark (High Growth, Low Market Share)
- 4.3.4. Dogs (Low Growth, Low Market Share)
- 4.4. Ansoff Matrix Analysis
- 4.5. Supply Chain Analysis
- 4.6. Regulatory Landscape
- 4.7. Current Market Potential and Opportunity Assessment (TAM–SAM–SOM Framework)
- 4.8. DMV Analyst Note
- 4.1. Porters Five Forces
- 5. Market Analysis, Insights and Forecast 2021-2033
- 5.1. Market Analysis, Insights and Forecast - by Application
- 5.1.1. Power Generation
- 5.1.2. Oil and Gas
- 5.1.3. Others
- 5.2. Market Analysis, Insights and Forecast - by Face Velocity
- 5.2.1. Low Velocity
- 5.2.2. Medium Velocity
- 5.2.3. High Velocity
- 5.3. Market Analysis, Insights and Forecast - by Region
- 5.3.1. North America
- 5.3.2. Europe
- 5.3.3. Asia Pacific
- 5.3.4. South America
- 5.3.5. Middle East and Africa
- 5.1. Market Analysis, Insights and Forecast - by Application
- 6. Global Turbine Air Filtration Industry Analysis, Insights and Forecast, 2021-2033
- 6.1. Market Analysis, Insights and Forecast - by Application
- 6.1.1. Power Generation
- 6.1.2. Oil and Gas
- 6.1.3. Others
- 6.2. Market Analysis, Insights and Forecast - by Face Velocity
- 6.2.1. Low Velocity
- 6.2.2. Medium Velocity
- 6.2.3. High Velocity
- 6.1. Market Analysis, Insights and Forecast - by Application
- 7. North America Turbine Air Filtration Industry Analysis, Insights and Forecast, 2020-2032
- 7.1. Market Analysis, Insights and Forecast - by Application
- 7.1.1. Power Generation
- 7.1.2. Oil and Gas
- 7.1.3. Others
- 7.2. Market Analysis, Insights and Forecast - by Face Velocity
- 7.2.1. Low Velocity
- 7.2.2. Medium Velocity
- 7.2.3. High Velocity
- 7.1. Market Analysis, Insights and Forecast - by Application
- 8. Europe Turbine Air Filtration Industry Analysis, Insights and Forecast, 2020-2032
- 8.1. Market Analysis, Insights and Forecast - by Application
- 8.1.1. Power Generation
- 8.1.2. Oil and Gas
- 8.1.3. Others
- 8.2. Market Analysis, Insights and Forecast - by Face Velocity
- 8.2.1. Low Velocity
- 8.2.2. Medium Velocity
- 8.2.3. High Velocity
- 8.1. Market Analysis, Insights and Forecast - by Application
- 9. Asia Pacific Turbine Air Filtration Industry Analysis, Insights and Forecast, 2020-2032
- 9.1. Market Analysis, Insights and Forecast - by Application
- 9.1.1. Power Generation
- 9.1.2. Oil and Gas
- 9.1.3. Others
- 9.2. Market Analysis, Insights and Forecast - by Face Velocity
- 9.2.1. Low Velocity
- 9.2.2. Medium Velocity
- 9.2.3. High Velocity
- 9.1. Market Analysis, Insights and Forecast - by Application
- 10. South America Turbine Air Filtration Industry Analysis, Insights and Forecast, 2020-2032
- 10.1. Market Analysis, Insights and Forecast - by Application
- 10.1.1. Power Generation
- 10.1.2. Oil and Gas
- 10.1.3. Others
- 10.2. Market Analysis, Insights and Forecast - by Face Velocity
- 10.2.1. Low Velocity
- 10.2.2. Medium Velocity
- 10.2.3. High Velocity
- 10.1. Market Analysis, Insights and Forecast - by Application
- 11. Middle East and Africa Turbine Air Filtration Industry Analysis, Insights and Forecast, 2020-2032
- 11.1. Market Analysis, Insights and Forecast - by Application
- 11.1.1. Power Generation
- 11.1.2. Oil and Gas
- 11.1.3. Others
- 11.2. Market Analysis, Insights and Forecast - by Face Velocity
- 11.2.1. Low Velocity
- 11.2.2. Medium Velocity
- 11.2.3. High Velocity
- 11.1. Market Analysis, Insights and Forecast - by Application
- 12. Competitive Analysis
- 12.1. Company Profiles
- 12.1.1 Daikin Industries Ltd
- 12.1.1.1. Company Overview
- 12.1.1.2. Products
- 12.1.1.3. Company Financials
- 12.1.1.4. SWOT Analysis
- 12.1.2 Donaldson Company Inc
- 12.1.2.1. Company Overview
- 12.1.2.2. Products
- 12.1.2.3. Company Financials
- 12.1.2.4. SWOT Analysis
- 12.1.3 Graver Technologies LLC
- 12.1.3.1. Company Overview
- 12.1.3.2. Products
- 12.1.3.3. Company Financials
- 12.1.3.4. SWOT Analysis
- 12.1.4 Freudenberg Filtration Technologies SE & Co KG
- 12.1.4.1. Company Overview
- 12.1.4.2. Products
- 12.1.4.3. Company Financials
- 12.1.4.4. SWOT Analysis
- 12.1.5 MANN+ HUMMEL GmbH
- 12.1.5.1. Company Overview
- 12.1.5.2. Products
- 12.1.5.3. Company Financials
- 12.1.5.4. SWOT Analysis
- 12.1.6 Koch Filter Corporation
- 12.1.6.1. Company Overview
- 12.1.6.2. Products
- 12.1.6.3. Company Financials
- 12.1.6.4. SWOT Analysis
- 12.1.7 Camfil AB
- 12.1.7.1. Company Overview
- 12.1.7.2. Products
- 12.1.7.3. Company Financials
- 12.1.7.4. SWOT Analysis
- 12.1.8 Advanced Filtration Concepts
- 12.1.8.1. Company Overview
- 12.1.8.2. Products
- 12.1.8.3. Company Financials
- 12.1.8.4. SWOT Analysis
- 12.1.9 W L Gore & Associates Inc *List Not Exhaustive
- 12.1.9.1. Company Overview
- 12.1.9.2. Products
- 12.1.9.3. Company Financials
- 12.1.9.4. SWOT Analysis
- 12.1.10 Parker Hannifin Corporation
- 12.1.10.1. Company Overview
- 12.1.10.2. Products
- 12.1.10.3. Company Financials
- 12.1.10.4. SWOT Analysis
- 12.1.11 Nordic Air Filtration A/S
- 12.1.11.1. Company Overview
- 12.1.11.2. Products
- 12.1.11.3. Company Financials
- 12.1.11.4. SWOT Analysis
- 12.1.1 Daikin Industries Ltd
- 12.2. Market Entropy
- 12.2.1 Company's Key Areas Served
- 12.2.2 Recent Developments
- 12.3. Company Market Share Analysis 2025
- 12.3.1 Top 5 Companies Market Share Analysis
- 12.3.2 Top 3 Companies Market Share Analysis
- 12.4. List of Potential Customers
- 13. Research Methodology
List of Figures
- Figure 1: Global Turbine Air Filtration Industry Revenue Breakdown (billion, %) by Region 2025 & 2033
- Figure 2: Global Turbine Air Filtration Industry Volume Breakdown (K Unit, %) by Region 2025 & 2033
- Figure 3: North America Turbine Air Filtration Industry Revenue (billion), by Application 2025 & 2033
- Figure 4: North America Turbine Air Filtration Industry Volume (K Unit), by Application 2025 & 2033
- Figure 5: North America Turbine Air Filtration Industry Revenue Share (%), by Application 2025 & 2033
- Figure 6: North America Turbine Air Filtration Industry Volume Share (%), by Application 2025 & 2033
- Figure 7: North America Turbine Air Filtration Industry Revenue (billion), by Face Velocity 2025 & 2033
- Figure 8: North America Turbine Air Filtration Industry Volume (K Unit), by Face Velocity 2025 & 2033
- Figure 9: North America Turbine Air Filtration Industry Revenue Share (%), by Face Velocity 2025 & 2033
- Figure 10: North America Turbine Air Filtration Industry Volume Share (%), by Face Velocity 2025 & 2033
- Figure 11: North America Turbine Air Filtration Industry Revenue (billion), by Country 2025 & 2033
- Figure 12: North America Turbine Air Filtration Industry Volume (K Unit), by Country 2025 & 2033
- Figure 13: North America Turbine Air Filtration Industry Revenue Share (%), by Country 2025 & 2033
- Figure 14: North America Turbine Air Filtration Industry Volume Share (%), by Country 2025 & 2033
- Figure 15: Europe Turbine Air Filtration Industry Revenue (billion), by Application 2025 & 2033
- Figure 16: Europe Turbine Air Filtration Industry Volume (K Unit), by Application 2025 & 2033
- Figure 17: Europe Turbine Air Filtration Industry Revenue Share (%), by Application 2025 & 2033
- Figure 18: Europe Turbine Air Filtration Industry Volume Share (%), by Application 2025 & 2033
- Figure 19: Europe Turbine Air Filtration Industry Revenue (billion), by Face Velocity 2025 & 2033
- Figure 20: Europe Turbine Air Filtration Industry Volume (K Unit), by Face Velocity 2025 & 2033
- Figure 21: Europe Turbine Air Filtration Industry Revenue Share (%), by Face Velocity 2025 & 2033
- Figure 22: Europe Turbine Air Filtration Industry Volume Share (%), by Face Velocity 2025 & 2033
- Figure 23: Europe Turbine Air Filtration Industry Revenue (billion), by Country 2025 & 2033
- Figure 24: Europe Turbine Air Filtration Industry Volume (K Unit), by Country 2025 & 2033
- Figure 25: Europe Turbine Air Filtration Industry Revenue Share (%), by Country 2025 & 2033
- Figure 26: Europe Turbine Air Filtration Industry Volume Share (%), by Country 2025 & 2033
- Figure 27: Asia Pacific Turbine Air Filtration Industry Revenue (billion), by Application 2025 & 2033
- Figure 28: Asia Pacific Turbine Air Filtration Industry Volume (K Unit), by Application 2025 & 2033
- Figure 29: Asia Pacific Turbine Air Filtration Industry Revenue Share (%), by Application 2025 & 2033
- Figure 30: Asia Pacific Turbine Air Filtration Industry Volume Share (%), by Application 2025 & 2033
- Figure 31: Asia Pacific Turbine Air Filtration Industry Revenue (billion), by Face Velocity 2025 & 2033
- Figure 32: Asia Pacific Turbine Air Filtration Industry Volume (K Unit), by Face Velocity 2025 & 2033
- Figure 33: Asia Pacific Turbine Air Filtration Industry Revenue Share (%), by Face Velocity 2025 & 2033
- Figure 34: Asia Pacific Turbine Air Filtration Industry Volume Share (%), by Face Velocity 2025 & 2033
- Figure 35: Asia Pacific Turbine Air Filtration Industry Revenue (billion), by Country 2025 & 2033
- Figure 36: Asia Pacific Turbine Air Filtration Industry Volume (K Unit), by Country 2025 & 2033
- Figure 37: Asia Pacific Turbine Air Filtration Industry Revenue Share (%), by Country 2025 & 2033
- Figure 38: Asia Pacific Turbine Air Filtration Industry Volume Share (%), by Country 2025 & 2033
- Figure 39: South America Turbine Air Filtration Industry Revenue (billion), by Application 2025 & 2033
- Figure 40: South America Turbine Air Filtration Industry Volume (K Unit), by Application 2025 & 2033
- Figure 41: South America Turbine Air Filtration Industry Revenue Share (%), by Application 2025 & 2033
- Figure 42: South America Turbine Air Filtration Industry Volume Share (%), by Application 2025 & 2033
- Figure 43: South America Turbine Air Filtration Industry Revenue (billion), by Face Velocity 2025 & 2033
- Figure 44: South America Turbine Air Filtration Industry Volume (K Unit), by Face Velocity 2025 & 2033
- Figure 45: South America Turbine Air Filtration Industry Revenue Share (%), by Face Velocity 2025 & 2033
- Figure 46: South America Turbine Air Filtration Industry Volume Share (%), by Face Velocity 2025 & 2033
- Figure 47: South America Turbine Air Filtration Industry Revenue (billion), by Country 2025 & 2033
- Figure 48: South America Turbine Air Filtration Industry Volume (K Unit), by Country 2025 & 2033
- Figure 49: South America Turbine Air Filtration Industry Revenue Share (%), by Country 2025 & 2033
- Figure 50: South America Turbine Air Filtration Industry Volume Share (%), by Country 2025 & 2033
- Figure 51: Middle East and Africa Turbine Air Filtration Industry Revenue (billion), by Application 2025 & 2033
- Figure 52: Middle East and Africa Turbine Air Filtration Industry Volume (K Unit), by Application 2025 & 2033
- Figure 53: Middle East and Africa Turbine Air Filtration Industry Revenue Share (%), by Application 2025 & 2033
- Figure 54: Middle East and Africa Turbine Air Filtration Industry Volume Share (%), by Application 2025 & 2033
- Figure 55: Middle East and Africa Turbine Air Filtration Industry Revenue (billion), by Face Velocity 2025 & 2033
- Figure 56: Middle East and Africa Turbine Air Filtration Industry Volume (K Unit), by Face Velocity 2025 & 2033
- Figure 57: Middle East and Africa Turbine Air Filtration Industry Revenue Share (%), by Face Velocity 2025 & 2033
- Figure 58: Middle East and Africa Turbine Air Filtration Industry Volume Share (%), by Face Velocity 2025 & 2033
- Figure 59: Middle East and Africa Turbine Air Filtration Industry Revenue (billion), by Country 2025 & 2033
- Figure 60: Middle East and Africa Turbine Air Filtration Industry Volume (K Unit), by Country 2025 & 2033
- Figure 61: Middle East and Africa Turbine Air Filtration Industry Revenue Share (%), by Country 2025 & 2033
- Figure 62: Middle East and Africa Turbine Air Filtration Industry Volume Share (%), by Country 2025 & 2033
List of Tables
- Table 1: Global Turbine Air Filtration Industry Revenue billion Forecast, by Application 2020 & 2033
- Table 2: Global Turbine Air Filtration Industry Volume K Unit Forecast, by Application 2020 & 2033
- Table 3: Global Turbine Air Filtration Industry Revenue billion Forecast, by Face Velocity 2020 & 2033
- Table 4: Global Turbine Air Filtration Industry Volume K Unit Forecast, by Face Velocity 2020 & 2033
- Table 5: Global Turbine Air Filtration Industry Revenue billion Forecast, by Region 2020 & 2033
- Table 6: Global Turbine Air Filtration Industry Volume K Unit Forecast, by Region 2020 & 2033
- Table 7: Global Turbine Air Filtration Industry Revenue billion Forecast, by Application 2020 & 2033
- Table 8: Global Turbine Air Filtration Industry Volume K Unit Forecast, by Application 2020 & 2033
- Table 9: Global Turbine Air Filtration Industry Revenue billion Forecast, by Face Velocity 2020 & 2033
- Table 10: Global Turbine Air Filtration Industry Volume K Unit Forecast, by Face Velocity 2020 & 2033
- Table 11: Global Turbine Air Filtration Industry Revenue billion Forecast, by Country 2020 & 2033
- Table 12: Global Turbine Air Filtration Industry Volume K Unit Forecast, by Country 2020 & 2033
- Table 13: Global Turbine Air Filtration Industry Revenue billion Forecast, by Application 2020 & 2033
- Table 14: Global Turbine Air Filtration Industry Volume K Unit Forecast, by Application 2020 & 2033
- Table 15: Global Turbine Air Filtration Industry Revenue billion Forecast, by Face Velocity 2020 & 2033
- Table 16: Global Turbine Air Filtration Industry Volume K Unit Forecast, by Face Velocity 2020 & 2033
- Table 17: Global Turbine Air Filtration Industry Revenue billion Forecast, by Country 2020 & 2033
- Table 18: Global Turbine Air Filtration Industry Volume K Unit Forecast, by Country 2020 & 2033
- Table 19: Global Turbine Air Filtration Industry Revenue billion Forecast, by Application 2020 & 2033
- Table 20: Global Turbine Air Filtration Industry Volume K Unit Forecast, by Application 2020 & 2033
- Table 21: Global Turbine Air Filtration Industry Revenue billion Forecast, by Face Velocity 2020 & 2033
- Table 22: Global Turbine Air Filtration Industry Volume K Unit Forecast, by Face Velocity 2020 & 2033
- Table 23: Global Turbine Air Filtration Industry Revenue billion Forecast, by Country 2020 & 2033
- Table 24: Global Turbine Air Filtration Industry Volume K Unit Forecast, by Country 2020 & 2033
- Table 25: Global Turbine Air Filtration Industry Revenue billion Forecast, by Application 2020 & 2033
- Table 26: Global Turbine Air Filtration Industry Volume K Unit Forecast, by Application 2020 & 2033
- Table 27: Global Turbine Air Filtration Industry Revenue billion Forecast, by Face Velocity 2020 & 2033
- Table 28: Global Turbine Air Filtration Industry Volume K Unit Forecast, by Face Velocity 2020 & 2033
- Table 29: Global Turbine Air Filtration Industry Revenue billion Forecast, by Country 2020 & 2033
- Table 30: Global Turbine Air Filtration Industry Volume K Unit Forecast, by Country 2020 & 2033
- Table 31: Global Turbine Air Filtration Industry Revenue billion Forecast, by Application 2020 & 2033
- Table 32: Global Turbine Air Filtration Industry Volume K Unit Forecast, by Application 2020 & 2033
- Table 33: Global Turbine Air Filtration Industry Revenue billion Forecast, by Face Velocity 2020 & 2033
- Table 34: Global Turbine Air Filtration Industry Volume K Unit Forecast, by Face Velocity 2020 & 2033
- Table 35: Global Turbine Air Filtration Industry Revenue billion Forecast, by Country 2020 & 2033
- Table 36: Global Turbine Air Filtration Industry Volume K Unit Forecast, by Country 2020 & 2033
Frequently Asked Questions
1. What is the projected Compound Annual Growth Rate (CAGR) of the Turbine Air Filtration Industry?
The projected CAGR is approximately 3.73%.
2. Which companies are prominent players in the Turbine Air Filtration Industry?
Key companies in the market include Daikin Industries Ltd, Donaldson Company Inc, Graver Technologies LLC, Freudenberg Filtration Technologies SE & Co KG, MANN+ HUMMEL GmbH, Koch Filter Corporation, Camfil AB, Advanced Filtration Concepts, W L Gore & Associates Inc *List Not Exhaustive, Parker Hannifin Corporation, Nordic Air Filtration A/S.
3. What are the main segments of the Turbine Air Filtration Industry?
The market segments include Application, Face Velocity.
4. Can you provide details about the market size?
The market size is estimated to be USD 2.09 billion as of 2022.
5. What are some drivers contributing to market growth?
4.; Increasing Number of Automobiles4.; The Government Policy Regarding Pollution Emission Control Parameters.
6. What are the notable trends driving market growth?
Power Generation Segment to Dominate the Market.
7. Are there any restraints impacting market growth?
4.; The Technological Limitations of Air Filters.
8. Can you provide examples of recent developments in the market?
In June 2021, Camfil Group announced the expansion of its state-of-the-art technical research center in Trosa, Sweden, which is expected to be completed by the end of 2021.
9. What pricing options are available for accessing the report?
Pricing options include single-user, multi-user, and enterprise licenses priced at USD 4750, USD 5250, and USD 8750 respectively.
10. Is the market size provided in terms of value or volume?
The market size is provided in terms of value, measured in billion and volume, measured in K Unit.
11. Are there any specific market keywords associated with the report?
Yes, the market keyword associated with the report is "Turbine Air Filtration Industry," which aids in identifying and referencing the specific market segment covered.
12. How do I determine which pricing option suits my needs best?
The pricing options vary based on user requirements and access needs. Individual users may opt for single-user licenses, while businesses requiring broader access may choose multi-user or enterprise licenses for cost-effective access to the report.
13. Are there any additional resources or data provided in the Turbine Air Filtration Industry report?
While the report offers comprehensive insights, it's advisable to review the specific contents or supplementary materials provided to ascertain if additional resources or data are available.
14. How can I stay updated on further developments or reports in the Turbine Air Filtration Industry?
To stay informed about further developments, trends, and reports in the Turbine Air Filtration Industry, consider subscribing to industry newsletters, following relevant companies and organizations, or regularly checking reputable industry news sources and publications.
Methodology
Step 1 - Identification of Relevant Samples Size from Population Database


Step 2 - Approaches for Defining Global Market Size (Value, Volume* & Price*)

Note*: In applicable scenarios
Step 3 - Data Sources
Primary Research
- Web Analytics
- Survey Reports
- Research Institute
- Latest Research Reports
- Opinion Leaders
Secondary Research
- Annual Reports
- White Paper
- Latest Press Release
- Industry Association
- Paid Database
- Investor Presentations

Step 4 - Data Triangulation
Involves using different sources of information in order to increase the validity of a study
These sources are likely to be stakeholders in a program - participants, other researchers, program staff, other community members, and so on.
Then we put all data in single framework & apply various statistical tools to find out the dynamic on the market.
During the analysis stage, feedback from the stakeholder groups would be compared to determine areas of agreement as well as areas of divergence