

Key Insights
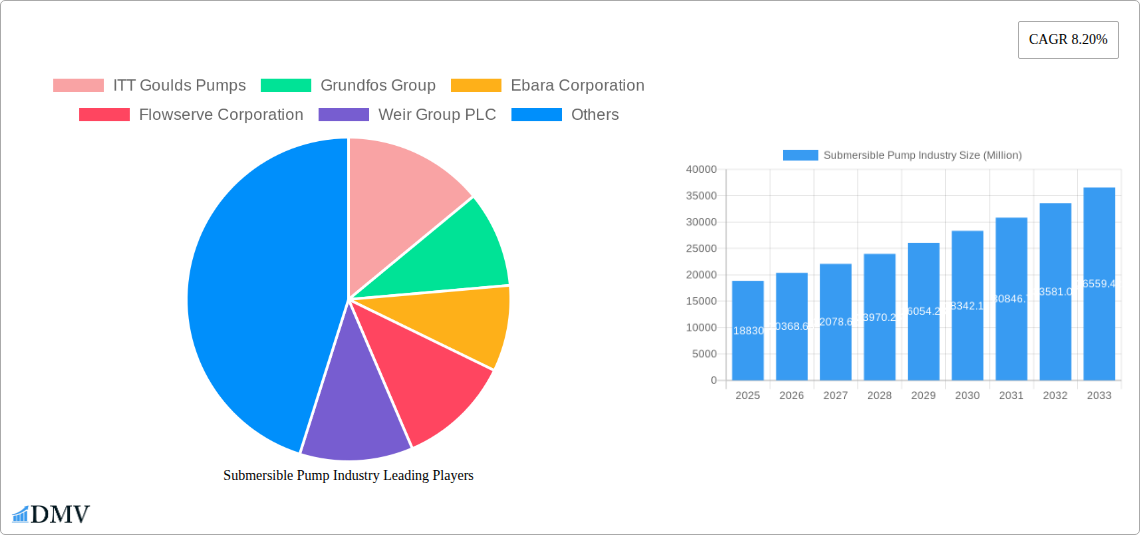
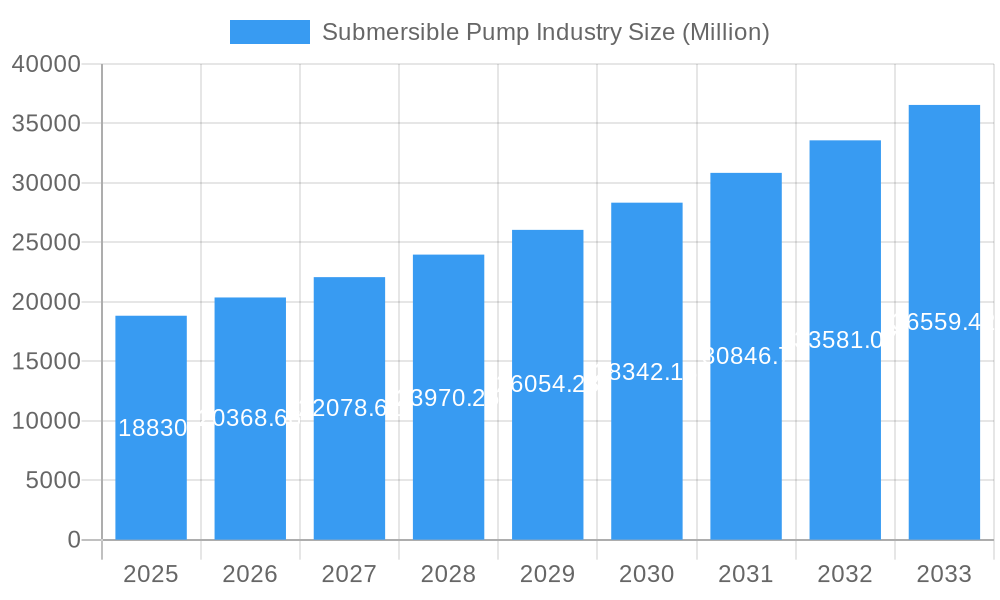
The global submersible pump market, valued at $18.83 billion in 2025, is projected to experience robust growth, exhibiting a compound annual growth rate (CAGR) of 8.20% from 2025 to 2033. This expansion is fueled by several key drivers. Increasing urbanization and industrialization necessitate efficient water management solutions, driving demand for submersible pumps across various sectors, including water and wastewater treatment, oil and gas extraction, and mining and construction. Furthermore, advancements in pump technology, such as the development of energy-efficient models and improved durability, contribute significantly to market growth. The rising adoption of smart technologies for monitoring and control further enhances the appeal of these pumps, leading to increased operational efficiency and reduced maintenance costs. Market segmentation reveals a strong demand for electric-drive submersible pumps, particularly borewell and non-clog types, driven by their cost-effectiveness and ease of installation. The market is geographically diverse, with significant contributions anticipated from North America and Asia Pacific regions, reflecting the rapid industrial development and infrastructure investments in these areas. However, factors like fluctuating raw material prices and stringent environmental regulations might pose challenges to market growth in the coming years. Competition among established players like ITT Goulds Pumps, Grundfos Group, and Ebara Corporation, alongside emerging players, ensures innovation and a diverse product portfolio to meet varied application demands.
Submersible Pump Industry Market Size (In Billion)
The forecast period (2025-2033) will likely witness a continued upward trajectory for the submersible pump market, propelled by factors such as increased government investments in water infrastructure projects globally, particularly in developing economies with expanding populations and industrial bases. The demand for efficient and reliable water supply systems, coupled with stringent environmental regulations demanding minimized water wastage, will further stimulate market expansion. Growth is also expected to be influenced by technological advancements focusing on improved pump efficiency, automation, and integration with smart monitoring systems. Specific segments showing strong growth potential include high-head submersible pumps catering to deep well applications and non-clog pumps tailored for applications involving abrasive or viscous fluids. Strategic partnerships and mergers and acquisitions are also expected to reshape the market landscape, leading to increased product innovation and broader market reach for major players. However, potential economic downturns or disruptions in global supply chains could negatively impact market growth during the forecast period.
Submersible Pump Industry Company Market Share
Submersible Pump Industry Market Report: 2019-2033
This comprehensive report provides an in-depth analysis of the global submersible pump industry, offering valuable insights for stakeholders seeking to navigate this dynamic market. With a study period spanning 2019-2033, a base year of 2025, and a forecast period of 2025-2033, this report delivers crucial data-driven projections and analyses, revealing lucrative opportunities and potential challenges. The global market size is estimated at xx Million in 2025 and is projected to reach xx Million by 2033, representing a significant growth trajectory.
Submersible Pump Industry Market Composition & Trends
The submersible pump market is characterized by a moderately concentrated landscape, with key players like ITT Goulds Pumps, Grundfos Group, Ebara Corporation, and Flowserve Corporation holding significant market share. However, the presence of numerous smaller players, particularly in regional markets, ensures a competitive environment. Innovation is driven by the need for enhanced energy efficiency, improved durability, and the integration of smart technologies. Stringent environmental regulations concerning water usage and waste management are key factors shaping industry practices. Substitute products, such as centrifugal pumps, pose a competitive challenge, particularly in certain applications. The market is segmented by type (borewell, openwell, non-clog), drive type (electric, hydraulic, others), head (below 50m, 50-100m, above 100m), and end-user industries (water & wastewater, oil & gas, mining & construction, others).
- Market Share Distribution: Top 5 players account for approximately 64% of the market.
- M&A Activities: Significant M&A activity was observed in recent years, with deal values exceeding xx Million in aggregate during the period 2019-2024. Examples include the February 2022 acquisition of Dreno Pompe by Industrial Flow Solutions.
- End-User Profiles: The water and wastewater sector remains the largest end-user segment, driven by increasing urbanization and infrastructure development. The oil and gas sector contributes significantly to demand for high-pressure, high-capacity submersible pumps.
Submersible Pump Industry Industry Evolution
The submersible pump market has demonstrated robust and consistent growth over the past five years, propelled by several key factors. These include escalating global demand for clean water, significant investments in critical infrastructure projects such as water supply and wastewater management, and continuous technological innovation. Between 2019 and 2024, the market experienced a Compound Annual Growth Rate (CAGR) of [Insert Specific XX% Here]. Projections for the forecast period (2025-2033) indicate a sustained growth trajectory with an anticipated CAGR of [Insert Specific XX% Here]. This expansion is largely driven by the increasing needs of developing economies and the widespread adoption of sophisticated, energy-efficient, and "smart" pump technologies. Innovations such as the seamless integration of Variable Frequency Drives (VFDs) and cutting-edge sensor systems are instrumental in enhancing operational efficiency, optimizing energy consumption, and significantly reducing overall operating costs. Concurrently, there is a discernible shift in consumer preference towards pumps that are not only reliable but also environmentally sustainable, compelling manufacturers to place a premium on research and development focused on these attributes.
Leading Regions, Countries, or Segments in Submersible Pump Industry
- Dominant Region: North America and Europe continue to lead the market, supported by substantial investments in upgrading existing infrastructure and the implementation of stringent environmental regulations aimed at responsible water resource management. The Asia-Pacific region is emerging as a high-growth market, fueled by rapid urbanization, burgeoning industrialization, and a growing need for advanced water and wastewater solutions.
- Dominant Segment (Type): Electric submersible pumps maintain their dominance due to their inherent cost-effectiveness, straightforward installation processes, and broad applicability across diverse sectors.
- Dominant Segment (Drive Type): The electric drive type commands the largest market share. This is attributed to its versatility, widespread availability, and superior energy efficiency in a multitude of operational environments and applications.
- Dominant Segment (Head): Pumps designed for head capacities below 50 meters represent a substantial market segment. Their prevalence is due to their extensive use in residential water supply, agricultural irrigation, and smaller-scale dewatering operations.
- Dominant Segment (End-User): The water and wastewater treatment sector stands out as the largest end-user segment. This is a direct consequence of the ubiquitous and critical role submersible pumps play in the operation of municipal and industrial water and wastewater treatment facilities globally.
Key Drivers:
- Accelerated investments in global water and wastewater infrastructure projects to address growing population needs and aging systems.
- The enforcement of stringent governmental regulations designed to promote water conservation, optimize water usage, and encourage efficient water management practices.
- An increasing market demand for submersible pump technologies that offer enhanced energy efficiency and reduced environmental impact.
- Technological advancements leading to more durable, intelligent, and cost-effective pump solutions.
Submersible Pump Industry Product Innovations
Recent product innovations in the submersible pump sector are revolutionizing performance and longevity. Key advancements include the development of highly energy-efficient electric motors, superior sealing technologies that dramatically enhance pump durability and resistance to harsh conditions, and the sophisticated integration of smart sensor systems. These sensors enable real-time remote monitoring, facilitate predictive maintenance scheduling, and provide valuable operational data. Collectively, these innovations are significantly improving the reliability, operational efficiency, and overall performance of submersible pumps, leading to a tangible reduction in their life-cycle costs. A noteworthy development is the introduction of electro-submersible pumps, exemplified by partnerships like Curtiss-Wright's collaboration with Shell Plc, marking a significant leap forward, particularly within the demanding oil and gas industry.
Propelling Factors for Submersible Pump Industry Growth
Several powerful factors are driving the substantial growth of the submersible pump industry. Technological advancements are at the forefront, with the continuous development of more efficient motors and intelligent control systems significantly boosting market performance. The ongoing expansion of infrastructure projects, especially in rapidly developing economies, is generating robust demand for submersible pumps essential for effective water management, irrigation, and drainage solutions. Furthermore, supportive government policies that prioritize water conservation, promote sustainable development, and incentivize the adoption of eco-friendly technologies are playing a crucial role in further accelerating market expansion.
Obstacles in the Submersible Pump Industry Market
Supply chain disruptions, particularly in the procurement of raw materials, can affect production and lead to increased costs. Intense competition from established players and new entrants creates price pressures. Stringent environmental regulations, while necessary, can also add to manufacturing costs and increase compliance burdens.
Future Opportunities in Submersible Pump Industry
Growing demand in emerging markets presents significant growth opportunities. The development and adoption of smart pump technologies, including remote monitoring and predictive maintenance, are expected to expand market potential. Expansion into new applications, such as industrial process cooling and desalination, offers further avenues for growth.
Major Players in the Submersible Pump Industry Ecosystem
- ITT Goulds Pumps
- Grundfos Group
- Ebara Corporation
- Flowserve Corporation
- Weir Group PLC
- Atlas Copco AB
- Baker Hughes Co
- Franklin Electric Co Inc
- Borets International Ltd
- Halliburton Co
- KSB AG
- The Gorman-Rupp Company
- Sulzer AG
- Schlumberger Limited
Key Developments in Submersible Pump Industry Industry
- May 2023: Curtiss-Wright Corporation announces an agreement with Shell Plc to develop and supply electro-submersible pumps for offshore platforms.
- February 2022: Industrial Flow Solutions acquires Dreno Pompe, expanding its presence in the wastewater pump market.
Strategic Submersible Pump Industry Market Forecast
The submersible pump market is poised for robust growth in the coming years, driven by increasing urbanization, infrastructure development, and the ongoing adoption of energy-efficient technologies. Emerging markets, particularly in Asia-Pacific, offer significant untapped potential. The focus on sustainable and smart pump solutions will further shape market dynamics. The industry's focus on innovation and technological advancements ensures its continued growth and expansion.
Submersible Pump Industry Segmentation
-
1. Type
- 1.1. Borewell Submersible Pump
- 1.2. Openwell Submersible Pump
- 1.3. Non-clog Submersible Pump
-
2. Drive Type
- 2.1. Electric
- 2.2. Hydraulic
- 2.3. Other Drive Types
-
3. Head
- 3.1. Below 50 m
- 3.2. Between 50 m to 100 m
- 3.3. Above 100 m
-
4. End User
- 4.1. Water and Wastewater
- 4.2. Oil and Gas Industry
- 4.3. Mining and Construction Industry
- 4.4. Other End Users
Submersible Pump Industry Segmentation By Geography
-
1. North America
- 1.1. United States
- 1.2. Canada
- 1.3. Rest of North America
-
2. Europe
- 2.1. Germany
- 2.2. France
- 2.3. United Kingdom
- 2.4. Spain
- 2.5. Nordic Countries
- 2.6. Turkey
- 2.7. Russia
- 2.8. Rest of Europe
-
3. Asia Pacific
- 3.1. China
- 3.2. India
- 3.3. Japan
- 3.4. South Korea
- 3.5. Malaysia
- 3.6. Thailand
- 3.7. Indonesia
- 3.8. Vietnam
- 3.9. Rest of Asia Pacific
-
4. South America
- 4.1. Brazil
- 4.2. Argentina
- 4.3. Colombia
- 4.4. Rest of South America
-
5. Middle East and Africa
- 5.1. Saudi Arabia
- 5.2. United Arab Emirates
- 5.3. South Africa
- 5.4. Nigeria
- 5.5. Qatar
- 5.6. Egypt
- 5.7. Rest of Middle East and Africa
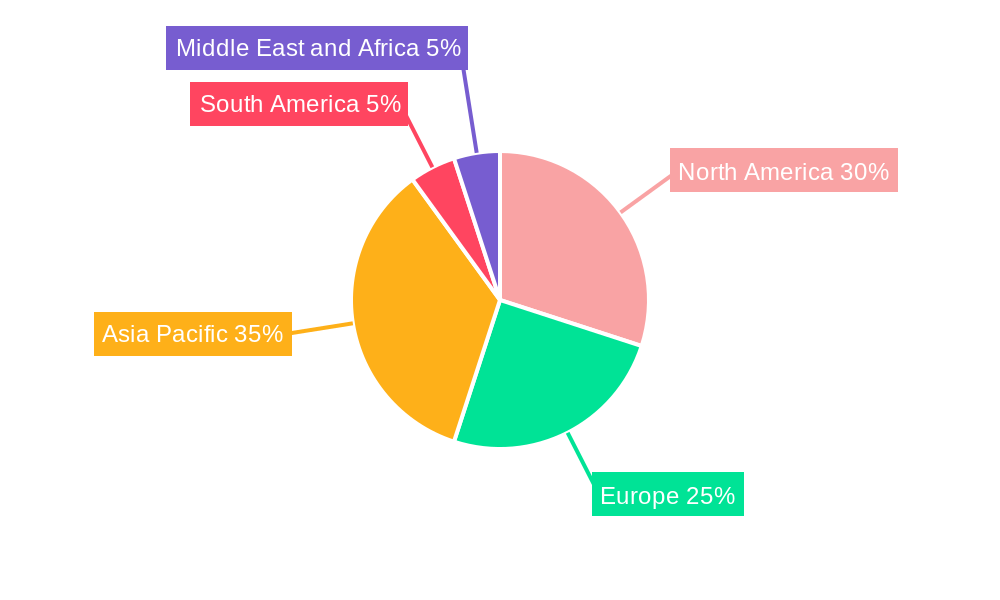
Submersible Pump Industry Regional Market Share
Geographic Coverage of Submersible Pump Industry
Submersible Pump Industry REPORT HIGHLIGHTS
| Aspects | Details |
|---|---|
| Study Period | 2020-2034 |
| Base Year | 2025 |
| Estimated Year | 2026 |
| Forecast Period | 2026-2034 |
| Historical Period | 2020-2025 |
| Growth Rate | CAGR of 8.20% from 2020-2034 |
| Segmentation |
|
Table of Contents
- 1. Introduction
- 1.1. Research Scope
- 1.2. Market Segmentation
- 1.3. Research Objective
- 1.4. Definitions and Assumptions
- 2. Executive Summary
- 2.1. Market Snapshot
- 3. Market Dynamics
- 3.1. Market Drivers
- 3.2. Market Restrains
- 3.3. Market Trends
- 3.4. Market Opportunities
- 4. Market Factor Analysis
- 4.1. Porters Five Forces
- 4.1.1. Bargaining Power of Suppliers
- 4.1.2. Bargaining Power of Buyers
- 4.1.3. Threat of New Entrants
- 4.1.4. Threat of Substitutes
- 4.1.5. Competitive Rivalry
- 4.2. PESTEL analysis
- 4.3. BCG Analysis
- 4.3.1. Stars (High Growth, High Market Share)
- 4.3.2. Cash Cows (Low Growth, High Market Share)
- 4.3.3. Question Mark (High Growth, Low Market Share)
- 4.3.4. Dogs (Low Growth, Low Market Share)
- 4.4. Ansoff Matrix Analysis
- 4.5. Supply Chain Analysis
- 4.6. Regulatory Landscape
- 4.7. Current Market Potential and Opportunity Assessment (TAM–SAM–SOM Framework)
- 4.8. DMV Analyst Note
- 4.1. Porters Five Forces
- 5. Market Analysis, Insights and Forecast 2021-2033
- 5.1. Market Analysis, Insights and Forecast - by Type
- 5.1.1. Borewell Submersible Pump
- 5.1.2. Openwell Submersible Pump
- 5.1.3. Non-clog Submersible Pump
- 5.2. Market Analysis, Insights and Forecast - by Drive Type
- 5.2.1. Electric
- 5.2.2. Hydraulic
- 5.2.3. Other Drive Types
- 5.3. Market Analysis, Insights and Forecast - by Head
- 5.3.1. Below 50 m
- 5.3.2. Between 50 m to 100 m
- 5.3.3. Above 100 m
- 5.4. Market Analysis, Insights and Forecast - by End User
- 5.4.1. Water and Wastewater
- 5.4.2. Oil and Gas Industry
- 5.4.3. Mining and Construction Industry
- 5.4.4. Other End Users
- 5.5. Market Analysis, Insights and Forecast - by Region
- 5.5.1. North America
- 5.5.2. Europe
- 5.5.3. Asia Pacific
- 5.5.4. South America
- 5.5.5. Middle East and Africa
- 5.1. Market Analysis, Insights and Forecast - by Type
- 6. Global Submersible Pump Industry Analysis, Insights and Forecast, 2021-2033
- 6.1. Market Analysis, Insights and Forecast - by Type
- 6.1.1. Borewell Submersible Pump
- 6.1.2. Openwell Submersible Pump
- 6.1.3. Non-clog Submersible Pump
- 6.2. Market Analysis, Insights and Forecast - by Drive Type
- 6.2.1. Electric
- 6.2.2. Hydraulic
- 6.2.3. Other Drive Types
- 6.3. Market Analysis, Insights and Forecast - by Head
- 6.3.1. Below 50 m
- 6.3.2. Between 50 m to 100 m
- 6.3.3. Above 100 m
- 6.4. Market Analysis, Insights and Forecast - by End User
- 6.4.1. Water and Wastewater
- 6.4.2. Oil and Gas Industry
- 6.4.3. Mining and Construction Industry
- 6.4.4. Other End Users
- 6.1. Market Analysis, Insights and Forecast - by Type
- 7. North America Submersible Pump Industry Analysis, Insights and Forecast, 2020-2032
- 7.1. Market Analysis, Insights and Forecast - by Type
- 7.1.1. Borewell Submersible Pump
- 7.1.2. Openwell Submersible Pump
- 7.1.3. Non-clog Submersible Pump
- 7.2. Market Analysis, Insights and Forecast - by Drive Type
- 7.2.1. Electric
- 7.2.2. Hydraulic
- 7.2.3. Other Drive Types
- 7.3. Market Analysis, Insights and Forecast - by Head
- 7.3.1. Below 50 m
- 7.3.2. Between 50 m to 100 m
- 7.3.3. Above 100 m
- 7.4. Market Analysis, Insights and Forecast - by End User
- 7.4.1. Water and Wastewater
- 7.4.2. Oil and Gas Industry
- 7.4.3. Mining and Construction Industry
- 7.4.4. Other End Users
- 7.1. Market Analysis, Insights and Forecast - by Type
- 8. Europe Submersible Pump Industry Analysis, Insights and Forecast, 2020-2032
- 8.1. Market Analysis, Insights and Forecast - by Type
- 8.1.1. Borewell Submersible Pump
- 8.1.2. Openwell Submersible Pump
- 8.1.3. Non-clog Submersible Pump
- 8.2. Market Analysis, Insights and Forecast - by Drive Type
- 8.2.1. Electric
- 8.2.2. Hydraulic
- 8.2.3. Other Drive Types
- 8.3. Market Analysis, Insights and Forecast - by Head
- 8.3.1. Below 50 m
- 8.3.2. Between 50 m to 100 m
- 8.3.3. Above 100 m
- 8.4. Market Analysis, Insights and Forecast - by End User
- 8.4.1. Water and Wastewater
- 8.4.2. Oil and Gas Industry
- 8.4.3. Mining and Construction Industry
- 8.4.4. Other End Users
- 8.1. Market Analysis, Insights and Forecast - by Type
- 9. Asia Pacific Submersible Pump Industry Analysis, Insights and Forecast, 2020-2032
- 9.1. Market Analysis, Insights and Forecast - by Type
- 9.1.1. Borewell Submersible Pump
- 9.1.2. Openwell Submersible Pump
- 9.1.3. Non-clog Submersible Pump
- 9.2. Market Analysis, Insights and Forecast - by Drive Type
- 9.2.1. Electric
- 9.2.2. Hydraulic
- 9.2.3. Other Drive Types
- 9.3. Market Analysis, Insights and Forecast - by Head
- 9.3.1. Below 50 m
- 9.3.2. Between 50 m to 100 m
- 9.3.3. Above 100 m
- 9.4. Market Analysis, Insights and Forecast - by End User
- 9.4.1. Water and Wastewater
- 9.4.2. Oil and Gas Industry
- 9.4.3. Mining and Construction Industry
- 9.4.4. Other End Users
- 9.1. Market Analysis, Insights and Forecast - by Type
- 10. South America Submersible Pump Industry Analysis, Insights and Forecast, 2020-2032
- 10.1. Market Analysis, Insights and Forecast - by Type
- 10.1.1. Borewell Submersible Pump
- 10.1.2. Openwell Submersible Pump
- 10.1.3. Non-clog Submersible Pump
- 10.2. Market Analysis, Insights and Forecast - by Drive Type
- 10.2.1. Electric
- 10.2.2. Hydraulic
- 10.2.3. Other Drive Types
- 10.3. Market Analysis, Insights and Forecast - by Head
- 10.3.1. Below 50 m
- 10.3.2. Between 50 m to 100 m
- 10.3.3. Above 100 m
- 10.4. Market Analysis, Insights and Forecast - by End User
- 10.4.1. Water and Wastewater
- 10.4.2. Oil and Gas Industry
- 10.4.3. Mining and Construction Industry
- 10.4.4. Other End Users
- 10.1. Market Analysis, Insights and Forecast - by Type
- 11. Middle East and Africa Submersible Pump Industry Analysis, Insights and Forecast, 2020-2032
- 11.1. Market Analysis, Insights and Forecast - by Type
- 11.1.1. Borewell Submersible Pump
- 11.1.2. Openwell Submersible Pump
- 11.1.3. Non-clog Submersible Pump
- 11.2. Market Analysis, Insights and Forecast - by Drive Type
- 11.2.1. Electric
- 11.2.2. Hydraulic
- 11.2.3. Other Drive Types
- 11.3. Market Analysis, Insights and Forecast - by Head
- 11.3.1. Below 50 m
- 11.3.2. Between 50 m to 100 m
- 11.3.3. Above 100 m
- 11.4. Market Analysis, Insights and Forecast - by End User
- 11.4.1. Water and Wastewater
- 11.4.2. Oil and Gas Industry
- 11.4.3. Mining and Construction Industry
- 11.4.4. Other End Users
- 11.1. Market Analysis, Insights and Forecast - by Type
- 12. Competitive Analysis
- 12.1. Company Profiles
- 12.1.1 ITT Goulds Pumps
- 12.1.1.1. Company Overview
- 12.1.1.2. Products
- 12.1.1.3. Company Financials
- 12.1.1.4. SWOT Analysis
- 12.1.2 Grundfos Group
- 12.1.2.1. Company Overview
- 12.1.2.2. Products
- 12.1.2.3. Company Financials
- 12.1.2.4. SWOT Analysis
- 12.1.3 Ebara Corporation
- 12.1.3.1. Company Overview
- 12.1.3.2. Products
- 12.1.3.3. Company Financials
- 12.1.3.4. SWOT Analysis
- 12.1.4 Flowserve Corporation
- 12.1.4.1. Company Overview
- 12.1.4.2. Products
- 12.1.4.3. Company Financials
- 12.1.4.4. SWOT Analysis
- 12.1.5 Weir Group PLC
- 12.1.5.1. Company Overview
- 12.1.5.2. Products
- 12.1.5.3. Company Financials
- 12.1.5.4. SWOT Analysis
- 12.1.6 Atlas Copco AB
- 12.1.6.1. Company Overview
- 12.1.6.2. Products
- 12.1.6.3. Company Financials
- 12.1.6.4. SWOT Analysis
- 12.1.7 Baker Hughes Co
- 12.1.7.1. Company Overview
- 12.1.7.2. Products
- 12.1.7.3. Company Financials
- 12.1.7.4. SWOT Analysis
- 12.1.8 Franklin Electric Co Inc
- 12.1.8.1. Company Overview
- 12.1.8.2. Products
- 12.1.8.3. Company Financials
- 12.1.8.4. SWOT Analysis
- 12.1.9 Borets International Ltd
- 12.1.9.1. Company Overview
- 12.1.9.2. Products
- 12.1.9.3. Company Financials
- 12.1.9.4. SWOT Analysis
- 12.1.10 Halliburton Co
- 12.1.10.1. Company Overview
- 12.1.10.2. Products
- 12.1.10.3. Company Financials
- 12.1.10.4. SWOT Analysis
- 12.1.11 KSB AG*List Not Exhaustive 6 4 Market Ranking/Share Analysi
- 12.1.11.1. Company Overview
- 12.1.11.2. Products
- 12.1.11.3. Company Financials
- 12.1.11.4. SWOT Analysis
- 12.1.12 The Gorman-Rupp Company
- 12.1.12.1. Company Overview
- 12.1.12.2. Products
- 12.1.12.3. Company Financials
- 12.1.12.4. SWOT Analysis
- 12.1.13 Sulzer AG
- 12.1.13.1. Company Overview
- 12.1.13.2. Products
- 12.1.13.3. Company Financials
- 12.1.13.4. SWOT Analysis
- 12.1.14 Schlumberger Limited
- 12.1.14.1. Company Overview
- 12.1.14.2. Products
- 12.1.14.3. Company Financials
- 12.1.14.4. SWOT Analysis
- 12.1.1 ITT Goulds Pumps
- 12.2. Market Entropy
- 12.2.1 Company's Key Areas Served
- 12.2.2 Recent Developments
- 12.3. Company Market Share Analysis 2025
- 12.3.1 Top 5 Companies Market Share Analysis
- 12.3.2 Top 3 Companies Market Share Analysis
- 12.4. List of Potential Customers
- 13. Research Methodology
List of Figures
- Figure 1: Global Submersible Pump Industry Revenue Breakdown (Million, %) by Region 2025 & 2033
- Figure 2: North America Submersible Pump Industry Revenue (Million), by Type 2025 & 2033
- Figure 3: North America Submersible Pump Industry Revenue Share (%), by Type 2025 & 2033
- Figure 4: North America Submersible Pump Industry Revenue (Million), by Drive Type 2025 & 2033
- Figure 5: North America Submersible Pump Industry Revenue Share (%), by Drive Type 2025 & 2033
- Figure 6: North America Submersible Pump Industry Revenue (Million), by Head 2025 & 2033
- Figure 7: North America Submersible Pump Industry Revenue Share (%), by Head 2025 & 2033
- Figure 8: North America Submersible Pump Industry Revenue (Million), by End User 2025 & 2033
- Figure 9: North America Submersible Pump Industry Revenue Share (%), by End User 2025 & 2033
- Figure 10: North America Submersible Pump Industry Revenue (Million), by Country 2025 & 2033
- Figure 11: North America Submersible Pump Industry Revenue Share (%), by Country 2025 & 2033
- Figure 12: Europe Submersible Pump Industry Revenue (Million), by Type 2025 & 2033
- Figure 13: Europe Submersible Pump Industry Revenue Share (%), by Type 2025 & 2033
- Figure 14: Europe Submersible Pump Industry Revenue (Million), by Drive Type 2025 & 2033
- Figure 15: Europe Submersible Pump Industry Revenue Share (%), by Drive Type 2025 & 2033
- Figure 16: Europe Submersible Pump Industry Revenue (Million), by Head 2025 & 2033
- Figure 17: Europe Submersible Pump Industry Revenue Share (%), by Head 2025 & 2033
- Figure 18: Europe Submersible Pump Industry Revenue (Million), by End User 2025 & 2033
- Figure 19: Europe Submersible Pump Industry Revenue Share (%), by End User 2025 & 2033
- Figure 20: Europe Submersible Pump Industry Revenue (Million), by Country 2025 & 2033
- Figure 21: Europe Submersible Pump Industry Revenue Share (%), by Country 2025 & 2033
- Figure 22: Asia Pacific Submersible Pump Industry Revenue (Million), by Type 2025 & 2033
- Figure 23: Asia Pacific Submersible Pump Industry Revenue Share (%), by Type 2025 & 2033
- Figure 24: Asia Pacific Submersible Pump Industry Revenue (Million), by Drive Type 2025 & 2033
- Figure 25: Asia Pacific Submersible Pump Industry Revenue Share (%), by Drive Type 2025 & 2033
- Figure 26: Asia Pacific Submersible Pump Industry Revenue (Million), by Head 2025 & 2033
- Figure 27: Asia Pacific Submersible Pump Industry Revenue Share (%), by Head 2025 & 2033
- Figure 28: Asia Pacific Submersible Pump Industry Revenue (Million), by End User 2025 & 2033
- Figure 29: Asia Pacific Submersible Pump Industry Revenue Share (%), by End User 2025 & 2033
- Figure 30: Asia Pacific Submersible Pump Industry Revenue (Million), by Country 2025 & 2033
- Figure 31: Asia Pacific Submersible Pump Industry Revenue Share (%), by Country 2025 & 2033
- Figure 32: South America Submersible Pump Industry Revenue (Million), by Type 2025 & 2033
- Figure 33: South America Submersible Pump Industry Revenue Share (%), by Type 2025 & 2033
- Figure 34: South America Submersible Pump Industry Revenue (Million), by Drive Type 2025 & 2033
- Figure 35: South America Submersible Pump Industry Revenue Share (%), by Drive Type 2025 & 2033
- Figure 36: South America Submersible Pump Industry Revenue (Million), by Head 2025 & 2033
- Figure 37: South America Submersible Pump Industry Revenue Share (%), by Head 2025 & 2033
- Figure 38: South America Submersible Pump Industry Revenue (Million), by End User 2025 & 2033
- Figure 39: South America Submersible Pump Industry Revenue Share (%), by End User 2025 & 2033
- Figure 40: South America Submersible Pump Industry Revenue (Million), by Country 2025 & 2033
- Figure 41: South America Submersible Pump Industry Revenue Share (%), by Country 2025 & 2033
- Figure 42: Middle East and Africa Submersible Pump Industry Revenue (Million), by Type 2025 & 2033
- Figure 43: Middle East and Africa Submersible Pump Industry Revenue Share (%), by Type 2025 & 2033
- Figure 44: Middle East and Africa Submersible Pump Industry Revenue (Million), by Drive Type 2025 & 2033
- Figure 45: Middle East and Africa Submersible Pump Industry Revenue Share (%), by Drive Type 2025 & 2033
- Figure 46: Middle East and Africa Submersible Pump Industry Revenue (Million), by Head 2025 & 2033
- Figure 47: Middle East and Africa Submersible Pump Industry Revenue Share (%), by Head 2025 & 2033
- Figure 48: Middle East and Africa Submersible Pump Industry Revenue (Million), by End User 2025 & 2033
- Figure 49: Middle East and Africa Submersible Pump Industry Revenue Share (%), by End User 2025 & 2033
- Figure 50: Middle East and Africa Submersible Pump Industry Revenue (Million), by Country 2025 & 2033
- Figure 51: Middle East and Africa Submersible Pump Industry Revenue Share (%), by Country 2025 & 2033
List of Tables
- Table 1: Global Submersible Pump Industry Revenue Million Forecast, by Type 2020 & 2033
- Table 2: Global Submersible Pump Industry Revenue Million Forecast, by Drive Type 2020 & 2033
- Table 3: Global Submersible Pump Industry Revenue Million Forecast, by Head 2020 & 2033
- Table 4: Global Submersible Pump Industry Revenue Million Forecast, by End User 2020 & 2033
- Table 5: Global Submersible Pump Industry Revenue Million Forecast, by Region 2020 & 2033
- Table 6: Global Submersible Pump Industry Revenue Million Forecast, by Type 2020 & 2033
- Table 7: Global Submersible Pump Industry Revenue Million Forecast, by Drive Type 2020 & 2033
- Table 8: Global Submersible Pump Industry Revenue Million Forecast, by Head 2020 & 2033
- Table 9: Global Submersible Pump Industry Revenue Million Forecast, by End User 2020 & 2033
- Table 10: Global Submersible Pump Industry Revenue Million Forecast, by Country 2020 & 2033
- Table 11: United States Submersible Pump Industry Revenue (Million) Forecast, by Application 2020 & 2033
- Table 12: Canada Submersible Pump Industry Revenue (Million) Forecast, by Application 2020 & 2033
- Table 13: Rest of North America Submersible Pump Industry Revenue (Million) Forecast, by Application 2020 & 2033
- Table 14: Global Submersible Pump Industry Revenue Million Forecast, by Type 2020 & 2033
- Table 15: Global Submersible Pump Industry Revenue Million Forecast, by Drive Type 2020 & 2033
- Table 16: Global Submersible Pump Industry Revenue Million Forecast, by Head 2020 & 2033
- Table 17: Global Submersible Pump Industry Revenue Million Forecast, by End User 2020 & 2033
- Table 18: Global Submersible Pump Industry Revenue Million Forecast, by Country 2020 & 2033
- Table 19: Germany Submersible Pump Industry Revenue (Million) Forecast, by Application 2020 & 2033
- Table 20: France Submersible Pump Industry Revenue (Million) Forecast, by Application 2020 & 2033
- Table 21: United Kingdom Submersible Pump Industry Revenue (Million) Forecast, by Application 2020 & 2033
- Table 22: Spain Submersible Pump Industry Revenue (Million) Forecast, by Application 2020 & 2033
- Table 23: Nordic Countries Submersible Pump Industry Revenue (Million) Forecast, by Application 2020 & 2033
- Table 24: Turkey Submersible Pump Industry Revenue (Million) Forecast, by Application 2020 & 2033
- Table 25: Russia Submersible Pump Industry Revenue (Million) Forecast, by Application 2020 & 2033
- Table 26: Rest of Europe Submersible Pump Industry Revenue (Million) Forecast, by Application 2020 & 2033
- Table 27: Global Submersible Pump Industry Revenue Million Forecast, by Type 2020 & 2033
- Table 28: Global Submersible Pump Industry Revenue Million Forecast, by Drive Type 2020 & 2033
- Table 29: Global Submersible Pump Industry Revenue Million Forecast, by Head 2020 & 2033
- Table 30: Global Submersible Pump Industry Revenue Million Forecast, by End User 2020 & 2033
- Table 31: Global Submersible Pump Industry Revenue Million Forecast, by Country 2020 & 2033
- Table 32: China Submersible Pump Industry Revenue (Million) Forecast, by Application 2020 & 2033
- Table 33: India Submersible Pump Industry Revenue (Million) Forecast, by Application 2020 & 2033
- Table 34: Japan Submersible Pump Industry Revenue (Million) Forecast, by Application 2020 & 2033
- Table 35: South Korea Submersible Pump Industry Revenue (Million) Forecast, by Application 2020 & 2033
- Table 36: Malaysia Submersible Pump Industry Revenue (Million) Forecast, by Application 2020 & 2033
- Table 37: Thailand Submersible Pump Industry Revenue (Million) Forecast, by Application 2020 & 2033
- Table 38: Indonesia Submersible Pump Industry Revenue (Million) Forecast, by Application 2020 & 2033
- Table 39: Vietnam Submersible Pump Industry Revenue (Million) Forecast, by Application 2020 & 2033
- Table 40: Rest of Asia Pacific Submersible Pump Industry Revenue (Million) Forecast, by Application 2020 & 2033
- Table 41: Global Submersible Pump Industry Revenue Million Forecast, by Type 2020 & 2033
- Table 42: Global Submersible Pump Industry Revenue Million Forecast, by Drive Type 2020 & 2033
- Table 43: Global Submersible Pump Industry Revenue Million Forecast, by Head 2020 & 2033
- Table 44: Global Submersible Pump Industry Revenue Million Forecast, by End User 2020 & 2033
- Table 45: Global Submersible Pump Industry Revenue Million Forecast, by Country 2020 & 2033
- Table 46: Brazil Submersible Pump Industry Revenue (Million) Forecast, by Application 2020 & 2033
- Table 47: Argentina Submersible Pump Industry Revenue (Million) Forecast, by Application 2020 & 2033
- Table 48: Colombia Submersible Pump Industry Revenue (Million) Forecast, by Application 2020 & 2033
- Table 49: Rest of South America Submersible Pump Industry Revenue (Million) Forecast, by Application 2020 & 2033
- Table 50: Global Submersible Pump Industry Revenue Million Forecast, by Type 2020 & 2033
- Table 51: Global Submersible Pump Industry Revenue Million Forecast, by Drive Type 2020 & 2033
- Table 52: Global Submersible Pump Industry Revenue Million Forecast, by Head 2020 & 2033
- Table 53: Global Submersible Pump Industry Revenue Million Forecast, by End User 2020 & 2033
- Table 54: Global Submersible Pump Industry Revenue Million Forecast, by Country 2020 & 2033
- Table 55: Saudi Arabia Submersible Pump Industry Revenue (Million) Forecast, by Application 2020 & 2033
- Table 56: United Arab Emirates Submersible Pump Industry Revenue (Million) Forecast, by Application 2020 & 2033
- Table 57: South Africa Submersible Pump Industry Revenue (Million) Forecast, by Application 2020 & 2033
- Table 58: Nigeria Submersible Pump Industry Revenue (Million) Forecast, by Application 2020 & 2033
- Table 59: Qatar Submersible Pump Industry Revenue (Million) Forecast, by Application 2020 & 2033
- Table 60: Egypt Submersible Pump Industry Revenue (Million) Forecast, by Application 2020 & 2033
- Table 61: Rest of Middle East and Africa Submersible Pump Industry Revenue (Million) Forecast, by Application 2020 & 2033
Frequently Asked Questions
1. What is the projected Compound Annual Growth Rate (CAGR) of the Submersible Pump Industry?
The projected CAGR is approximately 8.20%.
2. Which companies are prominent players in the Submersible Pump Industry?
Key companies in the market include ITT Goulds Pumps, Grundfos Group, Ebara Corporation, Flowserve Corporation, Weir Group PLC, Atlas Copco AB, Baker Hughes Co, Franklin Electric Co Inc, Borets International Ltd, Halliburton Co, KSB AG*List Not Exhaustive 6 4 Market Ranking/Share Analysi, The Gorman-Rupp Company, Sulzer AG, Schlumberger Limited.
3. What are the main segments of the Submersible Pump Industry?
The market segments include Type, Drive Type, Head, End User.
4. Can you provide details about the market size?
The market size is estimated to be USD 18.83 Million as of 2022.
5. What are some drivers contributing to market growth?
4.; Rapid Recovery in the Oil and Gas and Mining Industries4.; Surge in the Construction Industry.
6. What are the notable trends driving market growth?
The Oil and Gas Industry is Expected to Dominate the Market.
7. Are there any restraints impacting market growth?
4.; High Maintenance and Operation Costs of Submersible Pump Restrain the Market.
8. Can you provide examples of recent developments in the market?
In May 2023, Curtiss-Wright Corporation announced to sign an agreement with Shell Plc to test, manufacture, and provide operational support for an electro-submersible pump for a for a Shell offshore platform in the Gulf of Mexico. The goal of this initiative is to Curtiss-Wright's canned motor technology as an effective and reliable alternative to current subsea pump technologies.
9. What pricing options are available for accessing the report?
Pricing options include single-user, multi-user, and enterprise licenses priced at USD 4750, USD 5250, and USD 8750 respectively.
10. Is the market size provided in terms of value or volume?
The market size is provided in terms of value, measured in Million.
11. Are there any specific market keywords associated with the report?
Yes, the market keyword associated with the report is "Submersible Pump Industry," which aids in identifying and referencing the specific market segment covered.
12. How do I determine which pricing option suits my needs best?
The pricing options vary based on user requirements and access needs. Individual users may opt for single-user licenses, while businesses requiring broader access may choose multi-user or enterprise licenses for cost-effective access to the report.
13. Are there any additional resources or data provided in the Submersible Pump Industry report?
While the report offers comprehensive insights, it's advisable to review the specific contents or supplementary materials provided to ascertain if additional resources or data are available.
14. How can I stay updated on further developments or reports in the Submersible Pump Industry?
To stay informed about further developments, trends, and reports in the Submersible Pump Industry, consider subscribing to industry newsletters, following relevant companies and organizations, or regularly checking reputable industry news sources and publications.
Methodology
Step 1 - Identification of Relevant Samples Size from Population Database


Step 2 - Approaches for Defining Global Market Size (Value, Volume* & Price*)

Note*: In applicable scenarios
Step 3 - Data Sources
Primary Research
- Web Analytics
- Survey Reports
- Research Institute
- Latest Research Reports
- Opinion Leaders
Secondary Research
- Annual Reports
- White Paper
- Latest Press Release
- Industry Association
- Paid Database
- Investor Presentations

Step 4 - Data Triangulation
Involves using different sources of information in order to increase the validity of a study
These sources are likely to be stakeholders in a program - participants, other researchers, program staff, other community members, and so on.
Then we put all data in single framework & apply various statistical tools to find out the dynamic on the market.
During the analysis stage, feedback from the stakeholder groups would be compared to determine areas of agreement as well as areas of divergence