

Key Insights
The South American compressor market, valued at $1445.4 million in 2024, is projected for robust expansion. Key growth drivers include escalating oil and gas exploration, heightened industrialization across manufacturing and chemical sectors, and the increasing demand for dependable power generation infrastructure. The market anticipates a Compound Annual Growth Rate (CAGR) of 4%, signifying consistent development. Positive displacement compressors are expected to retain a substantial market share due to their effectiveness in high-pressure, controlled-flow industrial applications. Concurrently, the dynamic compressor segment is set for growth, particularly in sectors demanding high efficiency and variable flow rates. Brazil and Argentina are leading contributors, reflecting their strong economies and industrial foundations. Potential challenges include economic volatility and evolving energy sector regulations, though the long-term outlook remains positive, driven by ongoing infrastructure development and industrial modernization.
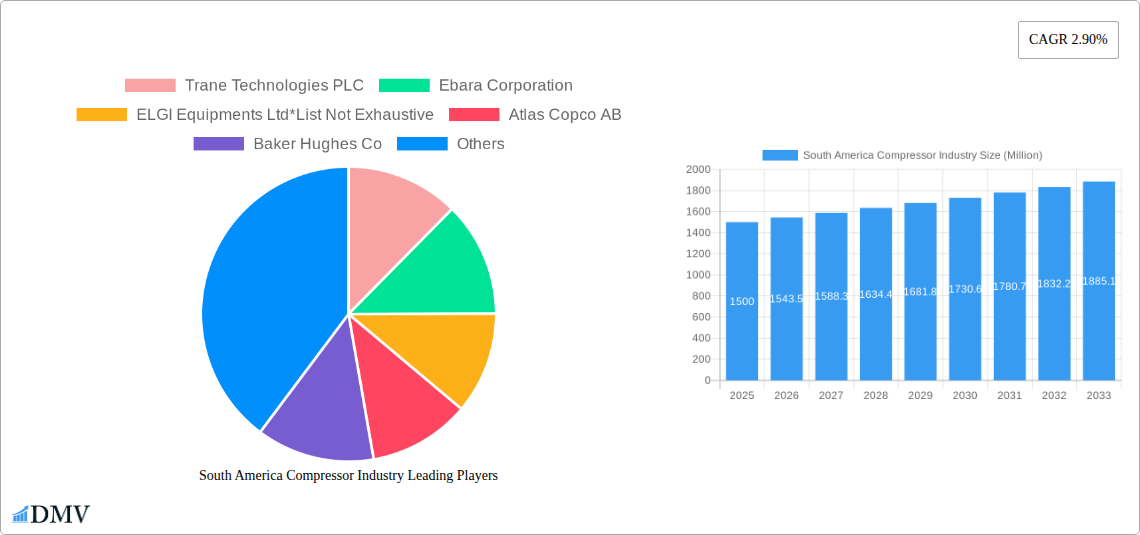
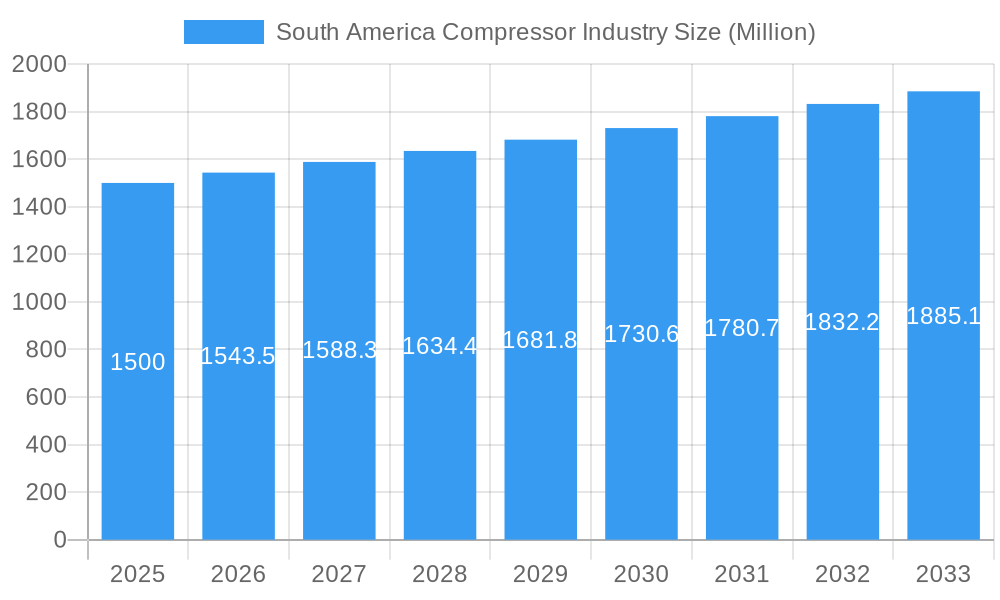
South America Compressor Industry Market Size (In Billion)
The South American compressor market exhibits diverse end-user applications. The oil and gas sector, with significant investment in extraction and processing, represents a primary market segment. The power sector's requirement for reliable air compression in generation and transmission also drives demand. Furthermore, expanding manufacturing and chemical industries, particularly in Brazil and Argentina, are propelling market growth through their reliance on compressors for pneumatic tools and chemical processes. While precise segment shares are not detailed, oil & gas, power generation, and manufacturing collectively constitute the majority of the market. The "Other End Users" category encompasses a wide array of niche applications, underscoring the pervasive utility of compressors throughout the South American economy. The competitive landscape features global leaders such as Atlas Copco and Siemens, alongside regional entities like ELGI Equipments, presenting opportunities for both established and new market entrants.
South America Compressor Industry Company Market Share
South America Compressor Industry: Market Analysis and Forecast 2019-2033
This comprehensive report provides an in-depth analysis of the South America compressor industry, offering valuable insights for stakeholders seeking to navigate this dynamic market. Covering the period 2019-2033, with a focus on 2025, this report delves into market trends, competitive landscapes, technological advancements, and future growth prospects. The total market value is estimated at xx Million in 2025 and is projected to reach xx Million by 2033.
South America Compressor Industry Market Composition & Trends
This section evaluates the South American compressor market's structure, growth drivers, and challenges. We analyze market concentration, identifying key players and their respective market shares. The report also examines innovation catalysts, including technological advancements and regulatory influences shaping the industry. Furthermore, a detailed analysis of substitute products, end-user profiles (Oil and Gas Industry, Power Sector, Manufacturing Sector, Chemicals and Petrochemical Industry, and Other End Users), and M&A activities, including deal values (estimated at xx Million annually in recent years), is presented.
- Market Share Distribution: Trane Technologies PLC, Ebara Corporation, and Atlas Copco AB hold a combined market share of approximately xx%, with other significant players including Baker Hughes Co, Aerzener Maschinenfabrik GmbH, and Siemens AG.
- M&A Activity: The past five years have witnessed xx major mergers and acquisitions, primarily driven by consolidation efforts and expansion into new segments.
South America Compressor Industry Industry Evolution
This section traces the evolution of the South America compressor industry from 2019 to 2024, analyzing market growth trajectories, technological advancements, and shifting consumer demands. Data points include annual growth rates (averaging xx% during the historical period), adoption rates of new technologies (e.g., xx% adoption of energy-efficient compressors), and changes in end-user preferences. The report meticulously analyzes the transition from traditional compressor technologies to more sustainable and efficient solutions, driven by both regulatory pressures and cost savings.
Leading Regions, Countries, or Segments in South America Compressor Industry
This section pinpoints the dominant regions, countries, and segments within the South America compressor market. We identify the leading end-user segment (e.g., Oil & Gas), analyze the reasons behind its dominance, and provide a detailed analysis of the top performing compressor types (Positive Displacement and Dynamic).
- Key Drivers:
- Brazil: Strong economic growth and substantial investment in infrastructure projects.
- Oil & Gas: High demand driven by ongoing exploration and production activities.
- Positive Displacement Compressors: High reliability and suitability for demanding applications.
- Dominance Factors: Increased investment in energy infrastructure and consistent demand from the oil and gas sector.
South America Compressor Industry Product Innovations
The South America compressor market is witnessing rapid product innovation, with manufacturers introducing energy-efficient compressors, smart compressors with integrated monitoring systems, and specialized compressors designed for specific applications. These innovations offer improved performance metrics, enhanced reliability, and reduced operational costs, significantly impacting market dynamics.
Propelling Factors for South America Compressor Industry Growth
Several factors are driving the growth of the South America compressor industry. These include increasing industrialization, expanding energy infrastructure, government initiatives promoting energy efficiency, and rising demand from key end-user sectors. Technological advancements in compressor technology, leading to more efficient and reliable models, further contribute to market expansion.
Obstacles in the South America Compressor Industry Market
The South America compressor market faces certain obstacles, including volatile raw material prices, import restrictions, and competition from both domestic and international manufacturers. Supply chain disruptions, especially exacerbated in recent years, pose a significant challenge, while regulatory hurdles and infrastructural limitations in certain regions can also slow market growth.
Future Opportunities in South America Compressor Industry
Future growth opportunities lie in the adoption of eco-friendly compressor technologies, expansion into untapped market segments (e.g., renewable energy), and the increasing demand for energy-efficient solutions driven by sustainability concerns. Furthermore, the growth of the manufacturing and chemical sectors promises increased demand for compressors in the coming years.
Major Players in the South America Compressor Industry Ecosystem
- Trane Technologies PLC
- Ebara Corporation
- ELGI Equipments Ltd
- Atlas Copco AB
- Baker Hughes Co
- Aerzener Maschinenfabrik GmbH
- Siemens AG
- Schulz S A
- General Electric Company
Key Developments in South America Compressor Industry Industry
- September 2022: YPF and Petronas's USD 10 billion LNG plant agreement significantly boosts demand for compressors in the oil and gas sector.
- January 2023: Compass Gás e Energia's USD 140 million LNG regasification terminal in São Paulo expands the market for specialized compressors in the energy sector.
Strategic South America Compressor Industry Market Forecast
The South America compressor industry is poised for robust growth, driven by sustained investments in energy infrastructure, industrial expansion, and the rising adoption of advanced compressor technologies. The market is expected to experience a compound annual growth rate (CAGR) of xx% during the forecast period (2025-2033), presenting significant opportunities for established players and new entrants alike.
South America Compressor Industry Segmentation
-
1. Type
- 1.1. Positive Diplacement
- 1.2. Dynamic
-
2. End User
- 2.1. Oil and Gas Industry
- 2.2. Power Sector
- 2.3. Manufacturing Sector
- 2.4. Chemicals and Petrochemical Industry
- 2.5. Other End Users
-
3. Geography
- 3.1. Brazil
- 3.2. Argentina
- 3.3. Rest of South America
South America Compressor Industry Segmentation By Geography
- 1. Brazil
- 2. Argentina
- 3. Rest of South America
South America Compressor Industry Regional Market Share
Geographic Coverage of South America Compressor Industry
South America Compressor Industry REPORT HIGHLIGHTS
| Aspects | Details |
|---|---|
| Study Period | 2020-2034 |
| Base Year | 2025 |
| Estimated Year | 2026 |
| Forecast Period | 2026-2034 |
| Historical Period | 2020-2025 |
| Growth Rate | CAGR of 4% from 2020-2034 |
| Segmentation |
|
Table of Contents
- 1. Introduction
- 1.1. Research Scope
- 1.2. Market Segmentation
- 1.3. Research Objective
- 1.4. Definitions and Assumptions
- 2. Executive Summary
- 2.1. Market Snapshot
- 3. Market Dynamics
- 3.1. Market Drivers
- 3.2. Market Restrains
- 3.3. Market Trends
- 3.4. Market Opportunities
- 4. Market Factor Analysis
- 4.1. Porters Five Forces
- 4.1.1. Bargaining Power of Suppliers
- 4.1.2. Bargaining Power of Buyers
- 4.1.3. Threat of New Entrants
- 4.1.4. Threat of Substitutes
- 4.1.5. Competitive Rivalry
- 4.2. PESTEL analysis
- 4.3. BCG Analysis
- 4.3.1. Stars (High Growth, High Market Share)
- 4.3.2. Cash Cows (Low Growth, High Market Share)
- 4.3.3. Question Mark (High Growth, Low Market Share)
- 4.3.4. Dogs (Low Growth, Low Market Share)
- 4.4. Ansoff Matrix Analysis
- 4.5. Supply Chain Analysis
- 4.6. Regulatory Landscape
- 4.7. Current Market Potential and Opportunity Assessment (TAM–SAM–SOM Framework)
- 4.8. DMV Analyst Note
- 4.1. Porters Five Forces
- 5. Market Analysis, Insights and Forecast 2021-2033
- 5.1. Market Analysis, Insights and Forecast - by Type
- 5.1.1. Positive Diplacement
- 5.1.2. Dynamic
- 5.2. Market Analysis, Insights and Forecast - by End User
- 5.2.1. Oil and Gas Industry
- 5.2.2. Power Sector
- 5.2.3. Manufacturing Sector
- 5.2.4. Chemicals and Petrochemical Industry
- 5.2.5. Other End Users
- 5.3. Market Analysis, Insights and Forecast - by Geography
- 5.3.1. Brazil
- 5.3.2. Argentina
- 5.3.3. Rest of South America
- 5.4. Market Analysis, Insights and Forecast - by Region
- 5.4.1. Brazil
- 5.4.2. Argentina
- 5.4.3. Rest of South America
- 5.1. Market Analysis, Insights and Forecast - by Type
- 6. South America Compressor Industry Analysis, Insights and Forecast, 2021-2033
- 6.1. Market Analysis, Insights and Forecast - by Type
- 6.1.1. Positive Diplacement
- 6.1.2. Dynamic
- 6.2. Market Analysis, Insights and Forecast - by End User
- 6.2.1. Oil and Gas Industry
- 6.2.2. Power Sector
- 6.2.3. Manufacturing Sector
- 6.2.4. Chemicals and Petrochemical Industry
- 6.2.5. Other End Users
- 6.3. Market Analysis, Insights and Forecast - by Geography
- 6.3.1. Brazil
- 6.3.2. Argentina
- 6.3.3. Rest of South America
- 6.1. Market Analysis, Insights and Forecast - by Type
- 7. Brazil South America Compressor Industry Analysis, Insights and Forecast, 2020-2032
- 7.1. Market Analysis, Insights and Forecast - by Type
- 7.1.1. Positive Diplacement
- 7.1.2. Dynamic
- 7.2. Market Analysis, Insights and Forecast - by End User
- 7.2.1. Oil and Gas Industry
- 7.2.2. Power Sector
- 7.2.3. Manufacturing Sector
- 7.2.4. Chemicals and Petrochemical Industry
- 7.2.5. Other End Users
- 7.3. Market Analysis, Insights and Forecast - by Geography
- 7.3.1. Brazil
- 7.3.2. Argentina
- 7.3.3. Rest of South America
- 7.1. Market Analysis, Insights and Forecast - by Type
- 8. Argentina South America Compressor Industry Analysis, Insights and Forecast, 2020-2032
- 8.1. Market Analysis, Insights and Forecast - by Type
- 8.1.1. Positive Diplacement
- 8.1.2. Dynamic
- 8.2. Market Analysis, Insights and Forecast - by End User
- 8.2.1. Oil and Gas Industry
- 8.2.2. Power Sector
- 8.2.3. Manufacturing Sector
- 8.2.4. Chemicals and Petrochemical Industry
- 8.2.5. Other End Users
- 8.3. Market Analysis, Insights and Forecast - by Geography
- 8.3.1. Brazil
- 8.3.2. Argentina
- 8.3.3. Rest of South America
- 8.1. Market Analysis, Insights and Forecast - by Type
- 9. Rest of South America South America Compressor Industry Analysis, Insights and Forecast, 2020-2032
- 9.1. Market Analysis, Insights and Forecast - by Type
- 9.1.1. Positive Diplacement
- 9.1.2. Dynamic
- 9.2. Market Analysis, Insights and Forecast - by End User
- 9.2.1. Oil and Gas Industry
- 9.2.2. Power Sector
- 9.2.3. Manufacturing Sector
- 9.2.4. Chemicals and Petrochemical Industry
- 9.2.5. Other End Users
- 9.3. Market Analysis, Insights and Forecast - by Geography
- 9.3.1. Brazil
- 9.3.2. Argentina
- 9.3.3. Rest of South America
- 9.1. Market Analysis, Insights and Forecast - by Type
- 10. Competitive Analysis
- 10.1. Company Profiles
- 10.1.1 Trane Technologies PLC
- 10.1.1.1. Company Overview
- 10.1.1.2. Products
- 10.1.1.3. Company Financials
- 10.1.1.4. SWOT Analysis
- 10.1.2 Ebara Corporation
- 10.1.2.1. Company Overview
- 10.1.2.2. Products
- 10.1.2.3. Company Financials
- 10.1.2.4. SWOT Analysis
- 10.1.3 ELGI Equipments Ltd*List Not Exhaustive
- 10.1.3.1. Company Overview
- 10.1.3.2. Products
- 10.1.3.3. Company Financials
- 10.1.3.4. SWOT Analysis
- 10.1.4 Atlas Copco AB
- 10.1.4.1. Company Overview
- 10.1.4.2. Products
- 10.1.4.3. Company Financials
- 10.1.4.4. SWOT Analysis
- 10.1.5 Baker Hughes Co
- 10.1.5.1. Company Overview
- 10.1.5.2. Products
- 10.1.5.3. Company Financials
- 10.1.5.4. SWOT Analysis
- 10.1.6 Aerzener Maschinenfabrik GmbH
- 10.1.6.1. Company Overview
- 10.1.6.2. Products
- 10.1.6.3. Company Financials
- 10.1.6.4. SWOT Analysis
- 10.1.7 Siemens AG
- 10.1.7.1. Company Overview
- 10.1.7.2. Products
- 10.1.7.3. Company Financials
- 10.1.7.4. SWOT Analysis
- 10.1.8 Schulz S A
- 10.1.8.1. Company Overview
- 10.1.8.2. Products
- 10.1.8.3. Company Financials
- 10.1.8.4. SWOT Analysis
- 10.1.9 General Electric Company
- 10.1.9.1. Company Overview
- 10.1.9.2. Products
- 10.1.9.3. Company Financials
- 10.1.9.4. SWOT Analysis
- 10.1.1 Trane Technologies PLC
- 10.2. Market Entropy
- 10.2.1 Company's Key Areas Served
- 10.2.2 Recent Developments
- 10.3. Company Market Share Analysis 2025
- 10.3.1 Top 5 Companies Market Share Analysis
- 10.3.2 Top 3 Companies Market Share Analysis
- 10.4. List of Potential Customers
- 11. Research Methodology
List of Figures
- Figure 1: South America Compressor Industry Revenue Breakdown (million, %) by Product 2025 & 2033
- Figure 2: South America Compressor Industry Share (%) by Company 2025
List of Tables
- Table 1: South America Compressor Industry Revenue million Forecast, by Type 2020 & 2033
- Table 2: South America Compressor Industry Volume K Units Forecast, by Type 2020 & 2033
- Table 3: South America Compressor Industry Revenue million Forecast, by End User 2020 & 2033
- Table 4: South America Compressor Industry Volume K Units Forecast, by End User 2020 & 2033
- Table 5: South America Compressor Industry Revenue million Forecast, by Geography 2020 & 2033
- Table 6: South America Compressor Industry Volume K Units Forecast, by Geography 2020 & 2033
- Table 7: South America Compressor Industry Revenue million Forecast, by Region 2020 & 2033
- Table 8: South America Compressor Industry Volume K Units Forecast, by Region 2020 & 2033
- Table 9: South America Compressor Industry Revenue million Forecast, by Type 2020 & 2033
- Table 10: South America Compressor Industry Volume K Units Forecast, by Type 2020 & 2033
- Table 11: South America Compressor Industry Revenue million Forecast, by End User 2020 & 2033
- Table 12: South America Compressor Industry Volume K Units Forecast, by End User 2020 & 2033
- Table 13: South America Compressor Industry Revenue million Forecast, by Geography 2020 & 2033
- Table 14: South America Compressor Industry Volume K Units Forecast, by Geography 2020 & 2033
- Table 15: South America Compressor Industry Revenue million Forecast, by Country 2020 & 2033
- Table 16: South America Compressor Industry Volume K Units Forecast, by Country 2020 & 2033
- Table 17: South America Compressor Industry Revenue million Forecast, by Type 2020 & 2033
- Table 18: South America Compressor Industry Volume K Units Forecast, by Type 2020 & 2033
- Table 19: South America Compressor Industry Revenue million Forecast, by End User 2020 & 2033
- Table 20: South America Compressor Industry Volume K Units Forecast, by End User 2020 & 2033
- Table 21: South America Compressor Industry Revenue million Forecast, by Geography 2020 & 2033
- Table 22: South America Compressor Industry Volume K Units Forecast, by Geography 2020 & 2033
- Table 23: South America Compressor Industry Revenue million Forecast, by Country 2020 & 2033
- Table 24: South America Compressor Industry Volume K Units Forecast, by Country 2020 & 2033
- Table 25: South America Compressor Industry Revenue million Forecast, by Type 2020 & 2033
- Table 26: South America Compressor Industry Volume K Units Forecast, by Type 2020 & 2033
- Table 27: South America Compressor Industry Revenue million Forecast, by End User 2020 & 2033
- Table 28: South America Compressor Industry Volume K Units Forecast, by End User 2020 & 2033
- Table 29: South America Compressor Industry Revenue million Forecast, by Geography 2020 & 2033
- Table 30: South America Compressor Industry Volume K Units Forecast, by Geography 2020 & 2033
- Table 31: South America Compressor Industry Revenue million Forecast, by Country 2020 & 2033
- Table 32: South America Compressor Industry Volume K Units Forecast, by Country 2020 & 2033
Frequently Asked Questions
1. What is the projected Compound Annual Growth Rate (CAGR) of the South America Compressor Industry?
The projected CAGR is approximately 4%.
2. Which companies are prominent players in the South America Compressor Industry?
Key companies in the market include Trane Technologies PLC, Ebara Corporation, ELGI Equipments Ltd*List Not Exhaustive, Atlas Copco AB, Baker Hughes Co, Aerzener Maschinenfabrik GmbH, Siemens AG, Schulz S A, General Electric Company.
3. What are the main segments of the South America Compressor Industry?
The market segments include Type, End User, Geography.
4. Can you provide details about the market size?
The market size is estimated to be USD 1445.4 million as of 2022.
5. What are some drivers contributing to market growth?
4.; Growing Oil and Gas Industry4.; Rapid Growth in the Industrial Sector.
6. What are the notable trends driving market growth?
Oil and Gas Industry Segment Expected to Dominate the Market.
7. Are there any restraints impacting market growth?
4.; Fluctuation in Oil and Gas Prices.
8. Can you provide examples of recent developments in the market?
September 2022: YPF and Petronas signed a deal to build a liquefied natural gas (LNG) plant and a pipeline to transport the fuel. The project's initial investment is estimated at around USD 10 billion. It is expected to have a capacity of a power output of 5 million tonnes of LNG during the first year of operation.
9. What pricing options are available for accessing the report?
Pricing options include single-user, multi-user, and enterprise licenses priced at USD 4750, USD 5250, and USD 8750 respectively.
10. Is the market size provided in terms of value or volume?
The market size is provided in terms of value, measured in million and volume, measured in K Units.
11. Are there any specific market keywords associated with the report?
Yes, the market keyword associated with the report is "South America Compressor Industry," which aids in identifying and referencing the specific market segment covered.
12. How do I determine which pricing option suits my needs best?
The pricing options vary based on user requirements and access needs. Individual users may opt for single-user licenses, while businesses requiring broader access may choose multi-user or enterprise licenses for cost-effective access to the report.
13. Are there any additional resources or data provided in the South America Compressor Industry report?
While the report offers comprehensive insights, it's advisable to review the specific contents or supplementary materials provided to ascertain if additional resources or data are available.
14. How can I stay updated on further developments or reports in the South America Compressor Industry?
To stay informed about further developments, trends, and reports in the South America Compressor Industry, consider subscribing to industry newsletters, following relevant companies and organizations, or regularly checking reputable industry news sources and publications.
Methodology
Step 1 - Identification of Relevant Samples Size from Population Database


Step 2 - Approaches for Defining Global Market Size (Value, Volume* & Price*)

Note*: In applicable scenarios
Step 3 - Data Sources
Primary Research
- Web Analytics
- Survey Reports
- Research Institute
- Latest Research Reports
- Opinion Leaders
Secondary Research
- Annual Reports
- White Paper
- Latest Press Release
- Industry Association
- Paid Database
- Investor Presentations

Step 4 - Data Triangulation
Involves using different sources of information in order to increase the validity of a study
These sources are likely to be stakeholders in a program - participants, other researchers, program staff, other community members, and so on.
Then we put all data in single framework & apply various statistical tools to find out the dynamic on the market.
During the analysis stage, feedback from the stakeholder groups would be compared to determine areas of agreement as well as areas of divergence