

Key Insights
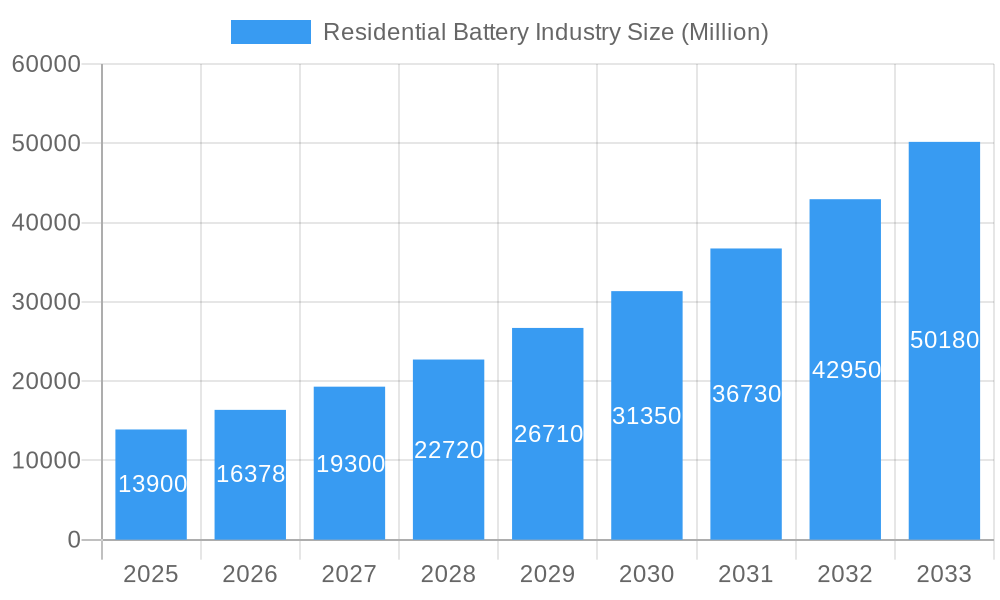
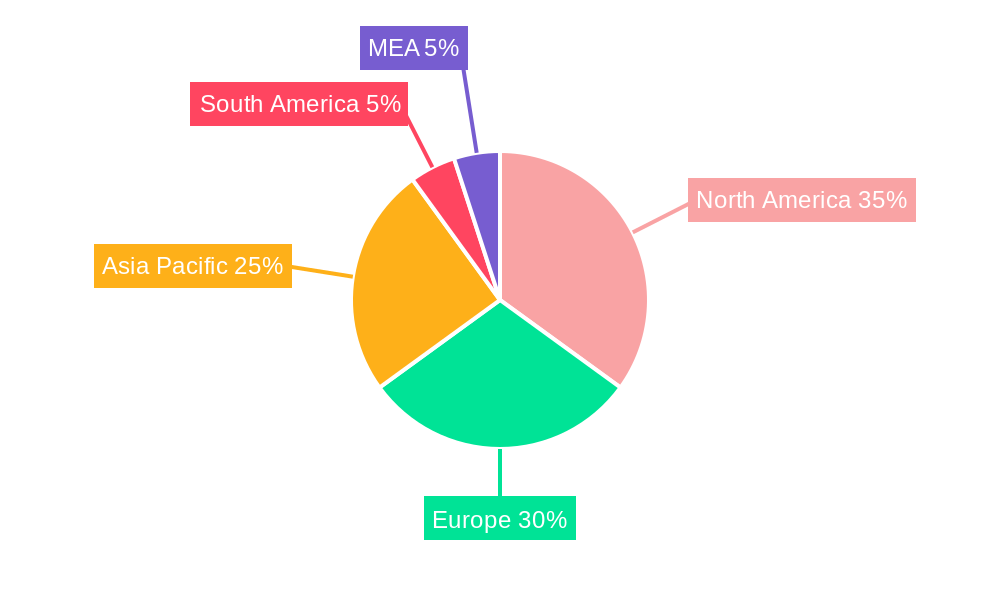
The residential battery storage market, valued at $17.4 billion in the 2025 base year, is poised for significant expansion. Projections indicate a Compound Annual Growth Rate (CAGR) of 10.9% from 2025 to 2033. This robust growth is propelled by escalating electricity prices, heightened concerns regarding grid reliability, and the increasing integration of residential renewable energy solutions, such as solar photovoltaic (PV) systems. Consumers are prioritizing energy independence and cost-efficiency, driving demand for residential battery storage. Lithium-ion batteries are the dominant technology, owing to their superior energy density and longevity. However, lead-acid batteries maintain a niche due to their lower upfront investment, catering to specific application needs. Geographically, North America and Europe are leading adoption, supported by favorable government incentives and elevated consumer awareness. The Asia-Pacific region presents substantial growth potential, fueled by rapid urbanization and the expanding renewable energy sector in key economies like China, Japan, and India. While high initial investment costs and localized awareness gaps pose challenges, continuous technological advancements, decreasing battery costs, and expanding distribution channels are expected to mitigate these barriers, ensuring sustained market expansion.

Residential Battery Industry Market Size (In Billion)
The competitive environment is characterized by intense activity from leading manufacturers including BYD, Samsung SDI, LG Energy Solution, and Tesla. These companies are actively investing in research and development, pursuing strategic alliances, mergers, and acquisitions, and innovating product offerings. Key areas of focus include enhancing battery efficiency, extending operational lifespans, and delivering integrated solutions that combine battery storage with solar PV and intelligent home energy management systems. The market's growth trajectory is expected to remain strong, particularly in regions with supportive regulatory frameworks and rising energy costs, fostering widespread adoption of residential energy storage solutions throughout the coming decade.
Residential Battery Industry Company Market Share
Residential Battery Industry Market Report: 2019-2033 Forecast
This comprehensive report provides a detailed analysis of the Residential Battery Industry, offering invaluable insights for stakeholders seeking to navigate this rapidly evolving market. Covering the period from 2019 to 2033, with a base year of 2025 and a forecast period spanning 2025-2033, this report leverages extensive data analysis and expert insights to deliver a clear picture of market trends, opportunities, and challenges. The global residential battery market is projected to reach xx Million by 2033, driven by factors such as increasing energy prices and growing demand for energy independence. This report delves into the key segments – Lithium-ion, Lead-acid, and Others – providing detailed forecasts for each, along with analysis of leading players including BYD Co Ltd, Amara Raja Batteries Ltd, Samsung SDI Co Ltd, and Tesla Inc.
Residential Battery Industry Market Composition & Trends
The residential battery market exhibits moderate concentration, with a few major players commanding significant market share, while numerous smaller players compete in niche segments. The market is experiencing rapid innovation driven by advancements in battery chemistry, energy density, and safety features. Stringent environmental regulations globally incentivize the adoption of residential battery systems, further shaping market dynamics. Substitute products such as diesel generators face increasing competition due to cost and environmental concerns. The end-user profile is predominantly comprised of homeowners seeking energy independence and cost savings, with a growing segment of businesses and communities also adopting these systems. Significant M&A activity has been observed in recent years, with deal values exceeding xx Million in the last five years, indicating consolidation and strategic investments within the industry.
- Market Share Distribution (2024): Lithium-ion batteries hold approximately 70% of the market share, with Lead-acid batteries at 20%, and other types at 10%.
- Top 5 Companies' Market Share (2024): Tesla Inc (25%), BYD Co Ltd (20%), LG Energy Solution Ltd (15%), Samsung SDI Co Ltd (10%), Panasonic Corporation (8%).
- M&A Activity (2019-2024): A total of xx M&A deals were recorded, with an aggregate value of xx Million.
Residential Battery Industry Industry Evolution
The residential battery market has witnessed substantial growth during the historical period (2019-2024), primarily fueled by decreasing battery costs and increasing consumer awareness of renewable energy solutions. The annual growth rate (CAGR) during this period was approximately xx%, exceeding initial projections. Technological advancements, especially in Lithium-ion battery technology, have played a crucial role, improving energy density, lifespan, and safety features. Consumer demands are shifting towards integrated systems offering smart home integration, advanced monitoring, and improved safety. The adoption rate of residential batteries is increasing steadily, with an estimated xx Million units installed globally in 2024. This positive trajectory is expected to continue throughout the forecast period (2025-2033), driven by supportive government policies and increasing concerns about energy security and climate change. The CAGR during the forecast period is estimated to be xx%.
Leading Regions, Countries, or Segments in Residential Battery Industry
The North American region holds the leading position in the residential battery market, particularly in the United States, driven by supportive government policies, such as tax credits and rebates for renewable energy installations. Within the product types, Lithium-ion batteries dominate due to their higher energy density, longer lifespan, and improved performance compared to lead-acid batteries. The dominance of lithium-ion batteries is further strengthened by continuous technological advancements and decreasing production costs.
Key Drivers for North American Dominance:
- Government Incentives: Significant tax credits and rebates for residential solar and battery installations.
- High Electricity Prices: Incentivizing homeowners to invest in self-sufficient energy systems.
- Advanced Infrastructure: Existing robust electricity grid facilitates the integration of residential batteries.
Key Drivers for Lithium-ion Battery Dominance:
- Technological Advancements: Higher energy density, longer lifespan, and improved safety features.
- Cost Reduction: Mass production and economies of scale have significantly lowered the cost of lithium-ion batteries.
- Improved Performance: Lithium-ion batteries offer superior performance in terms of charge/discharge cycles and efficiency.
Residential Battery Industry Product Innovations
Recent innovations in residential battery systems include advancements in battery chemistry (e.g., solid-state batteries), improved thermal management systems, and integrated smart home functionalities, such as remote monitoring and control. These advancements enhance battery performance, safety, and usability, leading to increased consumer adoption. Unique selling propositions include increased energy storage capacity, longer lifespans, enhanced safety features, and seamless integration with smart home ecosystems. These innovations are key to driving further market growth.
Propelling Factors for Residential Battery Industry Growth
The residential battery market is propelled by a confluence of technological, economic, and regulatory factors. Technological advancements, particularly in battery chemistry and energy storage capacity, are driving down costs and improving performance. Rising electricity prices and increasing concerns about energy security are making residential batteries an economically viable option for many homeowners. Government policies, such as tax incentives and feed-in tariffs, are further accelerating market adoption. The growing awareness of climate change and the desire for sustainable energy solutions also significantly contribute to the industry's growth.
Obstacles in the Residential Battery Industry Market
Despite its growth potential, the residential battery market faces several challenges. Regulatory uncertainties and variations in standards across different regions can hinder market expansion. Supply chain disruptions, particularly for critical battery raw materials, can impact production and pricing. Intense competition from established players and emerging companies creates price pressures and necessitates continuous innovation. Furthermore, the high upfront cost of residential battery systems remains a barrier for some consumers.
Future Opportunities in Residential Battery Industry
Future opportunities in the residential battery market lie in emerging markets with significant growth potential, the development of advanced battery technologies such as solid-state batteries, and the integration of residential batteries into broader smart grid solutions. The increasing penetration of renewable energy sources, coupled with the rising demand for energy storage solutions, is expected to create significant opportunities for growth. Moreover, advancements in battery management systems and improved energy efficiency will further enhance market potential.
Major Players in the Residential Battery Industry Ecosystem
Key Developments in Residential Battery Industry Industry
- 2022 Q4: Tesla announces significant expansion of its energy storage product line.
- 2023 Q1: LG Energy Solution partners with a major solar installer to offer bundled residential solar and battery solutions.
- 2023 Q2: New regulations in several European countries incentivize residential battery installation.
- 2024 Q1: BYD announces a new, higher-capacity residential battery with improved lifespan.
- 2024 Q3: Samsung SDI launches a new solid-state battery prototype for residential applications.
Strategic Residential Battery Industry Market Forecast
The residential battery market is poised for significant growth in the coming years, driven by technological advancements, supportive government policies, and rising consumer demand for renewable energy solutions. The forecast period (2025-2033) is expected to witness continued expansion, with the market size exceeding xx Million. Opportunities exist in both developed and emerging markets, particularly in regions with ambitious renewable energy targets and rising electricity costs. Continued innovation in battery technology and the development of integrated energy solutions will shape the future of the residential battery market.
Residential Battery Industry Segmentation
-
1. Type
- 1.1. Lithium-ion Battery
- 1.2. Lead-acid Battery
- 1.3. Others Types
Residential Battery Industry Segmentation By Geography
- 1. North America
- 2. Asia Pacific
- 3. Europe
- 4. South America
- 5. Middle East and Africa
Residential Battery Industry Regional Market Share
Geographic Coverage of Residential Battery Industry
Residential Battery Industry REPORT HIGHLIGHTS
| Aspects | Details |
|---|---|
| Study Period | 2020-2034 |
| Base Year | 2025 |
| Estimated Year | 2026 |
| Forecast Period | 2026-2034 |
| Historical Period | 2020-2025 |
| Growth Rate | CAGR of 10.9% from 2020-2034 |
| Segmentation |
|
Table of Contents
- 1. Introduction
- 1.1. Research Scope
- 1.2. Market Segmentation
- 1.3. Research Objective
- 1.4. Definitions and Assumptions
- 2. Executive Summary
- 2.1. Market Snapshot
- 3. Market Dynamics
- 3.1. Market Drivers
- 3.2. Market Restrains
- 3.3. Market Trends
- 3.4. Market Opportunities
- 4. Market Factor Analysis
- 4.1. Porters Five Forces
- 4.1.1. Bargaining Power of Suppliers
- 4.1.2. Bargaining Power of Buyers
- 4.1.3. Threat of New Entrants
- 4.1.4. Threat of Substitutes
- 4.1.5. Competitive Rivalry
- 4.2. PESTEL analysis
- 4.3. BCG Analysis
- 4.3.1. Stars (High Growth, High Market Share)
- 4.3.2. Cash Cows (Low Growth, High Market Share)
- 4.3.3. Question Mark (High Growth, Low Market Share)
- 4.3.4. Dogs (Low Growth, Low Market Share)
- 4.4. Ansoff Matrix Analysis
- 4.5. Supply Chain Analysis
- 4.6. Regulatory Landscape
- 4.7. Current Market Potential and Opportunity Assessment (TAM–SAM–SOM Framework)
- 4.8. DMV Analyst Note
- 4.1. Porters Five Forces
- 5. Market Analysis, Insights and Forecast 2021-2033
- 5.1. Market Analysis, Insights and Forecast - by Type
- 5.1.1. Lithium-ion Battery
- 5.1.2. Lead-acid Battery
- 5.1.3. Others Types
- 5.2. Market Analysis, Insights and Forecast - by Region
- 5.2.1. North America
- 5.2.2. Asia Pacific
- 5.2.3. Europe
- 5.2.4. South America
- 5.2.5. Middle East and Africa
- 5.1. Market Analysis, Insights and Forecast - by Type
- 6. Global Residential Battery Industry Analysis, Insights and Forecast, 2021-2033
- 6.1. Market Analysis, Insights and Forecast - by Type
- 6.1.1. Lithium-ion Battery
- 6.1.2. Lead-acid Battery
- 6.1.3. Others Types
- 6.1. Market Analysis, Insights and Forecast - by Type
- 7. North America Residential Battery Industry Analysis, Insights and Forecast, 2020-2032
- 7.1. Market Analysis, Insights and Forecast - by Type
- 7.1.1. Lithium-ion Battery
- 7.1.2. Lead-acid Battery
- 7.1.3. Others Types
- 7.1. Market Analysis, Insights and Forecast - by Type
- 8. Asia Pacific Residential Battery Industry Analysis, Insights and Forecast, 2020-2032
- 8.1. Market Analysis, Insights and Forecast - by Type
- 8.1.1. Lithium-ion Battery
- 8.1.2. Lead-acid Battery
- 8.1.3. Others Types
- 8.1. Market Analysis, Insights and Forecast - by Type
- 9. Europe Residential Battery Industry Analysis, Insights and Forecast, 2020-2032
- 9.1. Market Analysis, Insights and Forecast - by Type
- 9.1.1. Lithium-ion Battery
- 9.1.2. Lead-acid Battery
- 9.1.3. Others Types
- 9.1. Market Analysis, Insights and Forecast - by Type
- 10. South America Residential Battery Industry Analysis, Insights and Forecast, 2020-2032
- 10.1. Market Analysis, Insights and Forecast - by Type
- 10.1.1. Lithium-ion Battery
- 10.1.2. Lead-acid Battery
- 10.1.3. Others Types
- 10.1. Market Analysis, Insights and Forecast - by Type
- 11. Middle East and Africa Residential Battery Industry Analysis, Insights and Forecast, 2020-2032
- 11.1. Market Analysis, Insights and Forecast - by Type
- 11.1.1. Lithium-ion Battery
- 11.1.2. Lead-acid Battery
- 11.1.3. Others Types
- 11.1. Market Analysis, Insights and Forecast - by Type
- 12. Competitive Analysis
- 12.1. Company Profiles
- 12.1.1 BYD Co Ltd
- 12.1.1.1. Company Overview
- 12.1.1.2. Products
- 12.1.1.3. Company Financials
- 12.1.1.4. SWOT Analysis
- 12.1.2 Amara Raja Batteries Ltd
- 12.1.2.1. Company Overview
- 12.1.2.2. Products
- 12.1.2.3. Company Financials
- 12.1.2.4. SWOT Analysis
- 12.1.3 Samsung SDI Co Ltd
- 12.1.3.1. Company Overview
- 12.1.3.2. Products
- 12.1.3.3. Company Financials
- 12.1.3.4. SWOT Analysis
- 12.1.4 Luminous Power Technologies Pvt Ltd
- 12.1.4.1. Company Overview
- 12.1.4.2. Products
- 12.1.4.3. Company Financials
- 12.1.4.4. SWOT Analysis
- 12.1.5 LG Energy Solution Ltd
- 12.1.5.1. Company Overview
- 12.1.5.2. Products
- 12.1.5.3. Company Financials
- 12.1.5.4. SWOT Analysis
- 12.1.6 FIMER SpA
- 12.1.6.1. Company Overview
- 12.1.6.2. Products
- 12.1.6.3. Company Financials
- 12.1.6.4. SWOT Analysis
- 12.1.7 Siemens AG
- 12.1.7.1. Company Overview
- 12.1.7.2. Products
- 12.1.7.3. Company Financials
- 12.1.7.4. SWOT Analysis
- 12.1.8 Tesla Inc
- 12.1.8.1. Company Overview
- 12.1.8.2. Products
- 12.1.8.3. Company Financials
- 12.1.8.4. SWOT Analysis
- 12.1.9 Delta Electronics Ltd
- 12.1.9.1. Company Overview
- 12.1.9.2. Products
- 12.1.9.3. Company Financials
- 12.1.9.4. SWOT Analysis
- 12.1.10 NEC Corporation
- 12.1.10.1. Company Overview
- 12.1.10.2. Products
- 12.1.10.3. Company Financials
- 12.1.10.4. SWOT Analysis
- 12.1.11 Energizer Holding Inc
- 12.1.11.1. Company Overview
- 12.1.11.2. Products
- 12.1.11.3. Company Financials
- 12.1.11.4. SWOT Analysis
- 12.1.12 Duracell Inc
- 12.1.12.1. Company Overview
- 12.1.12.2. Products
- 12.1.12.3. Company Financials
- 12.1.12.4. SWOT Analysis
- 12.1.13 Panasonic Corporation
- 12.1.13.1. Company Overview
- 12.1.13.2. Products
- 12.1.13.3. Company Financials
- 12.1.13.4. SWOT Analysis
- 12.1.1 BYD Co Ltd
- 12.2. Market Entropy
- 12.2.1 Company's Key Areas Served
- 12.2.2 Recent Developments
- 12.3. Company Market Share Analysis 2025
- 12.3.1 Top 5 Companies Market Share Analysis
- 12.3.2 Top 3 Companies Market Share Analysis
- 12.4. List of Potential Customers
- 13. Research Methodology
List of Figures
- Figure 1: Global Residential Battery Industry Revenue Breakdown (billion, %) by Region 2025 & 2033
- Figure 2: Global Residential Battery Industry Volume Breakdown (K Tons, %) by Region 2025 & 2033
- Figure 3: North America Residential Battery Industry Revenue (billion), by Type 2025 & 2033
- Figure 4: North America Residential Battery Industry Volume (K Tons), by Type 2025 & 2033
- Figure 5: North America Residential Battery Industry Revenue Share (%), by Type 2025 & 2033
- Figure 6: North America Residential Battery Industry Volume Share (%), by Type 2025 & 2033
- Figure 7: North America Residential Battery Industry Revenue (billion), by Country 2025 & 2033
- Figure 8: North America Residential Battery Industry Volume (K Tons), by Country 2025 & 2033
- Figure 9: North America Residential Battery Industry Revenue Share (%), by Country 2025 & 2033
- Figure 10: North America Residential Battery Industry Volume Share (%), by Country 2025 & 2033
- Figure 11: Asia Pacific Residential Battery Industry Revenue (billion), by Type 2025 & 2033
- Figure 12: Asia Pacific Residential Battery Industry Volume (K Tons), by Type 2025 & 2033
- Figure 13: Asia Pacific Residential Battery Industry Revenue Share (%), by Type 2025 & 2033
- Figure 14: Asia Pacific Residential Battery Industry Volume Share (%), by Type 2025 & 2033
- Figure 15: Asia Pacific Residential Battery Industry Revenue (billion), by Country 2025 & 2033
- Figure 16: Asia Pacific Residential Battery Industry Volume (K Tons), by Country 2025 & 2033
- Figure 17: Asia Pacific Residential Battery Industry Revenue Share (%), by Country 2025 & 2033
- Figure 18: Asia Pacific Residential Battery Industry Volume Share (%), by Country 2025 & 2033
- Figure 19: Europe Residential Battery Industry Revenue (billion), by Type 2025 & 2033
- Figure 20: Europe Residential Battery Industry Volume (K Tons), by Type 2025 & 2033
- Figure 21: Europe Residential Battery Industry Revenue Share (%), by Type 2025 & 2033
- Figure 22: Europe Residential Battery Industry Volume Share (%), by Type 2025 & 2033
- Figure 23: Europe Residential Battery Industry Revenue (billion), by Country 2025 & 2033
- Figure 24: Europe Residential Battery Industry Volume (K Tons), by Country 2025 & 2033
- Figure 25: Europe Residential Battery Industry Revenue Share (%), by Country 2025 & 2033
- Figure 26: Europe Residential Battery Industry Volume Share (%), by Country 2025 & 2033
- Figure 27: South America Residential Battery Industry Revenue (billion), by Type 2025 & 2033
- Figure 28: South America Residential Battery Industry Volume (K Tons), by Type 2025 & 2033
- Figure 29: South America Residential Battery Industry Revenue Share (%), by Type 2025 & 2033
- Figure 30: South America Residential Battery Industry Volume Share (%), by Type 2025 & 2033
- Figure 31: South America Residential Battery Industry Revenue (billion), by Country 2025 & 2033
- Figure 32: South America Residential Battery Industry Volume (K Tons), by Country 2025 & 2033
- Figure 33: South America Residential Battery Industry Revenue Share (%), by Country 2025 & 2033
- Figure 34: South America Residential Battery Industry Volume Share (%), by Country 2025 & 2033
- Figure 35: Middle East and Africa Residential Battery Industry Revenue (billion), by Type 2025 & 2033
- Figure 36: Middle East and Africa Residential Battery Industry Volume (K Tons), by Type 2025 & 2033
- Figure 37: Middle East and Africa Residential Battery Industry Revenue Share (%), by Type 2025 & 2033
- Figure 38: Middle East and Africa Residential Battery Industry Volume Share (%), by Type 2025 & 2033
- Figure 39: Middle East and Africa Residential Battery Industry Revenue (billion), by Country 2025 & 2033
- Figure 40: Middle East and Africa Residential Battery Industry Volume (K Tons), by Country 2025 & 2033
- Figure 41: Middle East and Africa Residential Battery Industry Revenue Share (%), by Country 2025 & 2033
- Figure 42: Middle East and Africa Residential Battery Industry Volume Share (%), by Country 2025 & 2033
List of Tables
- Table 1: Global Residential Battery Industry Revenue billion Forecast, by Type 2020 & 2033
- Table 2: Global Residential Battery Industry Volume K Tons Forecast, by Type 2020 & 2033
- Table 3: Global Residential Battery Industry Revenue billion Forecast, by Region 2020 & 2033
- Table 4: Global Residential Battery Industry Volume K Tons Forecast, by Region 2020 & 2033
- Table 5: Global Residential Battery Industry Revenue billion Forecast, by Type 2020 & 2033
- Table 6: Global Residential Battery Industry Volume K Tons Forecast, by Type 2020 & 2033
- Table 7: Global Residential Battery Industry Revenue billion Forecast, by Country 2020 & 2033
- Table 8: Global Residential Battery Industry Volume K Tons Forecast, by Country 2020 & 2033
- Table 9: Global Residential Battery Industry Revenue billion Forecast, by Type 2020 & 2033
- Table 10: Global Residential Battery Industry Volume K Tons Forecast, by Type 2020 & 2033
- Table 11: Global Residential Battery Industry Revenue billion Forecast, by Country 2020 & 2033
- Table 12: Global Residential Battery Industry Volume K Tons Forecast, by Country 2020 & 2033
- Table 13: Global Residential Battery Industry Revenue billion Forecast, by Type 2020 & 2033
- Table 14: Global Residential Battery Industry Volume K Tons Forecast, by Type 2020 & 2033
- Table 15: Global Residential Battery Industry Revenue billion Forecast, by Country 2020 & 2033
- Table 16: Global Residential Battery Industry Volume K Tons Forecast, by Country 2020 & 2033
- Table 17: Global Residential Battery Industry Revenue billion Forecast, by Type 2020 & 2033
- Table 18: Global Residential Battery Industry Volume K Tons Forecast, by Type 2020 & 2033
- Table 19: Global Residential Battery Industry Revenue billion Forecast, by Country 2020 & 2033
- Table 20: Global Residential Battery Industry Volume K Tons Forecast, by Country 2020 & 2033
- Table 21: Global Residential Battery Industry Revenue billion Forecast, by Type 2020 & 2033
- Table 22: Global Residential Battery Industry Volume K Tons Forecast, by Type 2020 & 2033
- Table 23: Global Residential Battery Industry Revenue billion Forecast, by Country 2020 & 2033
- Table 24: Global Residential Battery Industry Volume K Tons Forecast, by Country 2020 & 2033
Frequently Asked Questions
1. What is the projected Compound Annual Growth Rate (CAGR) of the Residential Battery Industry?
The projected CAGR is approximately 10.9%.
2. Which companies are prominent players in the Residential Battery Industry?
Key companies in the market include BYD Co Ltd, Amara Raja Batteries Ltd, Samsung SDI Co Ltd, Luminous Power Technologies Pvt Ltd, LG Energy Solution Ltd, FIMER SpA, Siemens AG, Tesla Inc, Delta Electronics Ltd, NEC Corporation, Energizer Holding Inc, Duracell Inc, Panasonic Corporation.
3. What are the main segments of the Residential Battery Industry?
The market segments include Type.
4. Can you provide details about the market size?
The market size is estimated to be USD 17.4 billion as of 2022.
5. What are some drivers contributing to market growth?
4.; Increasing Investments in Water Treatment by Developing Countries4.; Growing Demand for the Various End-Use Sectors.
6. What are the notable trends driving market growth?
Lithium-ion Battery Segment Expected to Dominate the Market.
7. Are there any restraints impacting market growth?
4.; Availability of Cheap and Alternative Pumps.
8. Can you provide examples of recent developments in the market?
N/A
9. What pricing options are available for accessing the report?
Pricing options include single-user, multi-user, and enterprise licenses priced at USD 4750, USD 5250, and USD 8750 respectively.
10. Is the market size provided in terms of value or volume?
The market size is provided in terms of value, measured in billion and volume, measured in K Tons.
11. Are there any specific market keywords associated with the report?
Yes, the market keyword associated with the report is "Residential Battery Industry," which aids in identifying and referencing the specific market segment covered.
12. How do I determine which pricing option suits my needs best?
The pricing options vary based on user requirements and access needs. Individual users may opt for single-user licenses, while businesses requiring broader access may choose multi-user or enterprise licenses for cost-effective access to the report.
13. Are there any additional resources or data provided in the Residential Battery Industry report?
While the report offers comprehensive insights, it's advisable to review the specific contents or supplementary materials provided to ascertain if additional resources or data are available.
14. How can I stay updated on further developments or reports in the Residential Battery Industry?
To stay informed about further developments, trends, and reports in the Residential Battery Industry, consider subscribing to industry newsletters, following relevant companies and organizations, or regularly checking reputable industry news sources and publications.
Methodology
Step 1 - Identification of Relevant Samples Size from Population Database


Step 2 - Approaches for Defining Global Market Size (Value, Volume* & Price*)

Note*: In applicable scenarios
Step 3 - Data Sources
Primary Research
- Web Analytics
- Survey Reports
- Research Institute
- Latest Research Reports
- Opinion Leaders
Secondary Research
- Annual Reports
- White Paper
- Latest Press Release
- Industry Association
- Paid Database
- Investor Presentations

Step 4 - Data Triangulation
Involves using different sources of information in order to increase the validity of a study
These sources are likely to be stakeholders in a program - participants, other researchers, program staff, other community members, and so on.
Then we put all data in single framework & apply various statistical tools to find out the dynamic on the market.
During the analysis stage, feedback from the stakeholder groups would be compared to determine areas of agreement as well as areas of divergence