

Key Insights
The global pump jack market is experiencing robust growth, driven by the increasing demand for oil and gas extraction, particularly in regions with significant reserves. A compound annual growth rate (CAGR) exceeding 3.0% suggests a consistently expanding market, projected to reach a substantial value over the forecast period (2025-2033). Key market drivers include the rising global energy consumption, necessitating increased oil and gas production, coupled with ongoing investments in exploration and production activities across various regions. Technological advancements in pump jack design, focusing on efficiency and automation, further contribute to market expansion. The market is segmented by well type (vertical and horizontal) and location (onshore and offshore), with onshore operations currently dominating due to lower setup and operational costs. However, offshore applications are expected to witness significant growth in the coming years as deepwater exploration and production increase. Market restraints include fluctuating oil and gas prices, environmental regulations impacting drilling activities, and the increasing adoption of alternative energy sources. Major players like Baker Hughes, Halliburton, and Schlumberger are driving innovation and market consolidation through strategic partnerships and technological improvements. Regional analysis reveals strong growth in North America and the Asia-Pacific region, fueled by abundant resources and robust energy demand. Europe and the Middle East & Africa also contribute significantly to the market, albeit with varying growth trajectories influenced by regional geopolitical factors and resource availability.

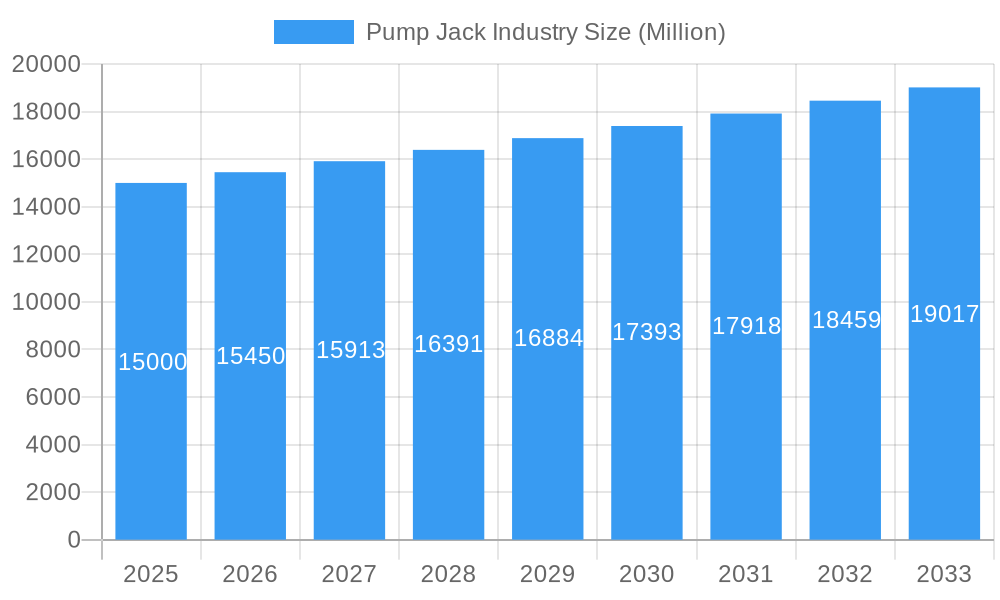
Pump Jack Industry Market Size (In Billion)
The competitive landscape is characterized by a mix of established multinational corporations and specialized regional players. These companies are constantly seeking to enhance their offerings through technological advancements, strategic acquisitions, and the expansion of service portfolios. The preference for efficient and reliable pump jacks is driving the demand for sophisticated technologies such as automated control systems, remote monitoring capabilities, and advanced materials that enhance durability and reduce maintenance needs. The ongoing exploration for new oil and gas reserves, coupled with the increasing focus on enhanced oil recovery techniques, is expected to further stimulate the growth of the pump jack market in the years to come. Understanding the interplay between these driving forces, technological advancements, and regional dynamics is essential for strategic decision-making in this dynamic market.
Pump Jack Industry Company Market Share
Pump Jack Industry Market Report: 2019-2033 Forecast
This comprehensive Pump Jack Industry market report provides an in-depth analysis of the global market, offering valuable insights for stakeholders seeking to understand current trends and forecast future growth. The report covers the period from 2019 to 2033, with 2025 serving as the base and estimated year. The forecast period extends from 2025 to 2033, while the historical period encompasses 2019-2024. The report’s detailed analysis includes market sizing, segmentation, competitive landscape, and future projections, offering a complete view of this dynamic industry. The total market value is predicted to reach xx Million by 2033.
Pump Jack Industry Market Composition & Trends
This section analyzes the competitive landscape of the Pump Jack Industry, encompassing market concentration, innovation, regulation, substitution, end-users, and mergers & acquisitions (M&A). The market is characterized by a moderate level of concentration, with the top five players holding approximately xx% of the market share in 2025. Key players are constantly innovating to improve efficiency and reduce operational costs, driven by the demand for sustainable and cost-effective oil and gas extraction. Stringent environmental regulations are impacting operations, pushing companies to adopt cleaner technologies. Substitute technologies, while present, are not yet a significant threat to the dominance of pump jacks. The primary end-users are oil and gas exploration and production companies, with a growing demand driven by the global energy consumption. Significant M&A activity, totaling an estimated xx Million in deal value from 2019-2024, has reshaped the competitive landscape.
- Market Share Distribution (2025): Baker Hughes: xx%; Halliburton: xx%; National-Oilwell Varco: xx%; Schlumberger: xx%; Others: xx%
- M&A Deal Value (2019-2024): xx Million
- Key Innovation Catalysts: Increased automation, improved efficiency, and reduced environmental impact.
- Regulatory Landscape: Stringent environmental regulations driving technological innovation.
Pump Jack Industry Industry Evolution
The Pump Jack Industry has witnessed significant evolution, marked by fluctuating market growth trajectories influenced by global oil and gas prices and technological advancements. From 2019 to 2024, the market experienced a compound annual growth rate (CAGR) of xx%, primarily driven by increasing oil and gas demand and exploration activities in emerging markets. Technological improvements, such as advanced materials and automation, have led to enhanced efficiency and reduced operational costs. However, the industry has also seen a shift in consumer demand towards more sustainable and environmentally friendly extraction methods. This has spurred innovation in areas like energy-efficient designs and reduced emissions technologies. The forecast period (2025-2033) anticipates a CAGR of xx%, driven by continued exploration activities and the adoption of newer technologies.
Leading Regions, Countries, or Segments in Pump Jack Industry
The North American region, particularly the United States, holds a leading position in the pump jack industry, accounting for approximately xx% of the global market share in 2025. This dominance is attributed to several factors:
Onshore Applications: Significant onshore oil and gas reserves and robust exploration activities.
Technological Advancements: High concentration of research and development activities.
Investment Trends: Substantial investments in oil and gas exploration and production.
Regulatory Support: Relatively supportive regulatory environment for oil and gas production. The Middle East and Asia-Pacific regions are also experiencing significant growth, fueled by increasing energy demands and investments in exploration and production. In terms of well type, the horizontal well segment is projected to witness higher growth due to its ability to access resources from previously unreachable areas.
Dominant Region (2025): North America (xx%)
Fastest Growing Segment (2025-2033): Horizontal Well Applications
Key Growth Drivers: Increased demand for energy, exploration and production investments, and technological advancements.
Pump Jack Industry Product Innovations
Recent innovations in pump jack technology focus on enhancing efficiency, reducing operational costs, and minimizing environmental impact. New designs utilize advanced materials for improved durability and longevity, while automated systems optimize operational parameters for increased efficiency and reduced downtime. The incorporation of smart sensors and data analytics allows for real-time monitoring and predictive maintenance, reducing unexpected failures. These advancements are aimed at improving the overall performance and competitiveness of pump jacks in the market.
Propelling Factors for Pump Jack Industry Growth
Several factors are driving the growth of the pump jack industry. Technological advancements, such as automation and improved materials, are leading to increased efficiency and lower operational costs. Economic factors, including increasing global energy demand and rising oil and gas prices, are creating a strong market for pump jacks. Governmental policies and regulations related to energy security are also stimulating market growth.
Obstacles in the Pump Jack Industry Market
The pump jack industry faces various challenges, including stringent environmental regulations that increase compliance costs and push for cleaner technologies. Supply chain disruptions, particularly the availability of raw materials and skilled labor, can impact production and delivery. Intense competition among major players, often leading to price wars, puts pressure on profitability. These challenges cumulatively represent a significant headwind to market growth.
Future Opportunities in Pump Jack Industry
Future opportunities lie in the exploration of unconventional oil and gas reserves, requiring more advanced pump jack technologies. Expanding into emerging markets with significant energy demands represents a major potential for growth. The development of more energy-efficient and environmentally friendly pump jack designs will be crucial for long-term sustainability.
Major Players in the Pump Jack Industry Ecosystem
- Baker Hughes Company
- Halliburton Company
- National-Oilwell Varco Inc
- Borets International Ltd
- Weatherford International Ltd
- Schlumberger Limited
- Dover Corp
- Weil-McLain (Shandong) Cast-Iron-Boiler Co Ltd
- Flotek Industries Inc
- Alkhorayef Commercial Co
Key Developments in Pump Jack Industry Industry
- 2022 Q3: Baker Hughes launched a new, energy-efficient pump jack model.
- 2023 Q1: Halliburton acquired a smaller pump jack manufacturer, expanding its market share.
- 2024 Q2: New environmental regulations were implemented, impacting the design and manufacturing of pump jacks. (Further specific developments with dates and impact can be added here.)
Strategic Pump Jack Industry Market Forecast
The pump jack industry is poised for continued growth, driven by ongoing technological advancements, increased energy demands, and exploration in new regions. The market is expected to witness a steady expansion in the forecast period, with significant opportunities for companies that innovate to meet evolving regulatory requirements and address sustainability concerns. The focus on automation, efficiency, and reduced environmental impact will be key factors determining market success in the coming years.
Pump Jack Industry Segmentation
-
1. Type
- 1.1. Vertical Well
- 1.2. Horizontal Well
-
2. Application
- 2.1. Offshore
- 2.2. Onshore
Pump Jack Industry Segmentation By Geography
- 1. North America
- 2. Asia Pacific
- 3. Europe
- 4. South America
- 5. Middle East and Africa
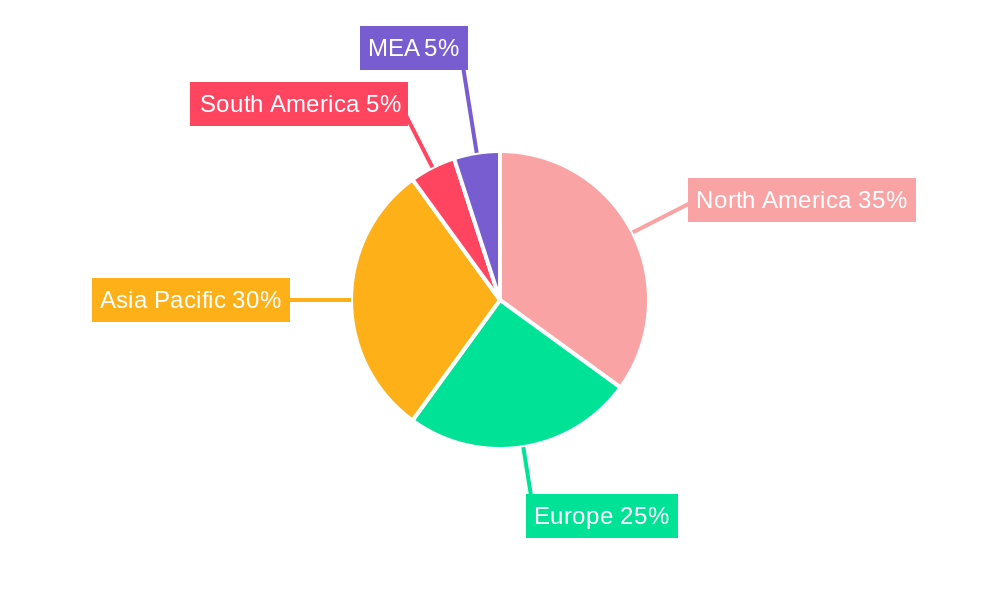
Pump Jack Industry Regional Market Share
Geographic Coverage of Pump Jack Industry
Pump Jack Industry REPORT HIGHLIGHTS
| Aspects | Details |
|---|---|
| Study Period | 2020-2034 |
| Base Year | 2025 |
| Estimated Year | 2026 |
| Forecast Period | 2026-2034 |
| Historical Period | 2020-2025 |
| Growth Rate | CAGR of 5.7% from 2020-2034 |
| Segmentation |
|
Table of Contents
- 1. Introduction
- 1.1. Research Scope
- 1.2. Market Segmentation
- 1.3. Research Objective
- 1.4. Definitions and Assumptions
- 2. Executive Summary
- 2.1. Market Snapshot
- 3. Market Dynamics
- 3.1. Market Drivers
- 3.2. Market Restrains
- 3.3. Market Trends
- 3.4. Market Opportunities
- 4. Market Factor Analysis
- 4.1. Porters Five Forces
- 4.1.1. Bargaining Power of Suppliers
- 4.1.2. Bargaining Power of Buyers
- 4.1.3. Threat of New Entrants
- 4.1.4. Threat of Substitutes
- 4.1.5. Competitive Rivalry
- 4.2. PESTEL analysis
- 4.3. BCG Analysis
- 4.3.1. Stars (High Growth, High Market Share)
- 4.3.2. Cash Cows (Low Growth, High Market Share)
- 4.3.3. Question Mark (High Growth, Low Market Share)
- 4.3.4. Dogs (Low Growth, Low Market Share)
- 4.4. Ansoff Matrix Analysis
- 4.5. Supply Chain Analysis
- 4.6. Regulatory Landscape
- 4.7. Current Market Potential and Opportunity Assessment (TAM–SAM–SOM Framework)
- 4.8. DMV Analyst Note
- 4.1. Porters Five Forces
- 5. Market Analysis, Insights and Forecast 2021-2033
- 5.1. Market Analysis, Insights and Forecast - by Type
- 5.1.1. Vertical Well
- 5.1.2. Horizontal Well
- 5.2. Market Analysis, Insights and Forecast - by Application
- 5.2.1. Offshore
- 5.2.2. Onshore
- 5.3. Market Analysis, Insights and Forecast - by Region
- 5.3.1. North America
- 5.3.2. Asia Pacific
- 5.3.3. Europe
- 5.3.4. South America
- 5.3.5. Middle East and Africa
- 5.1. Market Analysis, Insights and Forecast - by Type
- 6. Global Pump Jack Industry Analysis, Insights and Forecast, 2021-2033
- 6.1. Market Analysis, Insights and Forecast - by Type
- 6.1.1. Vertical Well
- 6.1.2. Horizontal Well
- 6.2. Market Analysis, Insights and Forecast - by Application
- 6.2.1. Offshore
- 6.2.2. Onshore
- 6.1. Market Analysis, Insights and Forecast - by Type
- 7. North America Pump Jack Industry Analysis, Insights and Forecast, 2020-2032
- 7.1. Market Analysis, Insights and Forecast - by Type
- 7.1.1. Vertical Well
- 7.1.2. Horizontal Well
- 7.2. Market Analysis, Insights and Forecast - by Application
- 7.2.1. Offshore
- 7.2.2. Onshore
- 7.1. Market Analysis, Insights and Forecast - by Type
- 8. Asia Pacific Pump Jack Industry Analysis, Insights and Forecast, 2020-2032
- 8.1. Market Analysis, Insights and Forecast - by Type
- 8.1.1. Vertical Well
- 8.1.2. Horizontal Well
- 8.2. Market Analysis, Insights and Forecast - by Application
- 8.2.1. Offshore
- 8.2.2. Onshore
- 8.1. Market Analysis, Insights and Forecast - by Type
- 9. Europe Pump Jack Industry Analysis, Insights and Forecast, 2020-2032
- 9.1. Market Analysis, Insights and Forecast - by Type
- 9.1.1. Vertical Well
- 9.1.2. Horizontal Well
- 9.2. Market Analysis, Insights and Forecast - by Application
- 9.2.1. Offshore
- 9.2.2. Onshore
- 9.1. Market Analysis, Insights and Forecast - by Type
- 10. South America Pump Jack Industry Analysis, Insights and Forecast, 2020-2032
- 10.1. Market Analysis, Insights and Forecast - by Type
- 10.1.1. Vertical Well
- 10.1.2. Horizontal Well
- 10.2. Market Analysis, Insights and Forecast - by Application
- 10.2.1. Offshore
- 10.2.2. Onshore
- 10.1. Market Analysis, Insights and Forecast - by Type
- 11. Middle East and Africa Pump Jack Industry Analysis, Insights and Forecast, 2020-2032
- 11.1. Market Analysis, Insights and Forecast - by Type
- 11.1.1. Vertical Well
- 11.1.2. Horizontal Well
- 11.2. Market Analysis, Insights and Forecast - by Application
- 11.2.1. Offshore
- 11.2.2. Onshore
- 11.1. Market Analysis, Insights and Forecast - by Type
- 12. Competitive Analysis
- 12.1. Company Profiles
- 12.1.1 Weil-McLain (Shandong) Cast-Iron-Boiler Co Ltd
- 12.1.1.1. Company Overview
- 12.1.1.2. Products
- 12.1.1.3. Company Financials
- 12.1.1.4. SWOT Analysis
- 12.1.2 Flotek Industries Inc
- 12.1.2.1. Company Overview
- 12.1.2.2. Products
- 12.1.2.3. Company Financials
- 12.1.2.4. SWOT Analysis
- 12.1.3 Alkhorayef Commercial Co
- 12.1.3.1. Company Overview
- 12.1.3.2. Products
- 12.1.3.3. Company Financials
- 12.1.3.4. SWOT Analysis
- 12.1.4 Baker Hughes Company
- 12.1.4.1. Company Overview
- 12.1.4.2. Products
- 12.1.4.3. Company Financials
- 12.1.4.4. SWOT Analysis
- 12.1.5 Halliburton Company
- 12.1.5.1. Company Overview
- 12.1.5.2. Products
- 12.1.5.3. Company Financials
- 12.1.5.4. SWOT Analysis
- 12.1.6 National-Oilwell Varco Inc
- 12.1.6.1. Company Overview
- 12.1.6.2. Products
- 12.1.6.3. Company Financials
- 12.1.6.4. SWOT Analysis
- 12.1.7 Borets International Ltd
- 12.1.7.1. Company Overview
- 12.1.7.2. Products
- 12.1.7.3. Company Financials
- 12.1.7.4. SWOT Analysis
- 12.1.8 Weatherford International Ltd
- 12.1.8.1. Company Overview
- 12.1.8.2. Products
- 12.1.8.3. Company Financials
- 12.1.8.4. SWOT Analysis
- 12.1.9 Schlumberger Limited
- 12.1.9.1. Company Overview
- 12.1.9.2. Products
- 12.1.9.3. Company Financials
- 12.1.9.4. SWOT Analysis
- 12.1.10 Dover Corp
- 12.1.10.1. Company Overview
- 12.1.10.2. Products
- 12.1.10.3. Company Financials
- 12.1.10.4. SWOT Analysis
- 12.1.1 Weil-McLain (Shandong) Cast-Iron-Boiler Co Ltd
- 12.2. Market Entropy
- 12.2.1 Company's Key Areas Served
- 12.2.2 Recent Developments
- 12.3. Company Market Share Analysis 2025
- 12.3.1 Top 5 Companies Market Share Analysis
- 12.3.2 Top 3 Companies Market Share Analysis
- 12.4. List of Potential Customers
- 13. Research Methodology
List of Figures
- Figure 1: Global Pump Jack Industry Revenue Breakdown (million, %) by Region 2025 & 2033
- Figure 2: North America Pump Jack Industry Revenue (million), by Type 2025 & 2033
- Figure 3: North America Pump Jack Industry Revenue Share (%), by Type 2025 & 2033
- Figure 4: North America Pump Jack Industry Revenue (million), by Application 2025 & 2033
- Figure 5: North America Pump Jack Industry Revenue Share (%), by Application 2025 & 2033
- Figure 6: North America Pump Jack Industry Revenue (million), by Country 2025 & 2033
- Figure 7: North America Pump Jack Industry Revenue Share (%), by Country 2025 & 2033
- Figure 8: Asia Pacific Pump Jack Industry Revenue (million), by Type 2025 & 2033
- Figure 9: Asia Pacific Pump Jack Industry Revenue Share (%), by Type 2025 & 2033
- Figure 10: Asia Pacific Pump Jack Industry Revenue (million), by Application 2025 & 2033
- Figure 11: Asia Pacific Pump Jack Industry Revenue Share (%), by Application 2025 & 2033
- Figure 12: Asia Pacific Pump Jack Industry Revenue (million), by Country 2025 & 2033
- Figure 13: Asia Pacific Pump Jack Industry Revenue Share (%), by Country 2025 & 2033
- Figure 14: Europe Pump Jack Industry Revenue (million), by Type 2025 & 2033
- Figure 15: Europe Pump Jack Industry Revenue Share (%), by Type 2025 & 2033
- Figure 16: Europe Pump Jack Industry Revenue (million), by Application 2025 & 2033
- Figure 17: Europe Pump Jack Industry Revenue Share (%), by Application 2025 & 2033
- Figure 18: Europe Pump Jack Industry Revenue (million), by Country 2025 & 2033
- Figure 19: Europe Pump Jack Industry Revenue Share (%), by Country 2025 & 2033
- Figure 20: South America Pump Jack Industry Revenue (million), by Type 2025 & 2033
- Figure 21: South America Pump Jack Industry Revenue Share (%), by Type 2025 & 2033
- Figure 22: South America Pump Jack Industry Revenue (million), by Application 2025 & 2033
- Figure 23: South America Pump Jack Industry Revenue Share (%), by Application 2025 & 2033
- Figure 24: South America Pump Jack Industry Revenue (million), by Country 2025 & 2033
- Figure 25: South America Pump Jack Industry Revenue Share (%), by Country 2025 & 2033
- Figure 26: Middle East and Africa Pump Jack Industry Revenue (million), by Type 2025 & 2033
- Figure 27: Middle East and Africa Pump Jack Industry Revenue Share (%), by Type 2025 & 2033
- Figure 28: Middle East and Africa Pump Jack Industry Revenue (million), by Application 2025 & 2033
- Figure 29: Middle East and Africa Pump Jack Industry Revenue Share (%), by Application 2025 & 2033
- Figure 30: Middle East and Africa Pump Jack Industry Revenue (million), by Country 2025 & 2033
- Figure 31: Middle East and Africa Pump Jack Industry Revenue Share (%), by Country 2025 & 2033
List of Tables
- Table 1: Global Pump Jack Industry Revenue million Forecast, by Type 2020 & 2033
- Table 2: Global Pump Jack Industry Revenue million Forecast, by Application 2020 & 2033
- Table 3: Global Pump Jack Industry Revenue million Forecast, by Region 2020 & 2033
- Table 4: Global Pump Jack Industry Revenue million Forecast, by Type 2020 & 2033
- Table 5: Global Pump Jack Industry Revenue million Forecast, by Application 2020 & 2033
- Table 6: Global Pump Jack Industry Revenue million Forecast, by Country 2020 & 2033
- Table 7: Global Pump Jack Industry Revenue million Forecast, by Type 2020 & 2033
- Table 8: Global Pump Jack Industry Revenue million Forecast, by Application 2020 & 2033
- Table 9: Global Pump Jack Industry Revenue million Forecast, by Country 2020 & 2033
- Table 10: Global Pump Jack Industry Revenue million Forecast, by Type 2020 & 2033
- Table 11: Global Pump Jack Industry Revenue million Forecast, by Application 2020 & 2033
- Table 12: Global Pump Jack Industry Revenue million Forecast, by Country 2020 & 2033
- Table 13: Global Pump Jack Industry Revenue million Forecast, by Type 2020 & 2033
- Table 14: Global Pump Jack Industry Revenue million Forecast, by Application 2020 & 2033
- Table 15: Global Pump Jack Industry Revenue million Forecast, by Country 2020 & 2033
- Table 16: Global Pump Jack Industry Revenue million Forecast, by Type 2020 & 2033
- Table 17: Global Pump Jack Industry Revenue million Forecast, by Application 2020 & 2033
- Table 18: Global Pump Jack Industry Revenue million Forecast, by Country 2020 & 2033
Frequently Asked Questions
1. What is the projected Compound Annual Growth Rate (CAGR) of the Pump Jack Industry?
The projected CAGR is approximately 5.7%.
2. Which companies are prominent players in the Pump Jack Industry?
Key companies in the market include Weil-McLain (Shandong) Cast-Iron-Boiler Co Ltd, Flotek Industries Inc, Alkhorayef Commercial Co, Baker Hughes Company, Halliburton Company, National-Oilwell Varco Inc, Borets International Ltd, Weatherford International Ltd, Schlumberger Limited, Dover Corp.
3. What are the main segments of the Pump Jack Industry?
The market segments include Type, Application.
4. Can you provide details about the market size?
The market size is estimated to be USD 3687.6 million as of 2022.
5. What are some drivers contributing to market growth?
4.; Focus On Unconventional Resources4.; Global Energy Demand And Exploration Activities.
6. What are the notable trends driving market growth?
Onshore Application to Dominate the Market.
7. Are there any restraints impacting market growth?
4.; High Implementation Costs.
8. Can you provide examples of recent developments in the market?
N/A
9. What pricing options are available for accessing the report?
Pricing options include single-user, multi-user, and enterprise licenses priced at USD 4750, USD 5250, and USD 8750 respectively.
10. Is the market size provided in terms of value or volume?
The market size is provided in terms of value, measured in million.
11. Are there any specific market keywords associated with the report?
Yes, the market keyword associated with the report is "Pump Jack Industry," which aids in identifying and referencing the specific market segment covered.
12. How do I determine which pricing option suits my needs best?
The pricing options vary based on user requirements and access needs. Individual users may opt for single-user licenses, while businesses requiring broader access may choose multi-user or enterprise licenses for cost-effective access to the report.
13. Are there any additional resources or data provided in the Pump Jack Industry report?
While the report offers comprehensive insights, it's advisable to review the specific contents or supplementary materials provided to ascertain if additional resources or data are available.
14. How can I stay updated on further developments or reports in the Pump Jack Industry?
To stay informed about further developments, trends, and reports in the Pump Jack Industry, consider subscribing to industry newsletters, following relevant companies and organizations, or regularly checking reputable industry news sources and publications.
Methodology
Step 1 - Identification of Relevant Samples Size from Population Database


Step 2 - Approaches for Defining Global Market Size (Value, Volume* & Price*)

Note*: In applicable scenarios
Step 3 - Data Sources
Primary Research
- Web Analytics
- Survey Reports
- Research Institute
- Latest Research Reports
- Opinion Leaders
Secondary Research
- Annual Reports
- White Paper
- Latest Press Release
- Industry Association
- Paid Database
- Investor Presentations

Step 4 - Data Triangulation
Involves using different sources of information in order to increase the validity of a study
These sources are likely to be stakeholders in a program - participants, other researchers, program staff, other community members, and so on.
Then we put all data in single framework & apply various statistical tools to find out the dynamic on the market.
During the analysis stage, feedback from the stakeholder groups would be compared to determine areas of agreement as well as areas of divergence