

Key Insights
The global process gas compressor market, valued at approximately $6.3 billion in 2025, is projected to achieve robust expansion with a compound annual growth rate (CAGR) of 5.7% from 2025 to 2033. This growth is underpinned by escalating demand for natural gas in power generation and industrial sectors, alongside the flourishing chemical and oil & gas industries worldwide. Stringent environmental regulations mandating cleaner energy solutions are indirectly stimulating market growth by necessitating efficient gas compression technology. Innovations, including oil-free compressors for sensitive applications and enhanced efficiency, are also key contributors. While oil-injected compressors dominate due to cost-effectiveness, the oil-free segment is experiencing accelerated growth driven by stricter emission standards. North America and Europe currently lead market share, supported by developed industrial infrastructure and rigorous environmental policies. However, the Asia-Pacific region is poised for the highest growth rate, fueled by rapid industrialization and substantial energy infrastructure investments in China and India.
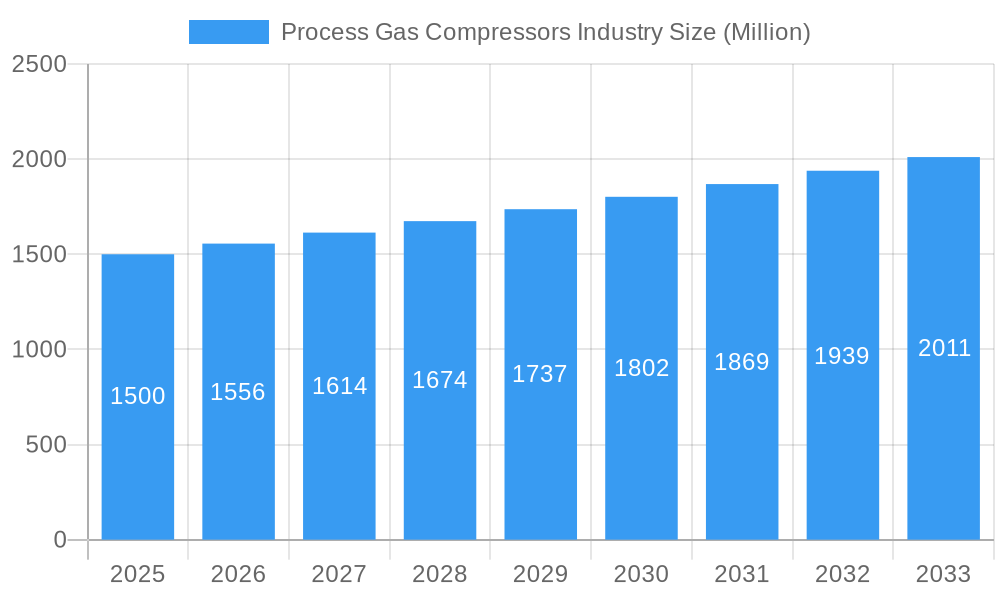
Process Gas Compressors Industry Market Size (In Billion)
Despite significant growth prospects, the market faces challenges, notably high initial investment costs which can impede adoption by smaller enterprises. Fluctuations in raw material prices and global economic volatility also pose potential restraints. Intense competition among leading providers such as Howden Group, Sullair LLC, and Ingersoll Rand Inc. necessitates ongoing innovation and cost optimization. Future market success will depend on overcoming these hurdles through technological advancements, strategic alliances, and targeted market penetration, especially in emerging economies. A sustained emphasis on sustainability and energy efficiency will likely dictate future technological trajectories and market segmentation within the process gas compressor industry.
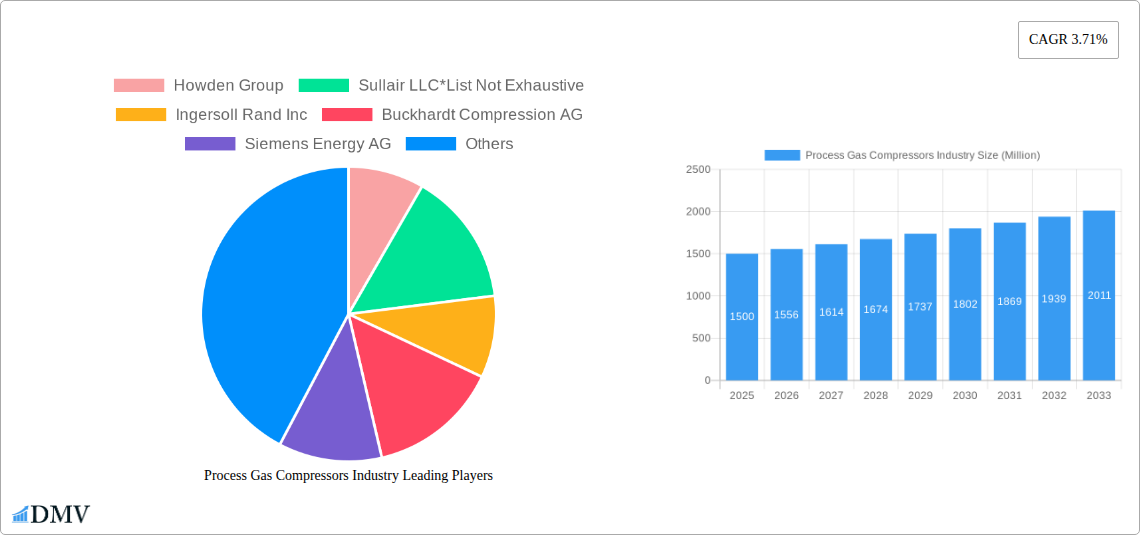
Process Gas Compressors Industry Company Market Share
Process Gas Compressors Industry: A Comprehensive Market Report (2019-2033)
This insightful report provides a comprehensive analysis of the Process Gas Compressors industry, offering a detailed overview of market dynamics, key players, and future growth prospects. Valued at $XX Million in 2024, the market is projected to reach $XX Million by 2033, exhibiting a CAGR of XX% during the forecast period (2025-2033). The study period spans from 2019 to 2033, with 2025 serving as both the base and estimated year.
Process Gas Compressors Industry Market Composition & Trends
This section delves into the intricate structure of the Process Gas Compressors market, examining market concentration, innovation drivers, regulatory landscapes, substitute products, end-user profiles, and M&A activities. The market exhibits a moderately concentrated landscape, with key players such as Howden Group, Sullair LLC, Ingersoll Rand Inc, Buckhardt Compression AG, Siemens Energy AG, Sundyne LLC, Bauer Kompressoren GmbH, Borsig ZM GmbH, and Atlas Copco Group holding significant market share. The distribution of market share among these players is estimated to be approximately as follows: Howden Group (XX%), Sullair LLC (XX%), Ingersoll Rand Inc (XX%), others (XX%).
- Market Concentration: A detailed analysis of the Herfindahl-Hirschman Index (HHI) and market share distribution across leading players.
- Innovation Catalysts: Exploration of technological advancements driving market innovation, including the shift towards more efficient and environmentally friendly compressors.
- Regulatory Landscape: An assessment of the impact of global and regional environmental regulations on the industry.
- Substitute Products: An examination of alternative technologies and their potential impact on market growth.
- End-User Profiles: A detailed analysis of end-user segments including Oil & Gas, Chemicals, Power Generation, Industrial Gases, and Others (Manufacturing, Healthcare, etc.), highlighting their specific needs and market contribution. Oil & Gas currently dominates, accounting for XX% of the market.
- M&A Activities: A review of significant mergers and acquisitions in the industry during the historical period, including deal values (e.g., an estimated $XX Million for a representative deal). The report will analyze the impact of these activities on market consolidation and competitive dynamics.
Process Gas Compressors Industry Industry Evolution
This section provides a detailed analysis of the Process Gas Compressors industry's evolution, examining market growth trajectories, technological advancements, and evolving consumer demands. The market has witnessed substantial growth fueled by increasing demand from key end-user industries such as Oil & Gas and Chemicals. Technological advancements, such as the development of more energy-efficient and environmentally friendly compressors, are also driving market expansion.
- Growth Trajectories: A detailed analysis of historical growth rates and projected future growth based on market trends and expert forecasts. For example, the Oil & Gas sector demonstrated an average annual growth rate of XX% between 2019 and 2024.
- Technological Advancements: Discussion of key technological improvements, such as the adoption of advanced materials and digitalization, and their impact on market growth. The adoption rate of oil-free compressors, for instance, is expected to increase by XX% by 2033.
- Shifting Consumer Demands: Analysis of changes in end-user requirements, including increased emphasis on energy efficiency, reduced emissions, and improved reliability.
Leading Regions, Countries, or Segments in Process Gas Compressors Industry
This section identifies the leading regions, countries, and segments within the Process Gas Compressors market.
- Dominant Region/Country: North America is currently the leading region, followed by Europe and Asia-Pacific. The reasons for North America’s dominance are extensively discussed, including robust infrastructure, government initiatives and high demand across key sectors.
- Dominant Segment (Type): Oil-injected compressors currently hold a larger market share due to lower costs, but the demand for oil-free compressors is growing rapidly due to environmental concerns and increasing regulatory requirements.
- Dominant Segment (End-User): The Oil & Gas sector currently leads, driven by increasing demand for natural gas and growing exploration and production activities.
- Key Drivers (Bullet Points):
- Robust investments in infrastructure projects.
- Favorable government policies and regulatory support.
- Increasing demand from end-user industries (e.g., the continuous growth of the chemical industry).
- Technological advancements.
Process Gas Compressors Industry Product Innovations
This section highlights recent product innovations, applications, and performance metrics within the industry, focusing on unique selling propositions and technological advancements. The market is experiencing rapid innovation with a focus on enhancing energy efficiency, reducing emissions, and improving reliability. New compressor designs incorporating advanced materials and digital controls are gaining traction, offering better performance and lower operational costs. These innovations cater to the increasing demand for sustainable and high-performance solutions across various industries.
Propelling Factors for Process Gas Compressors Industry Growth
Several factors are propelling the growth of the Process Gas Compressors industry. These include rising demand from end-user sectors like Oil & Gas and Chemicals, increasing investments in infrastructure projects (particularly in emerging economies), and supportive government policies promoting energy efficiency. Furthermore, technological advancements in compressor design are driving higher performance, lower emissions, and reduced maintenance costs, thereby enhancing market appeal.
Obstacles in the Process Gas Compressors Industry Market
The Process Gas Compressors market faces several challenges. These include intense competition among established players, supply chain disruptions impacting raw material availability and production, and increasingly stringent environmental regulations necessitating substantial investments in compliance. The volatile nature of oil and gas prices also adds uncertainty to investment decisions and market growth.
Future Opportunities in Process Gas Compressors Industry
The Process Gas Compressors industry presents several opportunities for future growth. The growing adoption of renewable energy sources, specifically hydrogen, is opening up new applications for hydrogen compression technology. The increasing focus on sustainability is driving demand for more energy-efficient and environmentally friendly compressors. Emerging markets in developing economies also offer significant expansion potential.
Major Players in the Process Gas Compressors Industry Ecosystem
- Howden Group
- Sullair LLC
- Ingersoll Rand Inc
- Buckhardt Compression AG
- Siemens Energy AG
- Sundyne LLC
- Bauer Kompressoren GmbH
- Borsig ZM GmbH
- Atlas Copco Group
Key Developments in Process Gas Compressors Industry Industry
- August 2020: Vericor power systems announced a strategic partnership with Atlas Copco Gas and process to power integrally geared centrifugal compressors and companders with Vericor gas-driven turbines. This collaboration significantly enhances the product portfolio and strengthens the market position of both companies.
- February 2020: Burckhardt Compression signed a JV agreement with GRZ Technologies for the development of a new hydrogen compression technology. This signifies a significant step towards expanding into the rapidly growing hydrogen energy sector and capitalizing on the burgeoning demand for hydrogen compression solutions.
Strategic Process Gas Compressors Industry Market Forecast
The Process Gas Compressors market is poised for significant growth over the forecast period. Driven by the factors mentioned previously, particularly the increasing demand from key industries and technological innovations leading to improved efficiency and sustainability, the market is expected to experience strong growth. The emergence of new applications, such as hydrogen compression, further enhances the market’s long-term potential. The ongoing trend toward environmentally friendly solutions will continue to shape the industry's future.
Process Gas Compressors Industry Segmentation
-
1. Type
- 1.1. Oil Injected
- 1.2. Oil Free
-
2. End User
- 2.1. Oil & Gas
- 2.2. Chemicals
- 2.3. Power Generation
- 2.4. Industrial Gases
- 2.5. Others (Manufacturing, Healthcare, etc.)
Process Gas Compressors Industry Segmentation By Geography
- 1. North America
- 2. Europe
- 3. Asia Pacific
- 4. South America
- 5. Middle East
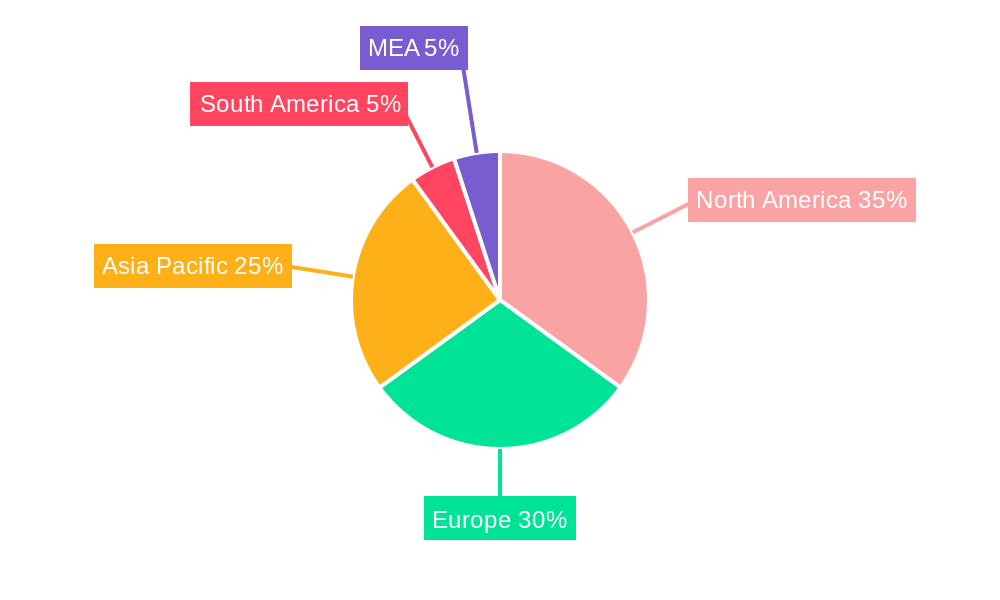
Process Gas Compressors Industry Regional Market Share
Geographic Coverage of Process Gas Compressors Industry
Process Gas Compressors Industry REPORT HIGHLIGHTS
| Aspects | Details |
|---|---|
| Study Period | 2020-2034 |
| Base Year | 2025 |
| Estimated Year | 2026 |
| Forecast Period | 2026-2034 |
| Historical Period | 2020-2025 |
| Growth Rate | CAGR of 5.7% from 2020-2034 |
| Segmentation |
|
Table of Contents
- 1. Introduction
- 1.1. Research Scope
- 1.2. Market Segmentation
- 1.3. Research Objective
- 1.4. Definitions and Assumptions
- 2. Executive Summary
- 2.1. Market Snapshot
- 3. Market Dynamics
- 3.1. Market Drivers
- 3.2. Market Restrains
- 3.3. Market Trends
- 3.4. Market Opportunities
- 4. Market Factor Analysis
- 4.1. Porters Five Forces
- 4.1.1. Bargaining Power of Suppliers
- 4.1.2. Bargaining Power of Buyers
- 4.1.3. Threat of New Entrants
- 4.1.4. Threat of Substitutes
- 4.1.5. Competitive Rivalry
- 4.2. PESTEL analysis
- 4.3. BCG Analysis
- 4.3.1. Stars (High Growth, High Market Share)
- 4.3.2. Cash Cows (Low Growth, High Market Share)
- 4.3.3. Question Mark (High Growth, Low Market Share)
- 4.3.4. Dogs (Low Growth, Low Market Share)
- 4.4. Ansoff Matrix Analysis
- 4.5. Supply Chain Analysis
- 4.6. Regulatory Landscape
- 4.7. Current Market Potential and Opportunity Assessment (TAM–SAM–SOM Framework)
- 4.8. DMV Analyst Note
- 4.1. Porters Five Forces
- 5. Market Analysis, Insights and Forecast 2021-2033
- 5.1. Market Analysis, Insights and Forecast - by Type
- 5.1.1. Oil Injected
- 5.1.2. Oil Free
- 5.2. Market Analysis, Insights and Forecast - by End User
- 5.2.1. Oil & Gas
- 5.2.2. Chemicals
- 5.2.3. Power Generation
- 5.2.4. Industrial Gases
- 5.2.5. Others (Manufacturing, Healthcare, etc.)
- 5.3. Market Analysis, Insights and Forecast - by Region
- 5.3.1. North America
- 5.3.2. Europe
- 5.3.3. Asia Pacific
- 5.3.4. South America
- 5.3.5. Middle East
- 5.1. Market Analysis, Insights and Forecast - by Type
- 6. Global Process Gas Compressors Industry Analysis, Insights and Forecast, 2021-2033
- 6.1. Market Analysis, Insights and Forecast - by Type
- 6.1.1. Oil Injected
- 6.1.2. Oil Free
- 6.2. Market Analysis, Insights and Forecast - by End User
- 6.2.1. Oil & Gas
- 6.2.2. Chemicals
- 6.2.3. Power Generation
- 6.2.4. Industrial Gases
- 6.2.5. Others (Manufacturing, Healthcare, etc.)
- 6.1. Market Analysis, Insights and Forecast - by Type
- 7. North America Process Gas Compressors Industry Analysis, Insights and Forecast, 2020-2032
- 7.1. Market Analysis, Insights and Forecast - by Type
- 7.1.1. Oil Injected
- 7.1.2. Oil Free
- 7.2. Market Analysis, Insights and Forecast - by End User
- 7.2.1. Oil & Gas
- 7.2.2. Chemicals
- 7.2.3. Power Generation
- 7.2.4. Industrial Gases
- 7.2.5. Others (Manufacturing, Healthcare, etc.)
- 7.1. Market Analysis, Insights and Forecast - by Type
- 8. Europe Process Gas Compressors Industry Analysis, Insights and Forecast, 2020-2032
- 8.1. Market Analysis, Insights and Forecast - by Type
- 8.1.1. Oil Injected
- 8.1.2. Oil Free
- 8.2. Market Analysis, Insights and Forecast - by End User
- 8.2.1. Oil & Gas
- 8.2.2. Chemicals
- 8.2.3. Power Generation
- 8.2.4. Industrial Gases
- 8.2.5. Others (Manufacturing, Healthcare, etc.)
- 8.1. Market Analysis, Insights and Forecast - by Type
- 9. Asia Pacific Process Gas Compressors Industry Analysis, Insights and Forecast, 2020-2032
- 9.1. Market Analysis, Insights and Forecast - by Type
- 9.1.1. Oil Injected
- 9.1.2. Oil Free
- 9.2. Market Analysis, Insights and Forecast - by End User
- 9.2.1. Oil & Gas
- 9.2.2. Chemicals
- 9.2.3. Power Generation
- 9.2.4. Industrial Gases
- 9.2.5. Others (Manufacturing, Healthcare, etc.)
- 9.1. Market Analysis, Insights and Forecast - by Type
- 10. South America Process Gas Compressors Industry Analysis, Insights and Forecast, 2020-2032
- 10.1. Market Analysis, Insights and Forecast - by Type
- 10.1.1. Oil Injected
- 10.1.2. Oil Free
- 10.2. Market Analysis, Insights and Forecast - by End User
- 10.2.1. Oil & Gas
- 10.2.2. Chemicals
- 10.2.3. Power Generation
- 10.2.4. Industrial Gases
- 10.2.5. Others (Manufacturing, Healthcare, etc.)
- 10.1. Market Analysis, Insights and Forecast - by Type
- 11. Middle East Process Gas Compressors Industry Analysis, Insights and Forecast, 2020-2032
- 11.1. Market Analysis, Insights and Forecast - by Type
- 11.1.1. Oil Injected
- 11.1.2. Oil Free
- 11.2. Market Analysis, Insights and Forecast - by End User
- 11.2.1. Oil & Gas
- 11.2.2. Chemicals
- 11.2.3. Power Generation
- 11.2.4. Industrial Gases
- 11.2.5. Others (Manufacturing, Healthcare, etc.)
- 11.1. Market Analysis, Insights and Forecast - by Type
- 12. Competitive Analysis
- 12.1. Company Profiles
- 12.1.1 Howden Group
- 12.1.1.1. Company Overview
- 12.1.1.2. Products
- 12.1.1.3. Company Financials
- 12.1.1.4. SWOT Analysis
- 12.1.2 Sullair LLC*List Not Exhaustive
- 12.1.2.1. Company Overview
- 12.1.2.2. Products
- 12.1.2.3. Company Financials
- 12.1.2.4. SWOT Analysis
- 12.1.3 Ingersoll Rand Inc
- 12.1.3.1. Company Overview
- 12.1.3.2. Products
- 12.1.3.3. Company Financials
- 12.1.3.4. SWOT Analysis
- 12.1.4 Buckhardt Compression AG
- 12.1.4.1. Company Overview
- 12.1.4.2. Products
- 12.1.4.3. Company Financials
- 12.1.4.4. SWOT Analysis
- 12.1.5 Siemens Energy AG
- 12.1.5.1. Company Overview
- 12.1.5.2. Products
- 12.1.5.3. Company Financials
- 12.1.5.4. SWOT Analysis
- 12.1.6 Sundyne LLC
- 12.1.6.1. Company Overview
- 12.1.6.2. Products
- 12.1.6.3. Company Financials
- 12.1.6.4. SWOT Analysis
- 12.1.7 Bauer Kompressoren GmbH
- 12.1.7.1. Company Overview
- 12.1.7.2. Products
- 12.1.7.3. Company Financials
- 12.1.7.4. SWOT Analysis
- 12.1.8 Borsig ZM GmbH
- 12.1.8.1. Company Overview
- 12.1.8.2. Products
- 12.1.8.3. Company Financials
- 12.1.8.4. SWOT Analysis
- 12.1.9 Atlas Copco Group
- 12.1.9.1. Company Overview
- 12.1.9.2. Products
- 12.1.9.3. Company Financials
- 12.1.9.4. SWOT Analysis
- 12.1.1 Howden Group
- 12.2. Market Entropy
- 12.2.1 Company's Key Areas Served
- 12.2.2 Recent Developments
- 12.3. Company Market Share Analysis 2025
- 12.3.1 Top 5 Companies Market Share Analysis
- 12.3.2 Top 3 Companies Market Share Analysis
- 12.4. List of Potential Customers
- 13. Research Methodology
List of Figures
- Figure 1: Global Process Gas Compressors Industry Revenue Breakdown (billion, %) by Region 2025 & 2033
- Figure 2: North America Process Gas Compressors Industry Revenue (billion), by Type 2025 & 2033
- Figure 3: North America Process Gas Compressors Industry Revenue Share (%), by Type 2025 & 2033
- Figure 4: North America Process Gas Compressors Industry Revenue (billion), by End User 2025 & 2033
- Figure 5: North America Process Gas Compressors Industry Revenue Share (%), by End User 2025 & 2033
- Figure 6: North America Process Gas Compressors Industry Revenue (billion), by Country 2025 & 2033
- Figure 7: North America Process Gas Compressors Industry Revenue Share (%), by Country 2025 & 2033
- Figure 8: Europe Process Gas Compressors Industry Revenue (billion), by Type 2025 & 2033
- Figure 9: Europe Process Gas Compressors Industry Revenue Share (%), by Type 2025 & 2033
- Figure 10: Europe Process Gas Compressors Industry Revenue (billion), by End User 2025 & 2033
- Figure 11: Europe Process Gas Compressors Industry Revenue Share (%), by End User 2025 & 2033
- Figure 12: Europe Process Gas Compressors Industry Revenue (billion), by Country 2025 & 2033
- Figure 13: Europe Process Gas Compressors Industry Revenue Share (%), by Country 2025 & 2033
- Figure 14: Asia Pacific Process Gas Compressors Industry Revenue (billion), by Type 2025 & 2033
- Figure 15: Asia Pacific Process Gas Compressors Industry Revenue Share (%), by Type 2025 & 2033
- Figure 16: Asia Pacific Process Gas Compressors Industry Revenue (billion), by End User 2025 & 2033
- Figure 17: Asia Pacific Process Gas Compressors Industry Revenue Share (%), by End User 2025 & 2033
- Figure 18: Asia Pacific Process Gas Compressors Industry Revenue (billion), by Country 2025 & 2033
- Figure 19: Asia Pacific Process Gas Compressors Industry Revenue Share (%), by Country 2025 & 2033
- Figure 20: South America Process Gas Compressors Industry Revenue (billion), by Type 2025 & 2033
- Figure 21: South America Process Gas Compressors Industry Revenue Share (%), by Type 2025 & 2033
- Figure 22: South America Process Gas Compressors Industry Revenue (billion), by End User 2025 & 2033
- Figure 23: South America Process Gas Compressors Industry Revenue Share (%), by End User 2025 & 2033
- Figure 24: South America Process Gas Compressors Industry Revenue (billion), by Country 2025 & 2033
- Figure 25: South America Process Gas Compressors Industry Revenue Share (%), by Country 2025 & 2033
- Figure 26: Middle East Process Gas Compressors Industry Revenue (billion), by Type 2025 & 2033
- Figure 27: Middle East Process Gas Compressors Industry Revenue Share (%), by Type 2025 & 2033
- Figure 28: Middle East Process Gas Compressors Industry Revenue (billion), by End User 2025 & 2033
- Figure 29: Middle East Process Gas Compressors Industry Revenue Share (%), by End User 2025 & 2033
- Figure 30: Middle East Process Gas Compressors Industry Revenue (billion), by Country 2025 & 2033
- Figure 31: Middle East Process Gas Compressors Industry Revenue Share (%), by Country 2025 & 2033
List of Tables
- Table 1: Global Process Gas Compressors Industry Revenue billion Forecast, by Type 2020 & 2033
- Table 2: Global Process Gas Compressors Industry Revenue billion Forecast, by End User 2020 & 2033
- Table 3: Global Process Gas Compressors Industry Revenue billion Forecast, by Region 2020 & 2033
- Table 4: Global Process Gas Compressors Industry Revenue billion Forecast, by Type 2020 & 2033
- Table 5: Global Process Gas Compressors Industry Revenue billion Forecast, by End User 2020 & 2033
- Table 6: Global Process Gas Compressors Industry Revenue billion Forecast, by Country 2020 & 2033
- Table 7: Global Process Gas Compressors Industry Revenue billion Forecast, by Type 2020 & 2033
- Table 8: Global Process Gas Compressors Industry Revenue billion Forecast, by End User 2020 & 2033
- Table 9: Global Process Gas Compressors Industry Revenue billion Forecast, by Country 2020 & 2033
- Table 10: Global Process Gas Compressors Industry Revenue billion Forecast, by Type 2020 & 2033
- Table 11: Global Process Gas Compressors Industry Revenue billion Forecast, by End User 2020 & 2033
- Table 12: Global Process Gas Compressors Industry Revenue billion Forecast, by Country 2020 & 2033
- Table 13: Global Process Gas Compressors Industry Revenue billion Forecast, by Type 2020 & 2033
- Table 14: Global Process Gas Compressors Industry Revenue billion Forecast, by End User 2020 & 2033
- Table 15: Global Process Gas Compressors Industry Revenue billion Forecast, by Country 2020 & 2033
- Table 16: Global Process Gas Compressors Industry Revenue billion Forecast, by Type 2020 & 2033
- Table 17: Global Process Gas Compressors Industry Revenue billion Forecast, by End User 2020 & 2033
- Table 18: Global Process Gas Compressors Industry Revenue billion Forecast, by Country 2020 & 2033
Frequently Asked Questions
1. What is the projected Compound Annual Growth Rate (CAGR) of the Process Gas Compressors Industry?
The projected CAGR is approximately 5.7%.
2. Which companies are prominent players in the Process Gas Compressors Industry?
Key companies in the market include Howden Group, Sullair LLC*List Not Exhaustive, Ingersoll Rand Inc, Buckhardt Compression AG, Siemens Energy AG, Sundyne LLC, Bauer Kompressoren GmbH, Borsig ZM GmbH, Atlas Copco Group.
3. What are the main segments of the Process Gas Compressors Industry?
The market segments include Type, End User.
4. Can you provide details about the market size?
The market size is estimated to be USD 6.3 billion as of 2022.
5. What are some drivers contributing to market growth?
4.; Soaring Demand From Natural Gas Sector4.; Increasing Demand From The Refinery And Petrochemical Sector.
6. What are the notable trends driving market growth?
Oil-injected Compressors to Dominate the Market.
7. Are there any restraints impacting market growth?
4.; Higher Capital Cost Compared To Traditional Internal Combustion Engines.
8. Can you provide examples of recent developments in the market?
In August 2020, Vericor power systems announced a strategic partnership with Atlas Copco Gas and process to power integrally geared centrifugal compressors and companders with Vericor gas-driven turbines.
9. What pricing options are available for accessing the report?
Pricing options include single-user, multi-user, and enterprise licenses priced at USD 4750, USD 5250, and USD 8750 respectively.
10. Is the market size provided in terms of value or volume?
The market size is provided in terms of value, measured in billion.
11. Are there any specific market keywords associated with the report?
Yes, the market keyword associated with the report is "Process Gas Compressors Industry," which aids in identifying and referencing the specific market segment covered.
12. How do I determine which pricing option suits my needs best?
The pricing options vary based on user requirements and access needs. Individual users may opt for single-user licenses, while businesses requiring broader access may choose multi-user or enterprise licenses for cost-effective access to the report.
13. Are there any additional resources or data provided in the Process Gas Compressors Industry report?
While the report offers comprehensive insights, it's advisable to review the specific contents or supplementary materials provided to ascertain if additional resources or data are available.
14. How can I stay updated on further developments or reports in the Process Gas Compressors Industry?
To stay informed about further developments, trends, and reports in the Process Gas Compressors Industry, consider subscribing to industry newsletters, following relevant companies and organizations, or regularly checking reputable industry news sources and publications.
Methodology
Step 1 - Identification of Relevant Samples Size from Population Database


Step 2 - Approaches for Defining Global Market Size (Value, Volume* & Price*)

Note*: In applicable scenarios
Step 3 - Data Sources
Primary Research
- Web Analytics
- Survey Reports
- Research Institute
- Latest Research Reports
- Opinion Leaders
Secondary Research
- Annual Reports
- White Paper
- Latest Press Release
- Industry Association
- Paid Database
- Investor Presentations

Step 4 - Data Triangulation
Involves using different sources of information in order to increase the validity of a study
These sources are likely to be stakeholders in a program - participants, other researchers, program staff, other community members, and so on.
Then we put all data in single framework & apply various statistical tools to find out the dynamic on the market.
During the analysis stage, feedback from the stakeholder groups would be compared to determine areas of agreement as well as areas of divergence