

Key Insights
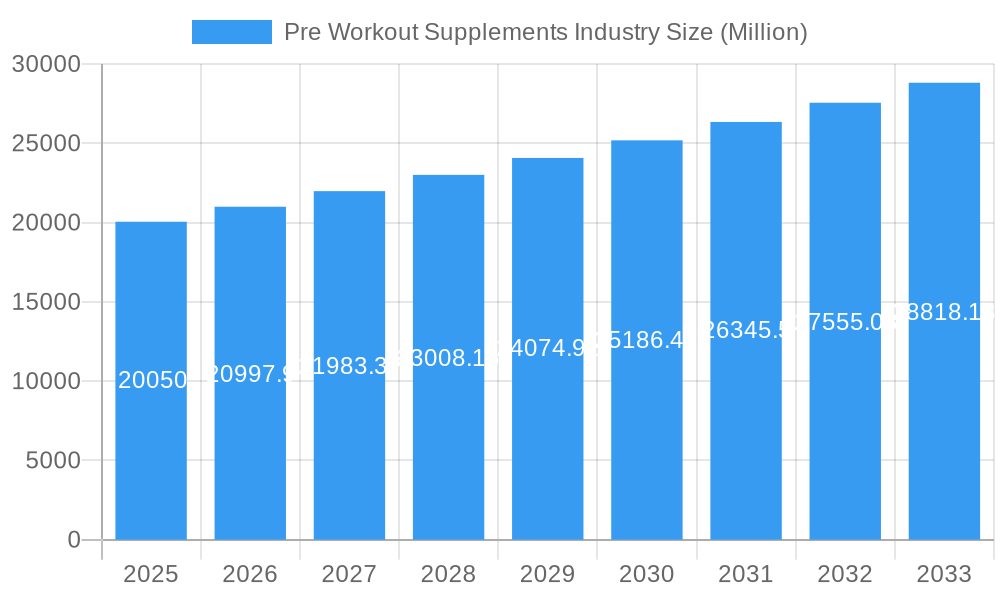
The pre-workout supplement market, valued at $20.05 billion in 2025, is projected to experience robust growth, driven by the rising popularity of fitness and athletic activities globally. A Compound Annual Growth Rate (CAGR) of 4.78% from 2025 to 2033 indicates a significant expansion, fueled by several key factors. Increased consumer awareness regarding performance enhancement and the convenience of pre-workout supplements contribute significantly to market expansion. The diverse product formats, including powders, capsules/tablets, and drinks, cater to varying consumer preferences and lifestyles, broadening market reach. Online retail channels are experiencing rapid growth, driven by ease of access and targeted marketing strategies, further contributing to market expansion. Geographic expansion, particularly in developing economies with a burgeoning fitness-conscious population, presents significant untapped potential. However, concerns regarding ingredient safety and potential side effects pose a challenge to sustained market growth. Regulatory scrutiny and the need for transparent labeling practices are crucial for maintaining consumer trust and market stability. The competitive landscape is marked by both established players and emerging brands, leading to innovation in product formulations and marketing strategies.
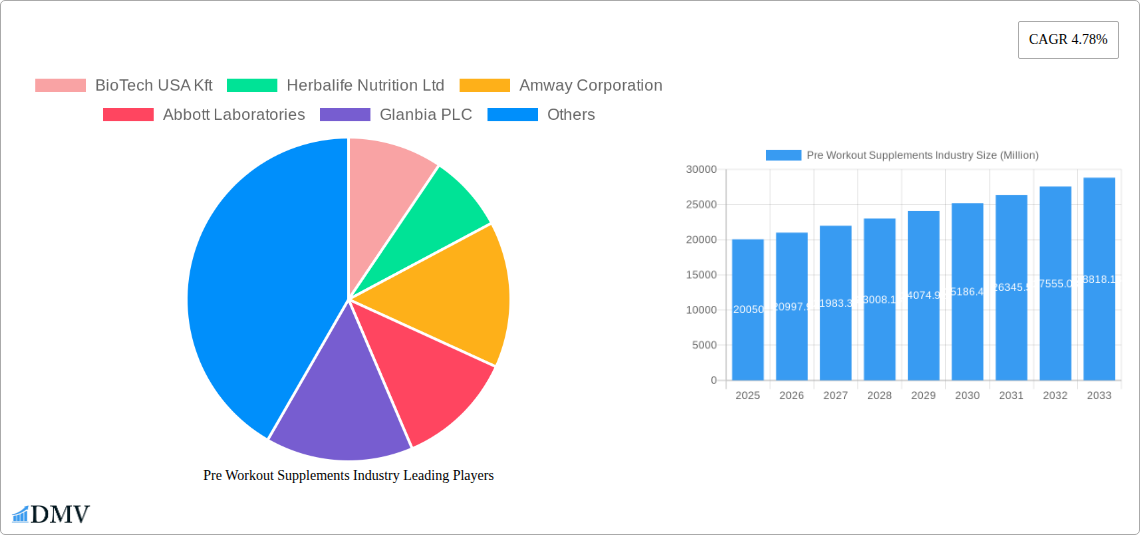
Pre Workout Supplements Industry Market Size (In Billion)
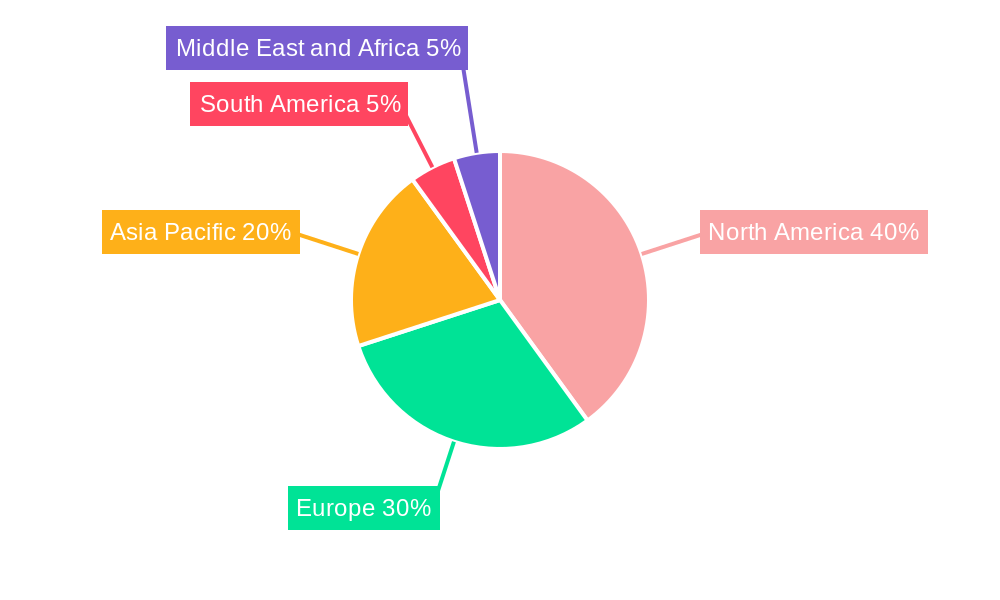
The market segmentation highlights the dominance of certain product types and distribution channels. While powder-based supplements may currently hold the largest market share, the growth of convenient capsule/tablet and drink formats is expected to gain momentum. Similarly, the online retail channel is projected to witness significant growth, surpassing traditional channels like hypermarkets and specialty stores due to its convenience and direct-to-consumer marketing capabilities. Key players, including BioTech USA Kft, Herbalife Nutrition Ltd, and Amway Corporation, are actively investing in research and development, product diversification, and strategic partnerships to solidify their market positions and capitalize on emerging trends. The regional breakdown suggests North America and Europe currently hold significant market shares, but Asia-Pacific, with its rapidly growing fitness market, presents substantial growth opportunities. Strategic expansion into these regions, coupled with a focus on product innovation and consumer education, will be vital for market leaders to maintain their competitive edge in the coming years.
Pre Workout Supplements Industry Company Market Share
Pre Workout Supplements Industry: A Comprehensive Market Report (2019-2033)
This insightful report provides a comprehensive analysis of the global pre workout supplements market, projecting a market value exceeding $XX Billion by 2033. The study covers the period from 2019 to 2033, with 2025 serving as both the base and estimated year. Key players like BioTech USA Kft, Herbalife Nutrition Ltd, Amway Corporation, Abbott Laboratories, Glanbia PLC, Nutrex Research Inc, MusclePharm Corporation, QNT SA, Bulk, and Nutrabolt are analyzed, along with market segmentation by type (powder, capsule/tablet, drinks, other) and distribution channel (hypermarket/supermarket, specialty stores, online retail stores, other). This report is an invaluable resource for stakeholders seeking to understand market dynamics, identify growth opportunities, and make informed business decisions.
Pre Workout Supplements Industry Market Composition & Trends
The global pre workout supplements market exhibits a moderately concentrated structure, with a few major players holding significant market share. However, the market is dynamic, characterized by continuous innovation and evolving consumer preferences. Regulatory landscapes vary across geographies, impacting product formulations and marketing claims. Substitute products, such as energy drinks and coffee, exert competitive pressure. The end-user profile is primarily fitness-conscious individuals, athletes, and bodybuilders, with a growing segment of health-conscious consumers. M&A activity has been moderate, with deal values averaging $XX Million in recent years.
- Market Share Distribution (2024): Top 5 players hold approximately 60% market share.
- M&A Activity (2019-2024): An estimated XX deals, with an average value of $XX Million per deal.
- Innovation Catalysts: Growing demand for natural and organic supplements, personalized nutrition solutions.
- Regulatory Landscape: Varies significantly across regions; stricter regulations in North America and Europe.
Pre Workout Supplements Industry Industry Evolution
The pre workout supplements market has experienced significant growth over the historical period (2019-2024), driven by increasing health consciousness, rising participation in fitness activities, and the proliferation of online retail channels. The market exhibited a Compound Annual Growth Rate (CAGR) of XX% during this period. Technological advancements, including the development of more effective and bioavailable formulations, have further propelled market expansion. Consumer demand is shifting towards clean label products, with increased transparency regarding ingredients and manufacturing processes. This trend is pushing manufacturers to reformulate products and highlight natural ingredients. The forecast period (2025-2033) anticipates continued growth, driven by expanding consumer base, innovative product development, and the rise of e-commerce. Specific data points and detailed forecasts can be found within the full report.
Leading Regions, Countries, or Segments in Pre Workout Supplements Industry
The North American region currently dominates the pre workout supplements market, accounting for approximately XX% of global revenue in 2024. This dominance is attributed to high fitness participation rates, strong consumer spending power, and a well-established distribution infrastructure.
Key Drivers:
- High Fitness Participation Rates: A significant portion of the population actively engages in fitness activities.
- Strong Consumer Spending Power: Consumers are willing to invest in premium supplements.
- Well-Established Distribution Channels: Extensive retail networks effectively reach target consumers.
- Regulatory Support (relatively stable): While regulations exist, they aren't overly restrictive compared to some other regions.
Dominant Segments:
- Type: Powder supplements hold the largest market share due to their versatility and cost-effectiveness.
- Distribution Channel: Online retail stores are experiencing rapid growth due to convenience and wider reach.
Further analysis on other regions and segments (Europe, Asia-Pacific, etc.) and a detailed breakdown of country-specific market dynamics are provided in the comprehensive report.
Pre Workout Supplements Industry Product Innovations
Recent innovations include the incorporation of novel ingredients like adaptogens and nootropics to enhance cognitive function and reduce muscle fatigue. Formulations focusing on sustained energy release and improved absorption are gaining popularity. Manufacturers are also employing advanced encapsulation technologies to enhance product stability and bioavailability. Unique selling propositions (USPs) are often centered around specific ingredient blends, advanced delivery systems, and superior taste profiles. This translates to improved product performance, enhanced consumer experience, and a competitive advantage in the market.
Propelling Factors for Pre Workout Supplements Industry Growth
The growth of the pre workout supplements industry is fueled by several key factors. Technological advancements in formulation and delivery systems are improving product efficacy and consumer experience. The rise in health and fitness awareness, particularly among millennials and Gen Z, fuels increased demand for performance-enhancing supplements. Favorable regulatory environments in certain regions also contribute to market expansion. Furthermore, the increasing accessibility of online retail channels expands market reach and boosts sales.
Obstacles in the Pre Workout Supplements Industry Market
The pre workout supplements market faces several challenges, including stringent regulatory scrutiny in some regions regarding ingredient safety and labeling claims, leading to higher compliance costs and potential product recalls. Supply chain disruptions, particularly those related to raw material sourcing, can significantly impact production and profitability. Intense competition from established brands and new entrants exerts pricing pressure and requires constant product innovation. These factors can collectively decrease market growth and profitability for companies operating in this sector.
Future Opportunities in Pre Workout Supplements Industry
Emerging opportunities lie in the development of personalized pre workout supplements tailored to individual genetic profiles and fitness goals. The growing adoption of wearable fitness trackers provides valuable data for creating personalized supplement recommendations. Furthermore, expansion into new markets with rising disposable incomes and a growing health and fitness consciousness presents significant potential. Developing sustainable and ethically sourced ingredients will also create a competitive advantage for manufacturers.
Major Players in the Pre Workout Supplements Industry Ecosystem
- BioTech USA Kft
- Herbalife Nutrition Ltd
- Amway Corporation
- Abbott Laboratories
- Glanbia PLC
- Nutrex Research Inc
- MusclePharm Corporation
- QNT SA
- Bulk
- Nutrabolt
Key Developments in Pre Workout Supplements Industry Industry
- 2022 Q3: Nutrabolt launched a new line of vegan pre-workout supplements.
- 2023 Q1: BioTech USA Kft acquired a smaller competitor, expanding its market share.
- 2024 Q2: New regulations regarding caffeine content in pre-workout supplements were introduced in the EU. (Further details on specific developments and their impact will be included in the full report)
Strategic Pre Workout Supplements Industry Market Forecast
The pre workout supplements market is poised for sustained growth over the forecast period (2025-2033), driven by ongoing innovation, rising health consciousness, and expanding distribution channels. The focus on personalized nutrition, clean label products, and advanced formulation technologies will shape market dynamics. New product categories, such as functional pre-workout drinks and supplements targeting specific fitness goals, will contribute to market expansion. The increasing integration of technology and data analytics will further enhance product development and consumer engagement. The full report provides detailed market forecasts segmented by region, type, and distribution channel.
Pre Workout Supplements Industry Segmentation
-
1. Type
- 1.1. Powder
- 1.2. Capsule/ Tablet
- 1.3. Drinks
- 1.4. Other Types
-
2. Distribution Channel
- 2.1. Hypermarket/Supermarket
- 2.2. Specialty Stores
- 2.3. Online Retail Stores
- 2.4. Other Distribution Channels
Pre Workout Supplements Industry Segmentation By Geography
-
1. North America
- 1.1. United States
- 1.2. Canada
- 1.3. Mexico
- 1.4. Rest of North America
-
2. Europe
- 2.1. Spain
- 2.2. United Kingdom
- 2.3. Germany
- 2.4. France
- 2.5. Italy
- 2.6. Russia
- 2.7. Rest of Europe
-
3. Asia Pacific
- 3.1. China
- 3.2. Japan
- 3.3. India
- 3.4. Australia
- 3.5. Rest of Asia Pacific
-
4. South America
- 4.1. Brazil
- 4.2. Argentina
- 4.3. Rest of South America
-
5. Middle East and Africa
- 5.1. United Arab Emirates
- 5.2. South Africa
- 5.3. Rest of Middle East and Africa
Pre Workout Supplements Industry Regional Market Share
Geographic Coverage of Pre Workout Supplements Industry
Pre Workout Supplements Industry REPORT HIGHLIGHTS
| Aspects | Details |
|---|---|
| Study Period | 2020-2034 |
| Base Year | 2025 |
| Estimated Year | 2026 |
| Forecast Period | 2026-2034 |
| Historical Period | 2020-2025 |
| Growth Rate | CAGR of 4.78% from 2020-2034 |
| Segmentation |
|
Table of Contents
- 1. Introduction
- 1.1. Research Scope
- 1.2. Market Segmentation
- 1.3. Research Objective
- 1.4. Definitions and Assumptions
- 2. Executive Summary
- 2.1. Market Snapshot
- 3. Market Dynamics
- 3.1. Market Drivers
- 3.2. Market Restrains
- 3.3. Market Trends
- 3.4. Market Opportunities
- 4. Market Factor Analysis
- 4.1. Porters Five Forces
- 4.1.1. Bargaining Power of Suppliers
- 4.1.2. Bargaining Power of Buyers
- 4.1.3. Threat of New Entrants
- 4.1.4. Threat of Substitutes
- 4.1.5. Competitive Rivalry
- 4.2. PESTEL analysis
- 4.3. BCG Analysis
- 4.3.1. Stars (High Growth, High Market Share)
- 4.3.2. Cash Cows (Low Growth, High Market Share)
- 4.3.3. Question Mark (High Growth, Low Market Share)
- 4.3.4. Dogs (Low Growth, Low Market Share)
- 4.4. Ansoff Matrix Analysis
- 4.5. Supply Chain Analysis
- 4.6. Regulatory Landscape
- 4.7. Current Market Potential and Opportunity Assessment (TAM–SAM–SOM Framework)
- 4.8. DMV Analyst Note
- 4.1. Porters Five Forces
- 5. Market Analysis, Insights and Forecast 2021-2033
- 5.1. Market Analysis, Insights and Forecast - by Type
- 5.1.1. Powder
- 5.1.2. Capsule/ Tablet
- 5.1.3. Drinks
- 5.1.4. Other Types
- 5.2. Market Analysis, Insights and Forecast - by Distribution Channel
- 5.2.1. Hypermarket/Supermarket
- 5.2.2. Specialty Stores
- 5.2.3. Online Retail Stores
- 5.2.4. Other Distribution Channels
- 5.3. Market Analysis, Insights and Forecast - by Region
- 5.3.1. North America
- 5.3.2. Europe
- 5.3.3. Asia Pacific
- 5.3.4. South America
- 5.3.5. Middle East and Africa
- 5.1. Market Analysis, Insights and Forecast - by Type
- 6. Global Pre Workout Supplements Industry Analysis, Insights and Forecast, 2021-2033
- 6.1. Market Analysis, Insights and Forecast - by Type
- 6.1.1. Powder
- 6.1.2. Capsule/ Tablet
- 6.1.3. Drinks
- 6.1.4. Other Types
- 6.2. Market Analysis, Insights and Forecast - by Distribution Channel
- 6.2.1. Hypermarket/Supermarket
- 6.2.2. Specialty Stores
- 6.2.3. Online Retail Stores
- 6.2.4. Other Distribution Channels
- 6.1. Market Analysis, Insights and Forecast - by Type
- 7. North America Pre Workout Supplements Industry Analysis, Insights and Forecast, 2020-2032
- 7.1. Market Analysis, Insights and Forecast - by Type
- 7.1.1. Powder
- 7.1.2. Capsule/ Tablet
- 7.1.3. Drinks
- 7.1.4. Other Types
- 7.2. Market Analysis, Insights and Forecast - by Distribution Channel
- 7.2.1. Hypermarket/Supermarket
- 7.2.2. Specialty Stores
- 7.2.3. Online Retail Stores
- 7.2.4. Other Distribution Channels
- 7.1. Market Analysis, Insights and Forecast - by Type
- 8. Europe Pre Workout Supplements Industry Analysis, Insights and Forecast, 2020-2032
- 8.1. Market Analysis, Insights and Forecast - by Type
- 8.1.1. Powder
- 8.1.2. Capsule/ Tablet
- 8.1.3. Drinks
- 8.1.4. Other Types
- 8.2. Market Analysis, Insights and Forecast - by Distribution Channel
- 8.2.1. Hypermarket/Supermarket
- 8.2.2. Specialty Stores
- 8.2.3. Online Retail Stores
- 8.2.4. Other Distribution Channels
- 8.1. Market Analysis, Insights and Forecast - by Type
- 9. Asia Pacific Pre Workout Supplements Industry Analysis, Insights and Forecast, 2020-2032
- 9.1. Market Analysis, Insights and Forecast - by Type
- 9.1.1. Powder
- 9.1.2. Capsule/ Tablet
- 9.1.3. Drinks
- 9.1.4. Other Types
- 9.2. Market Analysis, Insights and Forecast - by Distribution Channel
- 9.2.1. Hypermarket/Supermarket
- 9.2.2. Specialty Stores
- 9.2.3. Online Retail Stores
- 9.2.4. Other Distribution Channels
- 9.1. Market Analysis, Insights and Forecast - by Type
- 10. South America Pre Workout Supplements Industry Analysis, Insights and Forecast, 2020-2032
- 10.1. Market Analysis, Insights and Forecast - by Type
- 10.1.1. Powder
- 10.1.2. Capsule/ Tablet
- 10.1.3. Drinks
- 10.1.4. Other Types
- 10.2. Market Analysis, Insights and Forecast - by Distribution Channel
- 10.2.1. Hypermarket/Supermarket
- 10.2.2. Specialty Stores
- 10.2.3. Online Retail Stores
- 10.2.4. Other Distribution Channels
- 10.1. Market Analysis, Insights and Forecast - by Type
- 11. Middle East and Africa Pre Workout Supplements Industry Analysis, Insights and Forecast, 2020-2032
- 11.1. Market Analysis, Insights and Forecast - by Type
- 11.1.1. Powder
- 11.1.2. Capsule/ Tablet
- 11.1.3. Drinks
- 11.1.4. Other Types
- 11.2. Market Analysis, Insights and Forecast - by Distribution Channel
- 11.2.1. Hypermarket/Supermarket
- 11.2.2. Specialty Stores
- 11.2.3. Online Retail Stores
- 11.2.4. Other Distribution Channels
- 11.1. Market Analysis, Insights and Forecast - by Type
- 12. Competitive Analysis
- 12.1. Company Profiles
- 12.1.1 BioTech USA Kft
- 12.1.1.1. Company Overview
- 12.1.1.2. Products
- 12.1.1.3. Company Financials
- 12.1.1.4. SWOT Analysis
- 12.1.2 Herbalife Nutrition Ltd
- 12.1.2.1. Company Overview
- 12.1.2.2. Products
- 12.1.2.3. Company Financials
- 12.1.2.4. SWOT Analysis
- 12.1.3 Amway Corporation
- 12.1.3.1. Company Overview
- 12.1.3.2. Products
- 12.1.3.3. Company Financials
- 12.1.3.4. SWOT Analysis
- 12.1.4 Abbott Laboratories
- 12.1.4.1. Company Overview
- 12.1.4.2. Products
- 12.1.4.3. Company Financials
- 12.1.4.4. SWOT Analysis
- 12.1.5 Glanbia PLC
- 12.1.5.1. Company Overview
- 12.1.5.2. Products
- 12.1.5.3. Company Financials
- 12.1.5.4. SWOT Analysis
- 12.1.6 Nutrex Research Inc *List Not Exhaustive
- 12.1.6.1. Company Overview
- 12.1.6.2. Products
- 12.1.6.3. Company Financials
- 12.1.6.4. SWOT Analysis
- 12.1.7 MusclePharm Corporation
- 12.1.7.1. Company Overview
- 12.1.7.2. Products
- 12.1.7.3. Company Financials
- 12.1.7.4. SWOT Analysis
- 12.1.8 QNT SA
- 12.1.8.1. Company Overview
- 12.1.8.2. Products
- 12.1.8.3. Company Financials
- 12.1.8.4. SWOT Analysis
- 12.1.9 Bulk
- 12.1.9.1. Company Overview
- 12.1.9.2. Products
- 12.1.9.3. Company Financials
- 12.1.9.4. SWOT Analysis
- 12.1.10 Nutrabolt
- 12.1.10.1. Company Overview
- 12.1.10.2. Products
- 12.1.10.3. Company Financials
- 12.1.10.4. SWOT Analysis
- 12.1.1 BioTech USA Kft
- 12.2. Market Entropy
- 12.2.1 Company's Key Areas Served
- 12.2.2 Recent Developments
- 12.3. Company Market Share Analysis 2025
- 12.3.1 Top 5 Companies Market Share Analysis
- 12.3.2 Top 3 Companies Market Share Analysis
- 12.4. List of Potential Customers
- 13. Research Methodology
List of Figures
- Figure 1: Global Pre Workout Supplements Industry Revenue Breakdown (Million, %) by Region 2025 & 2033
- Figure 2: North America Pre Workout Supplements Industry Revenue (Million), by Type 2025 & 2033
- Figure 3: North America Pre Workout Supplements Industry Revenue Share (%), by Type 2025 & 2033
- Figure 4: North America Pre Workout Supplements Industry Revenue (Million), by Distribution Channel 2025 & 2033
- Figure 5: North America Pre Workout Supplements Industry Revenue Share (%), by Distribution Channel 2025 & 2033
- Figure 6: North America Pre Workout Supplements Industry Revenue (Million), by Country 2025 & 2033
- Figure 7: North America Pre Workout Supplements Industry Revenue Share (%), by Country 2025 & 2033
- Figure 8: Europe Pre Workout Supplements Industry Revenue (Million), by Type 2025 & 2033
- Figure 9: Europe Pre Workout Supplements Industry Revenue Share (%), by Type 2025 & 2033
- Figure 10: Europe Pre Workout Supplements Industry Revenue (Million), by Distribution Channel 2025 & 2033
- Figure 11: Europe Pre Workout Supplements Industry Revenue Share (%), by Distribution Channel 2025 & 2033
- Figure 12: Europe Pre Workout Supplements Industry Revenue (Million), by Country 2025 & 2033
- Figure 13: Europe Pre Workout Supplements Industry Revenue Share (%), by Country 2025 & 2033
- Figure 14: Asia Pacific Pre Workout Supplements Industry Revenue (Million), by Type 2025 & 2033
- Figure 15: Asia Pacific Pre Workout Supplements Industry Revenue Share (%), by Type 2025 & 2033
- Figure 16: Asia Pacific Pre Workout Supplements Industry Revenue (Million), by Distribution Channel 2025 & 2033
- Figure 17: Asia Pacific Pre Workout Supplements Industry Revenue Share (%), by Distribution Channel 2025 & 2033
- Figure 18: Asia Pacific Pre Workout Supplements Industry Revenue (Million), by Country 2025 & 2033
- Figure 19: Asia Pacific Pre Workout Supplements Industry Revenue Share (%), by Country 2025 & 2033
- Figure 20: South America Pre Workout Supplements Industry Revenue (Million), by Type 2025 & 2033
- Figure 21: South America Pre Workout Supplements Industry Revenue Share (%), by Type 2025 & 2033
- Figure 22: South America Pre Workout Supplements Industry Revenue (Million), by Distribution Channel 2025 & 2033
- Figure 23: South America Pre Workout Supplements Industry Revenue Share (%), by Distribution Channel 2025 & 2033
- Figure 24: South America Pre Workout Supplements Industry Revenue (Million), by Country 2025 & 2033
- Figure 25: South America Pre Workout Supplements Industry Revenue Share (%), by Country 2025 & 2033
- Figure 26: Middle East and Africa Pre Workout Supplements Industry Revenue (Million), by Type 2025 & 2033
- Figure 27: Middle East and Africa Pre Workout Supplements Industry Revenue Share (%), by Type 2025 & 2033
- Figure 28: Middle East and Africa Pre Workout Supplements Industry Revenue (Million), by Distribution Channel 2025 & 2033
- Figure 29: Middle East and Africa Pre Workout Supplements Industry Revenue Share (%), by Distribution Channel 2025 & 2033
- Figure 30: Middle East and Africa Pre Workout Supplements Industry Revenue (Million), by Country 2025 & 2033
- Figure 31: Middle East and Africa Pre Workout Supplements Industry Revenue Share (%), by Country 2025 & 2033
List of Tables
- Table 1: Global Pre Workout Supplements Industry Revenue Million Forecast, by Type 2020 & 2033
- Table 2: Global Pre Workout Supplements Industry Revenue Million Forecast, by Distribution Channel 2020 & 2033
- Table 3: Global Pre Workout Supplements Industry Revenue Million Forecast, by Region 2020 & 2033
- Table 4: Global Pre Workout Supplements Industry Revenue Million Forecast, by Type 2020 & 2033
- Table 5: Global Pre Workout Supplements Industry Revenue Million Forecast, by Distribution Channel 2020 & 2033
- Table 6: Global Pre Workout Supplements Industry Revenue Million Forecast, by Country 2020 & 2033
- Table 7: United States Pre Workout Supplements Industry Revenue (Million) Forecast, by Application 2020 & 2033
- Table 8: Canada Pre Workout Supplements Industry Revenue (Million) Forecast, by Application 2020 & 2033
- Table 9: Mexico Pre Workout Supplements Industry Revenue (Million) Forecast, by Application 2020 & 2033
- Table 10: Rest of North America Pre Workout Supplements Industry Revenue (Million) Forecast, by Application 2020 & 2033
- Table 11: Global Pre Workout Supplements Industry Revenue Million Forecast, by Type 2020 & 2033
- Table 12: Global Pre Workout Supplements Industry Revenue Million Forecast, by Distribution Channel 2020 & 2033
- Table 13: Global Pre Workout Supplements Industry Revenue Million Forecast, by Country 2020 & 2033
- Table 14: Spain Pre Workout Supplements Industry Revenue (Million) Forecast, by Application 2020 & 2033
- Table 15: United Kingdom Pre Workout Supplements Industry Revenue (Million) Forecast, by Application 2020 & 2033
- Table 16: Germany Pre Workout Supplements Industry Revenue (Million) Forecast, by Application 2020 & 2033
- Table 17: France Pre Workout Supplements Industry Revenue (Million) Forecast, by Application 2020 & 2033
- Table 18: Italy Pre Workout Supplements Industry Revenue (Million) Forecast, by Application 2020 & 2033
- Table 19: Russia Pre Workout Supplements Industry Revenue (Million) Forecast, by Application 2020 & 2033
- Table 20: Rest of Europe Pre Workout Supplements Industry Revenue (Million) Forecast, by Application 2020 & 2033
- Table 21: Global Pre Workout Supplements Industry Revenue Million Forecast, by Type 2020 & 2033
- Table 22: Global Pre Workout Supplements Industry Revenue Million Forecast, by Distribution Channel 2020 & 2033
- Table 23: Global Pre Workout Supplements Industry Revenue Million Forecast, by Country 2020 & 2033
- Table 24: China Pre Workout Supplements Industry Revenue (Million) Forecast, by Application 2020 & 2033
- Table 25: Japan Pre Workout Supplements Industry Revenue (Million) Forecast, by Application 2020 & 2033
- Table 26: India Pre Workout Supplements Industry Revenue (Million) Forecast, by Application 2020 & 2033
- Table 27: Australia Pre Workout Supplements Industry Revenue (Million) Forecast, by Application 2020 & 2033
- Table 28: Rest of Asia Pacific Pre Workout Supplements Industry Revenue (Million) Forecast, by Application 2020 & 2033
- Table 29: Global Pre Workout Supplements Industry Revenue Million Forecast, by Type 2020 & 2033
- Table 30: Global Pre Workout Supplements Industry Revenue Million Forecast, by Distribution Channel 2020 & 2033
- Table 31: Global Pre Workout Supplements Industry Revenue Million Forecast, by Country 2020 & 2033
- Table 32: Brazil Pre Workout Supplements Industry Revenue (Million) Forecast, by Application 2020 & 2033
- Table 33: Argentina Pre Workout Supplements Industry Revenue (Million) Forecast, by Application 2020 & 2033
- Table 34: Rest of South America Pre Workout Supplements Industry Revenue (Million) Forecast, by Application 2020 & 2033
- Table 35: Global Pre Workout Supplements Industry Revenue Million Forecast, by Type 2020 & 2033
- Table 36: Global Pre Workout Supplements Industry Revenue Million Forecast, by Distribution Channel 2020 & 2033
- Table 37: Global Pre Workout Supplements Industry Revenue Million Forecast, by Country 2020 & 2033
- Table 38: United Arab Emirates Pre Workout Supplements Industry Revenue (Million) Forecast, by Application 2020 & 2033
- Table 39: South Africa Pre Workout Supplements Industry Revenue (Million) Forecast, by Application 2020 & 2033
- Table 40: Rest of Middle East and Africa Pre Workout Supplements Industry Revenue (Million) Forecast, by Application 2020 & 2033
Frequently Asked Questions
1. What is the projected Compound Annual Growth Rate (CAGR) of the Pre Workout Supplements Industry?
The projected CAGR is approximately 4.78%.
2. Which companies are prominent players in the Pre Workout Supplements Industry?
Key companies in the market include BioTech USA Kft, Herbalife Nutrition Ltd, Amway Corporation, Abbott Laboratories, Glanbia PLC, Nutrex Research Inc *List Not Exhaustive, MusclePharm Corporation, QNT SA, Bulk, Nutrabolt.
3. What are the main segments of the Pre Workout Supplements Industry?
The market segments include Type, Distribution Channel.
4. Can you provide details about the market size?
The market size is estimated to be USD 20.05 Million as of 2022.
5. What are some drivers contributing to market growth?
Increasing Trend of Consuming Cocktails; Rising Demand for Premium Spirits.
6. What are the notable trends driving market growth?
Growing Influence of Healthy Lifestyle Trends and Rising Number of Non-Traditional Users.
7. Are there any restraints impacting market growth?
Affordability of the Product is Restraining the Market's Growth.
8. Can you provide examples of recent developments in the market?
N/A
9. What pricing options are available for accessing the report?
Pricing options include single-user, multi-user, and enterprise licenses priced at USD 4750, USD 5250, and USD 8750 respectively.
10. Is the market size provided in terms of value or volume?
The market size is provided in terms of value, measured in Million.
11. Are there any specific market keywords associated with the report?
Yes, the market keyword associated with the report is "Pre Workout Supplements Industry," which aids in identifying and referencing the specific market segment covered.
12. How do I determine which pricing option suits my needs best?
The pricing options vary based on user requirements and access needs. Individual users may opt for single-user licenses, while businesses requiring broader access may choose multi-user or enterprise licenses for cost-effective access to the report.
13. Are there any additional resources or data provided in the Pre Workout Supplements Industry report?
While the report offers comprehensive insights, it's advisable to review the specific contents or supplementary materials provided to ascertain if additional resources or data are available.
14. How can I stay updated on further developments or reports in the Pre Workout Supplements Industry?
To stay informed about further developments, trends, and reports in the Pre Workout Supplements Industry, consider subscribing to industry newsletters, following relevant companies and organizations, or regularly checking reputable industry news sources and publications.
Methodology
Step 1 - Identification of Relevant Samples Size from Population Database


Step 2 - Approaches for Defining Global Market Size (Value, Volume* & Price*)

Note*: In applicable scenarios
Step 3 - Data Sources
Primary Research
- Web Analytics
- Survey Reports
- Research Institute
- Latest Research Reports
- Opinion Leaders
Secondary Research
- Annual Reports
- White Paper
- Latest Press Release
- Industry Association
- Paid Database
- Investor Presentations

Step 4 - Data Triangulation
Involves using different sources of information in order to increase the validity of a study
These sources are likely to be stakeholders in a program - participants, other researchers, program staff, other community members, and so on.
Then we put all data in single framework & apply various statistical tools to find out the dynamic on the market.
During the analysis stage, feedback from the stakeholder groups would be compared to determine areas of agreement as well as areas of divergence