

Key Insights
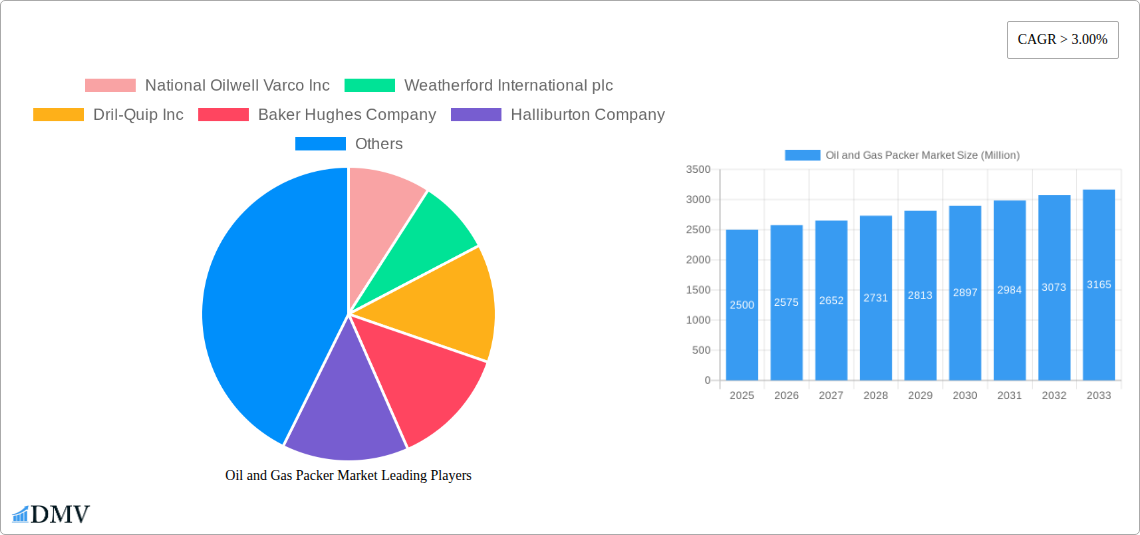
The global oil and gas packer market, estimated at 6.62 billion in 2024, is poised for significant expansion, projected to grow at a compound annual growth rate (CAGR) of 6.8% from 2024 to 2033. This growth trajectory is propelled by escalating global energy requirements, particularly in emerging economies, driving the demand for advanced oil and gas extraction solutions. The widespread adoption of sophisticated drilling methodologies in both onshore and offshore settings, alongside an increased emphasis on well integrity and environmental risk mitigation, are key market drivers. Furthermore, the continuous exploration and development of unconventional hydrocarbon reserves, including shale gas and tight oil, necessitate the deployment of high-performance packers for efficient well completion. Market segmentation highlights retrievable packers as a dominant segment, owing to their versatility and ease of servicing, with offshore applications constituting a substantial market share due to operational complexity and investment levels. North America and the Asia-Pacific region currently lead market activity, supported by substantial upstream investments and exploration initiatives.
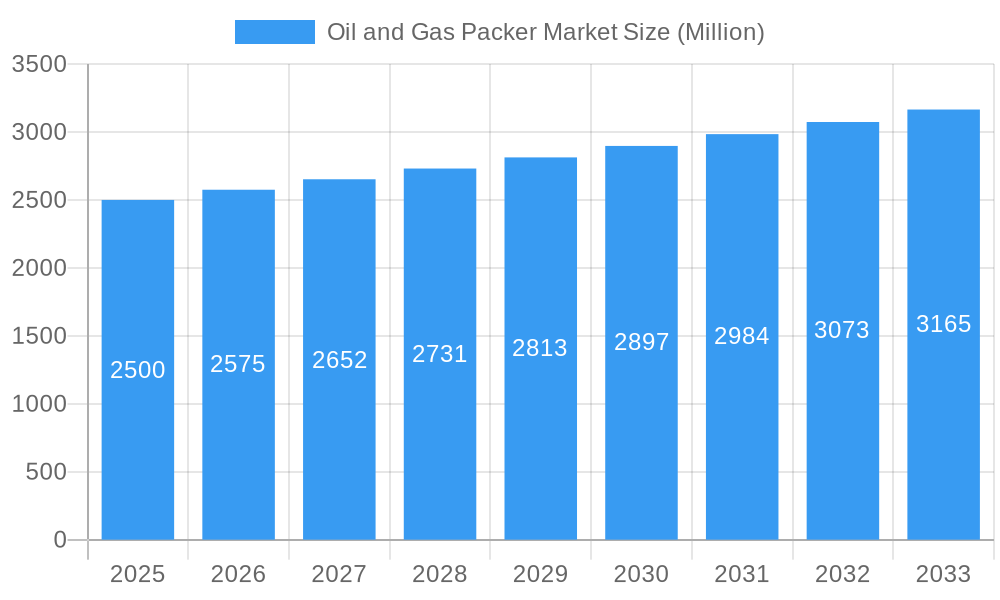
Oil and Gas Packer Market Market Size (In Billion)
Despite positive growth prospects, the market encounters challenges. Volatility in oil and gas commodity prices, coupled with stringent environmental regulations and safety mandates, can influence investment decisions and project schedules. The requirement for specialized technical expertise and infrastructure, especially in demanding offshore environments, presents a constraint to market expansion. Nevertheless, continuous technological innovation in packer design, material science, and deployment strategies is expected to address these hurdles and ensure sustained market growth. The advent of intelligent packers, integrated with advanced sensing and data analytics capabilities, promises to enhance well management and operational efficiency. The competitive landscape, featuring established industry leaders such as National Oilwell Varco, Weatherford International, Dril-Quip, Baker Hughes, Halliburton, and Schlumberger, alongside emerging regional players, is anticipated to foster innovation and competitive pricing.
Oil and Gas Packer Market Company Market Share
Oil and Gas Packer Market: A Comprehensive Report (2019-2033)
This insightful report provides a detailed analysis of the global Oil and Gas Packer market, offering a comprehensive overview of market trends, competitive dynamics, and future growth prospects. The study period spans from 2019 to 2033, with 2025 serving as the base and estimated year. The report meticulously examines market segmentation by type (Retrievable, Non-Retrievable), location of deployment (Offshore, Onshore), and geography (North America, Europe, Asia-Pacific, South America, Middle East & Africa), providing a granular understanding of market dynamics across diverse regions. Key players like National Oilwell Varco Inc, Weatherford International plc, Dril-Quip Inc, Baker Hughes Company, Halliburton Company, Wellcare oil tools pvt ltd, and Schlumberger Limited are profiled, offering crucial insights into their strategies and market positions. The report is an invaluable resource for investors, industry stakeholders, and strategic decision-makers seeking a comprehensive understanding of this dynamic market. The total market value in 2025 is estimated at xx Million.
Oil and Gas Packer Market Composition & Trends
This section analyzes the competitive landscape, innovation drivers, regulatory environment, and market dynamics within the Oil and Gas Packer market. We evaluate market concentration, identifying key players and their respective market shares. The report also explores the impact of mergers and acquisitions (M&A) activities, providing an overview of significant deals and their influence on market consolidation. Substitute products and their potential impact on market growth are also assessed. Finally, the analysis includes a detailed profile of end-users, including their specific needs and preferences.
- Market Share Distribution: National Oilwell Varco Inc holds an estimated xx% market share in 2025, followed by Schlumberger Limited at xx% and Halliburton Company at xx%. The remaining market share is distributed among other significant players.
- M&A Activity: Between 2019 and 2024, an estimated xx Million was invested in M&A activities within the Oil and Gas Packer market. Key deals included [mention specific deals if available, otherwise state "analysis of major deals is included within the report"].
- Innovation Catalysts: Technological advancements such as the development of [mention specific technological advancements if available, otherwise state "advanced materials and improved designs"] are driving innovation within the market.
- Regulatory Landscape: Stringent environmental regulations and safety standards are shaping market dynamics and influencing product development.
Oil and Gas Packer Market Industry Evolution
This section details the historical growth trajectory of the Oil and Gas Packer market from 2019 to 2024 and projects its future growth until 2033. We analyze the factors driving market expansion, such as increased oil and gas exploration and production activities, coupled with technological advancements that enhance operational efficiency and safety. The evolving consumer demands, particularly in terms of enhanced reliability and sustainability, are also considered.
- Market Growth: The market exhibited a CAGR of xx% during the historical period (2019-2024) and is projected to grow at a CAGR of xx% during the forecast period (2025-2033).
- Technological Advancements: The adoption of [mention specific technologies and their adoption rates if available, otherwise state "advanced materials and automation"] is accelerating, driving efficiency gains and cost reductions within the industry.
- Shifting Consumer Demands: The increasing emphasis on environmental sustainability and regulatory compliance is influencing the demand for more eco-friendly and efficient Oil and Gas Packer solutions.
Leading Regions, Countries, or Segments in Oil and Gas Packer Market
This section identifies the leading regions, countries, and market segments within the Oil and Gas Packer market. We analyze the key factors driving growth in these dominant areas, considering both market size and growth potential.
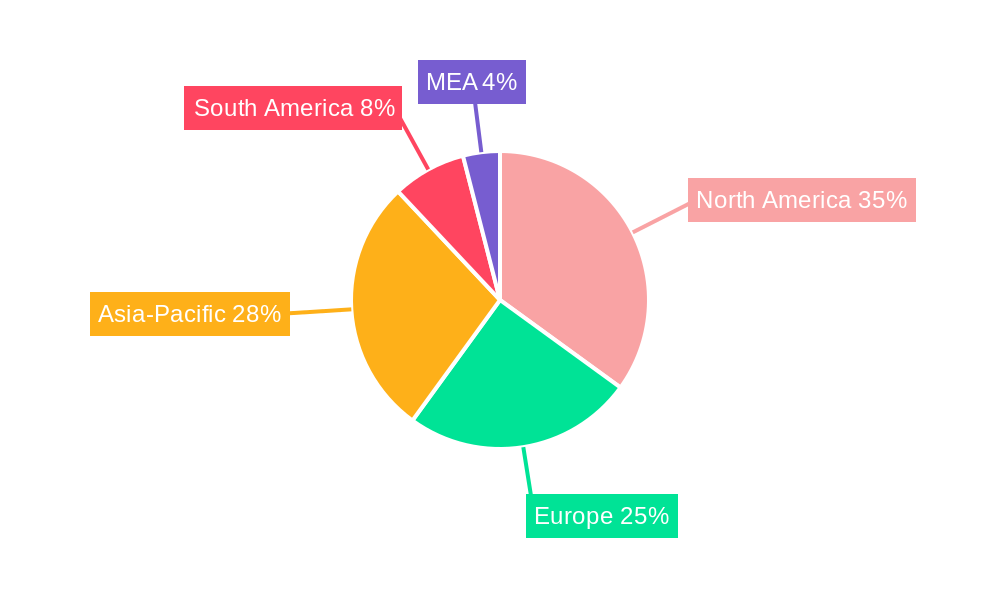
- Dominant Region: North America is currently the leading region, driven by extensive oil and gas exploration activities and a robust regulatory framework.
- Dominant Segment (Type): Retrievable packers command a larger market share compared to non-retrievable packers, owing to their versatility and ease of maintenance.
- Dominant Segment (Location): The offshore segment currently dominates due to higher oil and gas production rates in offshore locations.
Key Drivers:
- North America: High investments in oil and gas exploration, supportive government policies, and a well-established infrastructure contribute to North America's dominance.
- Europe: Stringent environmental regulations and a focus on sustainable energy practices are shaping market growth in Europe.
- Asia-Pacific: Rapid industrialization and increasing energy demand are driving growth in the Asia-Pacific region.
Oil and Gas Packer Market Product Innovations
Recent innovations have focused on enhancing the reliability, durability, and efficiency of Oil and Gas Packers. New materials, improved designs, and advanced technologies are being deployed to address specific challenges faced by oil and gas operators. These innovations translate to improved well integrity, reduced operational costs, and enhanced safety measures. Specific examples include the introduction of [mention specific product innovations if available, otherwise state "smart packers equipped with advanced sensors and improved sealing mechanisms"]. These features are designed to improve efficiency and reduce downtime.
Propelling Factors for Oil and Gas Packer Market Growth
Several factors contribute to the sustained growth of the Oil and Gas Packer market. Increased oil and gas exploration and production activities globally fuel the demand for these essential components. Technological advancements leading to enhanced efficiency and improved well integrity are also significant drivers. Furthermore, favorable government policies and investments in the energy sector further support market growth.
Obstacles in the Oil and Gas Packer Market
Despite the significant growth potential, the Oil and Gas Packer market faces several challenges. Fluctuations in oil and gas prices, stringent environmental regulations, and the cyclical nature of the energy industry create uncertainty. Supply chain disruptions and intense competition among established players also present significant obstacles. These factors can lead to price volatility and affect overall market expansion.
Future Opportunities in Oil and Gas Packer Market
Future opportunities lie in the development of innovative and sustainable Oil and Gas Packer solutions. Expanding into new markets, particularly in developing economies with increasing energy demands, presents significant potential. The integration of digital technologies and automation in the oil and gas industry also offers new growth avenues. Focus on eco-friendly materials and enhanced well integrity will drive future market expansion.
Major Players in the Oil and Gas Packer Market Ecosystem
- National Oilwell Varco Inc
- Weatherford International plc
- Dril-Quip Inc
- Baker Hughes Company
- Halliburton Company
- Wellcare oil tools pvt ltd
- Schlumberger Limited
Key Developments in Oil and Gas Packer Market Industry
- [Month, Year]: [Company Name] launches a new generation of [product name] with enhanced sealing technology.
- [Month, Year]: [Company A] and [Company B] announce a strategic partnership to develop advanced Oil and Gas Packer solutions.
- [Month, Year]: New regulations regarding [specific regulation] impact the Oil and Gas Packer market.
- (Add further key developments as available)
Strategic Oil and Gas Packer Market Forecast
The Oil and Gas Packer market is poised for significant growth in the coming years, driven by several factors. Increased investment in oil and gas exploration and production, coupled with technological advancements and a focus on enhancing well integrity, will contribute to market expansion. Emerging markets and the growing demand for sustainable energy solutions present further growth opportunities. The market is expected to experience substantial growth, reaching an estimated xx Million by 2033.
Oil and Gas Packer Market Segmentation
-
1. Type
- 1.1. Retrievable
- 1.2. Non-Retrievable
-
2. Location of Deployment
- 2.1. Offshore
- 2.2. Onshore
-
3. Geogrpahy
- 3.1. North America
- 3.2. Europe
- 3.3. Asia-Pacific
- 3.4. South America
- 3.5. Middle-East and Africa
Oil and Gas Packer Market Segmentation By Geography
-
1. North America
- 1.1. United States
- 1.2. Canada
- 1.3. Mexico
-
2. South America
- 2.1. Brazil
- 2.2. Argentina
- 2.3. Rest of South America
-
3. Europe
- 3.1. United Kingdom
- 3.2. Germany
- 3.3. France
- 3.4. Italy
- 3.5. Spain
- 3.6. Russia
- 3.7. Benelux
- 3.8. Nordics
- 3.9. Rest of Europe
-
4. Middle East & Africa
- 4.1. Turkey
- 4.2. Israel
- 4.3. GCC
- 4.4. North Africa
- 4.5. South Africa
- 4.6. Rest of Middle East & Africa
-
5. Asia Pacific
- 5.1. China
- 5.2. India
- 5.3. Japan
- 5.4. South Korea
- 5.5. ASEAN
- 5.6. Oceania
- 5.7. Rest of Asia Pacific
Oil and Gas Packer Market Regional Market Share
Geographic Coverage of Oil and Gas Packer Market
Oil and Gas Packer Market REPORT HIGHLIGHTS
| Aspects | Details |
|---|---|
| Study Period | 2020-2034 |
| Base Year | 2025 |
| Estimated Year | 2026 |
| Forecast Period | 2026-2034 |
| Historical Period | 2020-2025 |
| Growth Rate | CAGR of 6.8% from 2020-2034 |
| Segmentation |
|
Table of Contents
- 1. Introduction
- 1.1. Research Scope
- 1.2. Market Segmentation
- 1.3. Research Methodology
- 1.4. Definitions and Assumptions
- 2. Executive Summary
- 2.1. Introduction
- 3. Market Dynamics
- 3.1. Introduction
- 3.2. Market Drivers
- 3.2.1. Increasing Production from Unconventional Sources4.; Growing Energy Demand in the Region
- 3.3. Market Restrains
- 3.3.1. Environmental Concerns
- 3.4. Market Trends
- 3.4.1. Retrievable Packer to Witness Significant Growth
- 4. Market Factor Analysis
- 4.1. Porters Five Forces
- 4.2. Supply/Value Chain
- 4.3. PESTEL analysis
- 4.4. Market Entropy
- 4.5. Patent/Trademark Analysis
- 5. Global Oil and Gas Packer Market Analysis, Insights and Forecast, 2020-2032
- 5.1. Market Analysis, Insights and Forecast - by Type
- 5.1.1. Retrievable
- 5.1.2. Non-Retrievable
- 5.2. Market Analysis, Insights and Forecast - by Location of Deployment
- 5.2.1. Offshore
- 5.2.2. Onshore
- 5.3. Market Analysis, Insights and Forecast - by Geogrpahy
- 5.3.1. North America
- 5.3.2. Europe
- 5.3.3. Asia-Pacific
- 5.3.4. South America
- 5.3.5. Middle-East and Africa
- 5.4. Market Analysis, Insights and Forecast - by Region
- 5.4.1. North America
- 5.4.2. South America
- 5.4.3. Europe
- 5.4.4. Middle East & Africa
- 5.4.5. Asia Pacific
- 5.1. Market Analysis, Insights and Forecast - by Type
- 6. North America Oil and Gas Packer Market Analysis, Insights and Forecast, 2020-2032
- 6.1. Market Analysis, Insights and Forecast - by Type
- 6.1.1. Retrievable
- 6.1.2. Non-Retrievable
- 6.2. Market Analysis, Insights and Forecast - by Location of Deployment
- 6.2.1. Offshore
- 6.2.2. Onshore
- 6.3. Market Analysis, Insights and Forecast - by Geogrpahy
- 6.3.1. North America
- 6.3.2. Europe
- 6.3.3. Asia-Pacific
- 6.3.4. South America
- 6.3.5. Middle-East and Africa
- 6.1. Market Analysis, Insights and Forecast - by Type
- 7. South America Oil and Gas Packer Market Analysis, Insights and Forecast, 2020-2032
- 7.1. Market Analysis, Insights and Forecast - by Type
- 7.1.1. Retrievable
- 7.1.2. Non-Retrievable
- 7.2. Market Analysis, Insights and Forecast - by Location of Deployment
- 7.2.1. Offshore
- 7.2.2. Onshore
- 7.3. Market Analysis, Insights and Forecast - by Geogrpahy
- 7.3.1. North America
- 7.3.2. Europe
- 7.3.3. Asia-Pacific
- 7.3.4. South America
- 7.3.5. Middle-East and Africa
- 7.1. Market Analysis, Insights and Forecast - by Type
- 8. Europe Oil and Gas Packer Market Analysis, Insights and Forecast, 2020-2032
- 8.1. Market Analysis, Insights and Forecast - by Type
- 8.1.1. Retrievable
- 8.1.2. Non-Retrievable
- 8.2. Market Analysis, Insights and Forecast - by Location of Deployment
- 8.2.1. Offshore
- 8.2.2. Onshore
- 8.3. Market Analysis, Insights and Forecast - by Geogrpahy
- 8.3.1. North America
- 8.3.2. Europe
- 8.3.3. Asia-Pacific
- 8.3.4. South America
- 8.3.5. Middle-East and Africa
- 8.1. Market Analysis, Insights and Forecast - by Type
- 9. Middle East & Africa Oil and Gas Packer Market Analysis, Insights and Forecast, 2020-2032
- 9.1. Market Analysis, Insights and Forecast - by Type
- 9.1.1. Retrievable
- 9.1.2. Non-Retrievable
- 9.2. Market Analysis, Insights and Forecast - by Location of Deployment
- 9.2.1. Offshore
- 9.2.2. Onshore
- 9.3. Market Analysis, Insights and Forecast - by Geogrpahy
- 9.3.1. North America
- 9.3.2. Europe
- 9.3.3. Asia-Pacific
- 9.3.4. South America
- 9.3.5. Middle-East and Africa
- 9.1. Market Analysis, Insights and Forecast - by Type
- 10. Asia Pacific Oil and Gas Packer Market Analysis, Insights and Forecast, 2020-2032
- 10.1. Market Analysis, Insights and Forecast - by Type
- 10.1.1. Retrievable
- 10.1.2. Non-Retrievable
- 10.2. Market Analysis, Insights and Forecast - by Location of Deployment
- 10.2.1. Offshore
- 10.2.2. Onshore
- 10.3. Market Analysis, Insights and Forecast - by Geogrpahy
- 10.3.1. North America
- 10.3.2. Europe
- 10.3.3. Asia-Pacific
- 10.3.4. South America
- 10.3.5. Middle-East and Africa
- 10.1. Market Analysis, Insights and Forecast - by Type
- 11. Competitive Analysis
- 11.1. Global Market Share Analysis 2025
- 11.2. Company Profiles
- 11.2.1 National Oilwell Varco Inc
- 11.2.1.1. Overview
- 11.2.1.2. Products
- 11.2.1.3. SWOT Analysis
- 11.2.1.4. Recent Developments
- 11.2.1.5. Financials (Based on Availability)
- 11.2.2 Weatherford International plc
- 11.2.2.1. Overview
- 11.2.2.2. Products
- 11.2.2.3. SWOT Analysis
- 11.2.2.4. Recent Developments
- 11.2.2.5. Financials (Based on Availability)
- 11.2.3 Dril-Quip Inc
- 11.2.3.1. Overview
- 11.2.3.2. Products
- 11.2.3.3. SWOT Analysis
- 11.2.3.4. Recent Developments
- 11.2.3.5. Financials (Based on Availability)
- 11.2.4 Baker Hughes Company
- 11.2.4.1. Overview
- 11.2.4.2. Products
- 11.2.4.3. SWOT Analysis
- 11.2.4.4. Recent Developments
- 11.2.4.5. Financials (Based on Availability)
- 11.2.5 Halliburton Company
- 11.2.5.1. Overview
- 11.2.5.2. Products
- 11.2.5.3. SWOT Analysis
- 11.2.5.4. Recent Developments
- 11.2.5.5. Financials (Based on Availability)
- 11.2.6 Wellcare oil tools pvt ltd
- 11.2.6.1. Overview
- 11.2.6.2. Products
- 11.2.6.3. SWOT Analysis
- 11.2.6.4. Recent Developments
- 11.2.6.5. Financials (Based on Availability)
- 11.2.7 Schlumberger Limited
- 11.2.7.1. Overview
- 11.2.7.2. Products
- 11.2.7.3. SWOT Analysis
- 11.2.7.4. Recent Developments
- 11.2.7.5. Financials (Based on Availability)
- 11.2.1 National Oilwell Varco Inc
List of Figures
- Figure 1: Global Oil and Gas Packer Market Revenue Breakdown (billion, %) by Region 2025 & 2033
- Figure 2: Global Oil and Gas Packer Market Volume Breakdown (K Unit, %) by Region 2025 & 2033
- Figure 3: North America Oil and Gas Packer Market Revenue (billion), by Type 2025 & 2033
- Figure 4: North America Oil and Gas Packer Market Volume (K Unit), by Type 2025 & 2033
- Figure 5: North America Oil and Gas Packer Market Revenue Share (%), by Type 2025 & 2033
- Figure 6: North America Oil and Gas Packer Market Volume Share (%), by Type 2025 & 2033
- Figure 7: North America Oil and Gas Packer Market Revenue (billion), by Location of Deployment 2025 & 2033
- Figure 8: North America Oil and Gas Packer Market Volume (K Unit), by Location of Deployment 2025 & 2033
- Figure 9: North America Oil and Gas Packer Market Revenue Share (%), by Location of Deployment 2025 & 2033
- Figure 10: North America Oil and Gas Packer Market Volume Share (%), by Location of Deployment 2025 & 2033
- Figure 11: North America Oil and Gas Packer Market Revenue (billion), by Geogrpahy 2025 & 2033
- Figure 12: North America Oil and Gas Packer Market Volume (K Unit), by Geogrpahy 2025 & 2033
- Figure 13: North America Oil and Gas Packer Market Revenue Share (%), by Geogrpahy 2025 & 2033
- Figure 14: North America Oil and Gas Packer Market Volume Share (%), by Geogrpahy 2025 & 2033
- Figure 15: North America Oil and Gas Packer Market Revenue (billion), by Country 2025 & 2033
- Figure 16: North America Oil and Gas Packer Market Volume (K Unit), by Country 2025 & 2033
- Figure 17: North America Oil and Gas Packer Market Revenue Share (%), by Country 2025 & 2033
- Figure 18: North America Oil and Gas Packer Market Volume Share (%), by Country 2025 & 2033
- Figure 19: South America Oil and Gas Packer Market Revenue (billion), by Type 2025 & 2033
- Figure 20: South America Oil and Gas Packer Market Volume (K Unit), by Type 2025 & 2033
- Figure 21: South America Oil and Gas Packer Market Revenue Share (%), by Type 2025 & 2033
- Figure 22: South America Oil and Gas Packer Market Volume Share (%), by Type 2025 & 2033
- Figure 23: South America Oil and Gas Packer Market Revenue (billion), by Location of Deployment 2025 & 2033
- Figure 24: South America Oil and Gas Packer Market Volume (K Unit), by Location of Deployment 2025 & 2033
- Figure 25: South America Oil and Gas Packer Market Revenue Share (%), by Location of Deployment 2025 & 2033
- Figure 26: South America Oil and Gas Packer Market Volume Share (%), by Location of Deployment 2025 & 2033
- Figure 27: South America Oil and Gas Packer Market Revenue (billion), by Geogrpahy 2025 & 2033
- Figure 28: South America Oil and Gas Packer Market Volume (K Unit), by Geogrpahy 2025 & 2033
- Figure 29: South America Oil and Gas Packer Market Revenue Share (%), by Geogrpahy 2025 & 2033
- Figure 30: South America Oil and Gas Packer Market Volume Share (%), by Geogrpahy 2025 & 2033
- Figure 31: South America Oil and Gas Packer Market Revenue (billion), by Country 2025 & 2033
- Figure 32: South America Oil and Gas Packer Market Volume (K Unit), by Country 2025 & 2033
- Figure 33: South America Oil and Gas Packer Market Revenue Share (%), by Country 2025 & 2033
- Figure 34: South America Oil and Gas Packer Market Volume Share (%), by Country 2025 & 2033
- Figure 35: Europe Oil and Gas Packer Market Revenue (billion), by Type 2025 & 2033
- Figure 36: Europe Oil and Gas Packer Market Volume (K Unit), by Type 2025 & 2033
- Figure 37: Europe Oil and Gas Packer Market Revenue Share (%), by Type 2025 & 2033
- Figure 38: Europe Oil and Gas Packer Market Volume Share (%), by Type 2025 & 2033
- Figure 39: Europe Oil and Gas Packer Market Revenue (billion), by Location of Deployment 2025 & 2033
- Figure 40: Europe Oil and Gas Packer Market Volume (K Unit), by Location of Deployment 2025 & 2033
- Figure 41: Europe Oil and Gas Packer Market Revenue Share (%), by Location of Deployment 2025 & 2033
- Figure 42: Europe Oil and Gas Packer Market Volume Share (%), by Location of Deployment 2025 & 2033
- Figure 43: Europe Oil and Gas Packer Market Revenue (billion), by Geogrpahy 2025 & 2033
- Figure 44: Europe Oil and Gas Packer Market Volume (K Unit), by Geogrpahy 2025 & 2033
- Figure 45: Europe Oil and Gas Packer Market Revenue Share (%), by Geogrpahy 2025 & 2033
- Figure 46: Europe Oil and Gas Packer Market Volume Share (%), by Geogrpahy 2025 & 2033
- Figure 47: Europe Oil and Gas Packer Market Revenue (billion), by Country 2025 & 2033
- Figure 48: Europe Oil and Gas Packer Market Volume (K Unit), by Country 2025 & 2033
- Figure 49: Europe Oil and Gas Packer Market Revenue Share (%), by Country 2025 & 2033
- Figure 50: Europe Oil and Gas Packer Market Volume Share (%), by Country 2025 & 2033
- Figure 51: Middle East & Africa Oil and Gas Packer Market Revenue (billion), by Type 2025 & 2033
- Figure 52: Middle East & Africa Oil and Gas Packer Market Volume (K Unit), by Type 2025 & 2033
- Figure 53: Middle East & Africa Oil and Gas Packer Market Revenue Share (%), by Type 2025 & 2033
- Figure 54: Middle East & Africa Oil and Gas Packer Market Volume Share (%), by Type 2025 & 2033
- Figure 55: Middle East & Africa Oil and Gas Packer Market Revenue (billion), by Location of Deployment 2025 & 2033
- Figure 56: Middle East & Africa Oil and Gas Packer Market Volume (K Unit), by Location of Deployment 2025 & 2033
- Figure 57: Middle East & Africa Oil and Gas Packer Market Revenue Share (%), by Location of Deployment 2025 & 2033
- Figure 58: Middle East & Africa Oil and Gas Packer Market Volume Share (%), by Location of Deployment 2025 & 2033
- Figure 59: Middle East & Africa Oil and Gas Packer Market Revenue (billion), by Geogrpahy 2025 & 2033
- Figure 60: Middle East & Africa Oil and Gas Packer Market Volume (K Unit), by Geogrpahy 2025 & 2033
- Figure 61: Middle East & Africa Oil and Gas Packer Market Revenue Share (%), by Geogrpahy 2025 & 2033
- Figure 62: Middle East & Africa Oil and Gas Packer Market Volume Share (%), by Geogrpahy 2025 & 2033
- Figure 63: Middle East & Africa Oil and Gas Packer Market Revenue (billion), by Country 2025 & 2033
- Figure 64: Middle East & Africa Oil and Gas Packer Market Volume (K Unit), by Country 2025 & 2033
- Figure 65: Middle East & Africa Oil and Gas Packer Market Revenue Share (%), by Country 2025 & 2033
- Figure 66: Middle East & Africa Oil and Gas Packer Market Volume Share (%), by Country 2025 & 2033
- Figure 67: Asia Pacific Oil and Gas Packer Market Revenue (billion), by Type 2025 & 2033
- Figure 68: Asia Pacific Oil and Gas Packer Market Volume (K Unit), by Type 2025 & 2033
- Figure 69: Asia Pacific Oil and Gas Packer Market Revenue Share (%), by Type 2025 & 2033
- Figure 70: Asia Pacific Oil and Gas Packer Market Volume Share (%), by Type 2025 & 2033
- Figure 71: Asia Pacific Oil and Gas Packer Market Revenue (billion), by Location of Deployment 2025 & 2033
- Figure 72: Asia Pacific Oil and Gas Packer Market Volume (K Unit), by Location of Deployment 2025 & 2033
- Figure 73: Asia Pacific Oil and Gas Packer Market Revenue Share (%), by Location of Deployment 2025 & 2033
- Figure 74: Asia Pacific Oil and Gas Packer Market Volume Share (%), by Location of Deployment 2025 & 2033
- Figure 75: Asia Pacific Oil and Gas Packer Market Revenue (billion), by Geogrpahy 2025 & 2033
- Figure 76: Asia Pacific Oil and Gas Packer Market Volume (K Unit), by Geogrpahy 2025 & 2033
- Figure 77: Asia Pacific Oil and Gas Packer Market Revenue Share (%), by Geogrpahy 2025 & 2033
- Figure 78: Asia Pacific Oil and Gas Packer Market Volume Share (%), by Geogrpahy 2025 & 2033
- Figure 79: Asia Pacific Oil and Gas Packer Market Revenue (billion), by Country 2025 & 2033
- Figure 80: Asia Pacific Oil and Gas Packer Market Volume (K Unit), by Country 2025 & 2033
- Figure 81: Asia Pacific Oil and Gas Packer Market Revenue Share (%), by Country 2025 & 2033
- Figure 82: Asia Pacific Oil and Gas Packer Market Volume Share (%), by Country 2025 & 2033
List of Tables
- Table 1: Global Oil and Gas Packer Market Revenue billion Forecast, by Type 2020 & 2033
- Table 2: Global Oil and Gas Packer Market Volume K Unit Forecast, by Type 2020 & 2033
- Table 3: Global Oil and Gas Packer Market Revenue billion Forecast, by Location of Deployment 2020 & 2033
- Table 4: Global Oil and Gas Packer Market Volume K Unit Forecast, by Location of Deployment 2020 & 2033
- Table 5: Global Oil and Gas Packer Market Revenue billion Forecast, by Geogrpahy 2020 & 2033
- Table 6: Global Oil and Gas Packer Market Volume K Unit Forecast, by Geogrpahy 2020 & 2033
- Table 7: Global Oil and Gas Packer Market Revenue billion Forecast, by Region 2020 & 2033
- Table 8: Global Oil and Gas Packer Market Volume K Unit Forecast, by Region 2020 & 2033
- Table 9: Global Oil and Gas Packer Market Revenue billion Forecast, by Type 2020 & 2033
- Table 10: Global Oil and Gas Packer Market Volume K Unit Forecast, by Type 2020 & 2033
- Table 11: Global Oil and Gas Packer Market Revenue billion Forecast, by Location of Deployment 2020 & 2033
- Table 12: Global Oil and Gas Packer Market Volume K Unit Forecast, by Location of Deployment 2020 & 2033
- Table 13: Global Oil and Gas Packer Market Revenue billion Forecast, by Geogrpahy 2020 & 2033
- Table 14: Global Oil and Gas Packer Market Volume K Unit Forecast, by Geogrpahy 2020 & 2033
- Table 15: Global Oil and Gas Packer Market Revenue billion Forecast, by Country 2020 & 2033
- Table 16: Global Oil and Gas Packer Market Volume K Unit Forecast, by Country 2020 & 2033
- Table 17: United States Oil and Gas Packer Market Revenue (billion) Forecast, by Application 2020 & 2033
- Table 18: United States Oil and Gas Packer Market Volume (K Unit) Forecast, by Application 2020 & 2033
- Table 19: Canada Oil and Gas Packer Market Revenue (billion) Forecast, by Application 2020 & 2033
- Table 20: Canada Oil and Gas Packer Market Volume (K Unit) Forecast, by Application 2020 & 2033
- Table 21: Mexico Oil and Gas Packer Market Revenue (billion) Forecast, by Application 2020 & 2033
- Table 22: Mexico Oil and Gas Packer Market Volume (K Unit) Forecast, by Application 2020 & 2033
- Table 23: Global Oil and Gas Packer Market Revenue billion Forecast, by Type 2020 & 2033
- Table 24: Global Oil and Gas Packer Market Volume K Unit Forecast, by Type 2020 & 2033
- Table 25: Global Oil and Gas Packer Market Revenue billion Forecast, by Location of Deployment 2020 & 2033
- Table 26: Global Oil and Gas Packer Market Volume K Unit Forecast, by Location of Deployment 2020 & 2033
- Table 27: Global Oil and Gas Packer Market Revenue billion Forecast, by Geogrpahy 2020 & 2033
- Table 28: Global Oil and Gas Packer Market Volume K Unit Forecast, by Geogrpahy 2020 & 2033
- Table 29: Global Oil and Gas Packer Market Revenue billion Forecast, by Country 2020 & 2033
- Table 30: Global Oil and Gas Packer Market Volume K Unit Forecast, by Country 2020 & 2033
- Table 31: Brazil Oil and Gas Packer Market Revenue (billion) Forecast, by Application 2020 & 2033
- Table 32: Brazil Oil and Gas Packer Market Volume (K Unit) Forecast, by Application 2020 & 2033
- Table 33: Argentina Oil and Gas Packer Market Revenue (billion) Forecast, by Application 2020 & 2033
- Table 34: Argentina Oil and Gas Packer Market Volume (K Unit) Forecast, by Application 2020 & 2033
- Table 35: Rest of South America Oil and Gas Packer Market Revenue (billion) Forecast, by Application 2020 & 2033
- Table 36: Rest of South America Oil and Gas Packer Market Volume (K Unit) Forecast, by Application 2020 & 2033
- Table 37: Global Oil and Gas Packer Market Revenue billion Forecast, by Type 2020 & 2033
- Table 38: Global Oil and Gas Packer Market Volume K Unit Forecast, by Type 2020 & 2033
- Table 39: Global Oil and Gas Packer Market Revenue billion Forecast, by Location of Deployment 2020 & 2033
- Table 40: Global Oil and Gas Packer Market Volume K Unit Forecast, by Location of Deployment 2020 & 2033
- Table 41: Global Oil and Gas Packer Market Revenue billion Forecast, by Geogrpahy 2020 & 2033
- Table 42: Global Oil and Gas Packer Market Volume K Unit Forecast, by Geogrpahy 2020 & 2033
- Table 43: Global Oil and Gas Packer Market Revenue billion Forecast, by Country 2020 & 2033
- Table 44: Global Oil and Gas Packer Market Volume K Unit Forecast, by Country 2020 & 2033
- Table 45: United Kingdom Oil and Gas Packer Market Revenue (billion) Forecast, by Application 2020 & 2033
- Table 46: United Kingdom Oil and Gas Packer Market Volume (K Unit) Forecast, by Application 2020 & 2033
- Table 47: Germany Oil and Gas Packer Market Revenue (billion) Forecast, by Application 2020 & 2033
- Table 48: Germany Oil and Gas Packer Market Volume (K Unit) Forecast, by Application 2020 & 2033
- Table 49: France Oil and Gas Packer Market Revenue (billion) Forecast, by Application 2020 & 2033
- Table 50: France Oil and Gas Packer Market Volume (K Unit) Forecast, by Application 2020 & 2033
- Table 51: Italy Oil and Gas Packer Market Revenue (billion) Forecast, by Application 2020 & 2033
- Table 52: Italy Oil and Gas Packer Market Volume (K Unit) Forecast, by Application 2020 & 2033
- Table 53: Spain Oil and Gas Packer Market Revenue (billion) Forecast, by Application 2020 & 2033
- Table 54: Spain Oil and Gas Packer Market Volume (K Unit) Forecast, by Application 2020 & 2033
- Table 55: Russia Oil and Gas Packer Market Revenue (billion) Forecast, by Application 2020 & 2033
- Table 56: Russia Oil and Gas Packer Market Volume (K Unit) Forecast, by Application 2020 & 2033
- Table 57: Benelux Oil and Gas Packer Market Revenue (billion) Forecast, by Application 2020 & 2033
- Table 58: Benelux Oil and Gas Packer Market Volume (K Unit) Forecast, by Application 2020 & 2033
- Table 59: Nordics Oil and Gas Packer Market Revenue (billion) Forecast, by Application 2020 & 2033
- Table 60: Nordics Oil and Gas Packer Market Volume (K Unit) Forecast, by Application 2020 & 2033
- Table 61: Rest of Europe Oil and Gas Packer Market Revenue (billion) Forecast, by Application 2020 & 2033
- Table 62: Rest of Europe Oil and Gas Packer Market Volume (K Unit) Forecast, by Application 2020 & 2033
- Table 63: Global Oil and Gas Packer Market Revenue billion Forecast, by Type 2020 & 2033
- Table 64: Global Oil and Gas Packer Market Volume K Unit Forecast, by Type 2020 & 2033
- Table 65: Global Oil and Gas Packer Market Revenue billion Forecast, by Location of Deployment 2020 & 2033
- Table 66: Global Oil and Gas Packer Market Volume K Unit Forecast, by Location of Deployment 2020 & 2033
- Table 67: Global Oil and Gas Packer Market Revenue billion Forecast, by Geogrpahy 2020 & 2033
- Table 68: Global Oil and Gas Packer Market Volume K Unit Forecast, by Geogrpahy 2020 & 2033
- Table 69: Global Oil and Gas Packer Market Revenue billion Forecast, by Country 2020 & 2033
- Table 70: Global Oil and Gas Packer Market Volume K Unit Forecast, by Country 2020 & 2033
- Table 71: Turkey Oil and Gas Packer Market Revenue (billion) Forecast, by Application 2020 & 2033
- Table 72: Turkey Oil and Gas Packer Market Volume (K Unit) Forecast, by Application 2020 & 2033
- Table 73: Israel Oil and Gas Packer Market Revenue (billion) Forecast, by Application 2020 & 2033
- Table 74: Israel Oil and Gas Packer Market Volume (K Unit) Forecast, by Application 2020 & 2033
- Table 75: GCC Oil and Gas Packer Market Revenue (billion) Forecast, by Application 2020 & 2033
- Table 76: GCC Oil and Gas Packer Market Volume (K Unit) Forecast, by Application 2020 & 2033
- Table 77: North Africa Oil and Gas Packer Market Revenue (billion) Forecast, by Application 2020 & 2033
- Table 78: North Africa Oil and Gas Packer Market Volume (K Unit) Forecast, by Application 2020 & 2033
- Table 79: South Africa Oil and Gas Packer Market Revenue (billion) Forecast, by Application 2020 & 2033
- Table 80: South Africa Oil and Gas Packer Market Volume (K Unit) Forecast, by Application 2020 & 2033
- Table 81: Rest of Middle East & Africa Oil and Gas Packer Market Revenue (billion) Forecast, by Application 2020 & 2033
- Table 82: Rest of Middle East & Africa Oil and Gas Packer Market Volume (K Unit) Forecast, by Application 2020 & 2033
- Table 83: Global Oil and Gas Packer Market Revenue billion Forecast, by Type 2020 & 2033
- Table 84: Global Oil and Gas Packer Market Volume K Unit Forecast, by Type 2020 & 2033
- Table 85: Global Oil and Gas Packer Market Revenue billion Forecast, by Location of Deployment 2020 & 2033
- Table 86: Global Oil and Gas Packer Market Volume K Unit Forecast, by Location of Deployment 2020 & 2033
- Table 87: Global Oil and Gas Packer Market Revenue billion Forecast, by Geogrpahy 2020 & 2033
- Table 88: Global Oil and Gas Packer Market Volume K Unit Forecast, by Geogrpahy 2020 & 2033
- Table 89: Global Oil and Gas Packer Market Revenue billion Forecast, by Country 2020 & 2033
- Table 90: Global Oil and Gas Packer Market Volume K Unit Forecast, by Country 2020 & 2033
- Table 91: China Oil and Gas Packer Market Revenue (billion) Forecast, by Application 2020 & 2033
- Table 92: China Oil and Gas Packer Market Volume (K Unit) Forecast, by Application 2020 & 2033
- Table 93: India Oil and Gas Packer Market Revenue (billion) Forecast, by Application 2020 & 2033
- Table 94: India Oil and Gas Packer Market Volume (K Unit) Forecast, by Application 2020 & 2033
- Table 95: Japan Oil and Gas Packer Market Revenue (billion) Forecast, by Application 2020 & 2033
- Table 96: Japan Oil and Gas Packer Market Volume (K Unit) Forecast, by Application 2020 & 2033
- Table 97: South Korea Oil and Gas Packer Market Revenue (billion) Forecast, by Application 2020 & 2033
- Table 98: South Korea Oil and Gas Packer Market Volume (K Unit) Forecast, by Application 2020 & 2033
- Table 99: ASEAN Oil and Gas Packer Market Revenue (billion) Forecast, by Application 2020 & 2033
- Table 100: ASEAN Oil and Gas Packer Market Volume (K Unit) Forecast, by Application 2020 & 2033
- Table 101: Oceania Oil and Gas Packer Market Revenue (billion) Forecast, by Application 2020 & 2033
- Table 102: Oceania Oil and Gas Packer Market Volume (K Unit) Forecast, by Application 2020 & 2033
- Table 103: Rest of Asia Pacific Oil and Gas Packer Market Revenue (billion) Forecast, by Application 2020 & 2033
- Table 104: Rest of Asia Pacific Oil and Gas Packer Market Volume (K Unit) Forecast, by Application 2020 & 2033
Frequently Asked Questions
1. What is the projected Compound Annual Growth Rate (CAGR) of the Oil and Gas Packer Market?
The projected CAGR is approximately 6.8%.
2. Which companies are prominent players in the Oil and Gas Packer Market?
Key companies in the market include National Oilwell Varco Inc, Weatherford International plc, Dril-Quip Inc, Baker Hughes Company, Halliburton Company, Wellcare oil tools pvt ltd, Schlumberger Limited.
3. What are the main segments of the Oil and Gas Packer Market?
The market segments include Type, Location of Deployment, Geogrpahy.
4. Can you provide details about the market size?
The market size is estimated to be USD 6.62 billion as of 2022.
5. What are some drivers contributing to market growth?
Increasing Production from Unconventional Sources4.; Growing Energy Demand in the Region.
6. What are the notable trends driving market growth?
Retrievable Packer to Witness Significant Growth.
7. Are there any restraints impacting market growth?
Environmental Concerns.
8. Can you provide examples of recent developments in the market?
N/A
9. What pricing options are available for accessing the report?
Pricing options include single-user, multi-user, and enterprise licenses priced at USD 4750, USD 5250, and USD 8750 respectively.
10. Is the market size provided in terms of value or volume?
The market size is provided in terms of value, measured in billion and volume, measured in K Unit.
11. Are there any specific market keywords associated with the report?
Yes, the market keyword associated with the report is "Oil and Gas Packer Market," which aids in identifying and referencing the specific market segment covered.
12. How do I determine which pricing option suits my needs best?
The pricing options vary based on user requirements and access needs. Individual users may opt for single-user licenses, while businesses requiring broader access may choose multi-user or enterprise licenses for cost-effective access to the report.
13. Are there any additional resources or data provided in the Oil and Gas Packer Market report?
While the report offers comprehensive insights, it's advisable to review the specific contents or supplementary materials provided to ascertain if additional resources or data are available.
14. How can I stay updated on further developments or reports in the Oil and Gas Packer Market?
To stay informed about further developments, trends, and reports in the Oil and Gas Packer Market, consider subscribing to industry newsletters, following relevant companies and organizations, or regularly checking reputable industry news sources and publications.
Methodology
Step 1 - Identification of Relevant Samples Size from Population Database


Step 2 - Approaches for Defining Global Market Size (Value, Volume* & Price*)

Note*: In applicable scenarios
Step 3 - Data Sources
Primary Research
- Web Analytics
- Survey Reports
- Research Institute
- Latest Research Reports
- Opinion Leaders
Secondary Research
- Annual Reports
- White Paper
- Latest Press Release
- Industry Association
- Paid Database
- Investor Presentations

Step 4 - Data Triangulation
Involves using different sources of information in order to increase the validity of a study
These sources are likely to be stakeholders in a program - participants, other researchers, program staff, other community members, and so on.
Then we put all data in single framework & apply various statistical tools to find out the dynamic on the market.
During the analysis stage, feedback from the stakeholder groups would be compared to determine areas of agreement as well as areas of divergence