

Key Insights
The North Sea decommissioning oil rig market, characterized by a Compound Annual Growth Rate (CAGR) exceeding 5%, presents a significant investment opportunity. Driven by aging infrastructure, stringent environmental regulations, and the increasing need for responsible resource management, this market is poised for substantial growth through 2033. The market segmentation, encompassing shallow, deepwater, and ultra-deepwater operations, reflects the varied complexities and costs associated with decommissioning different types of rigs. Major players like Aker Solutions ASA, DNV GL, and TechnipFMC PLC are actively shaping the market, leveraging their expertise in engineering, project management, and specialized decommissioning technologies. The geographic focus is predominantly on North Sea regions, but strong growth is also expected in other areas with significant aging oil and gas infrastructure. While initial investment costs can be substantial, the long-term benefits associated with environmental compliance and responsible resource management are compelling factors driving market expansion. Furthermore, the development of innovative technologies and improved efficiency in decommissioning processes are likely to enhance profitability and attract further investment in the sector.
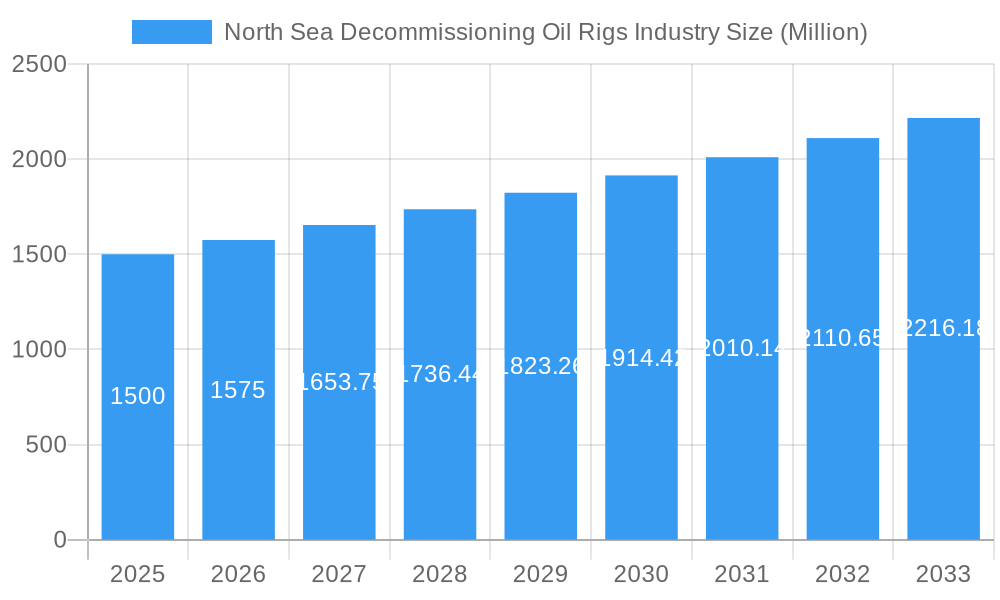
North Sea Decommissioning Oil Rigs Industry Market Size (In Billion)
The European region, particularly the UK and Norway within the North Sea, currently dominates the market due to the high concentration of aging oil and gas platforms requiring decommissioning. However, other regions, including the Asia-Pacific and North American sectors, are expected to experience growth as older infrastructure requires similar attention. The market is facing some restraints, including fluctuating oil prices and potential delays in regulatory approvals, which may influence the pace of project development. Nevertheless, the long-term outlook remains positive, supported by regulatory pressures, increasing industry focus on sustainability, and the continued need for safe and efficient decommissioning practices. The high concentration of industry expertise in the North Sea region will maintain a strategic advantage. The market is likely to evolve, with increasing emphasis on recycling and repurposing of materials, leading to environmental and cost advantages.
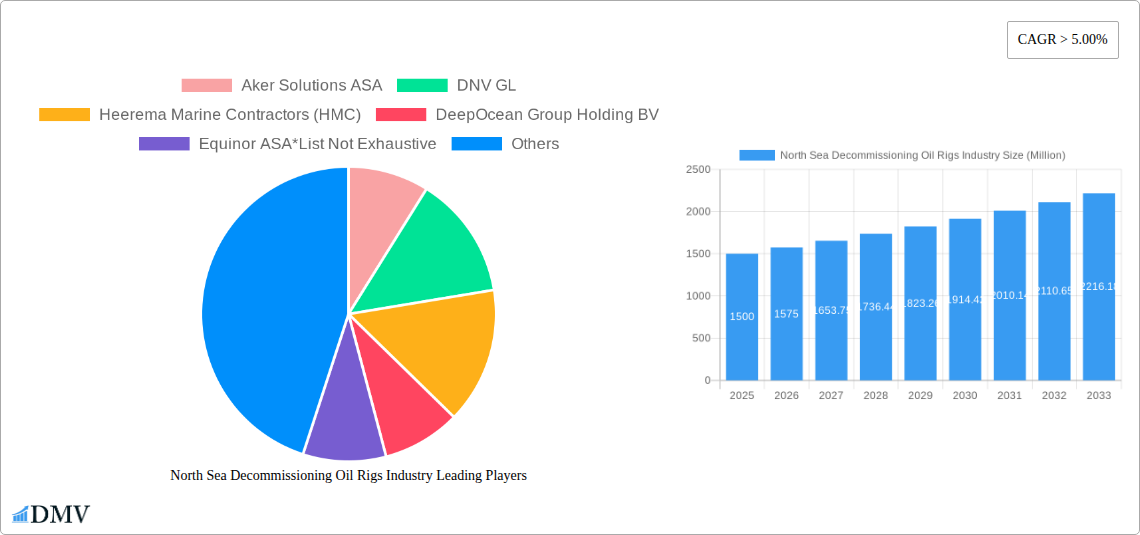
North Sea Decommissioning Oil Rigs Industry Company Market Share
North Sea Decommissioning Oil Rigs Industry: A Comprehensive Market Report (2019-2033)
This insightful report delivers a meticulous analysis of the North Sea decommissioning oil rigs industry, offering a comprehensive overview of market trends, technological advancements, and future growth prospects from 2019 to 2033. The study encompasses historical data (2019-2024), a base year of 2025, and forecasts extending to 2033, providing stakeholders with a clear understanding of the industry's evolution and potential. With a focus on key players like Aker Solutions ASA, DNV GL, Heerema Marine Contractors (HMC), DeepOcean Group Holding BV, Equinor ASA, Able UK, John Wood Group PLC, TechnipFMC PLC, AF Gruppen SA, and Allseas Group (list not exhaustive), this report is an indispensable resource for businesses, investors, and policymakers alike. The analysis delves into various segments based on water depth – shallow water, deepwater, and ultra-deepwater – offering granular insights into regional dominance and growth drivers. The total market size is estimated at xx Million in 2025.
North Sea Decommissioning Oil Rigs Industry Market Composition & Trends
This section evaluates the competitive landscape, innovation drivers, regulatory framework, substitute products, end-user profiles, and M&A activities within the North Sea decommissioning oil rigs industry. The market is characterized by a moderate level of concentration, with several major players vying for market share. Innovation is driven by the need for more efficient and environmentally friendly decommissioning techniques, resulting in significant R&D investment.
- Market Share Distribution (2025): Aker Solutions ASA (xx%), DNV GL (xx%), Heerema Marine Contractors (xx%), Others (xx%). (Note: Precise percentages are unavailable without further market research data analysis)
- M&A Activity (2019-2024): A total of xx M&A deals were recorded, with a combined value of approximately xx Million. The majority of deals focused on acquiring specialized technology or expanding geographical reach.
- Regulatory Landscape: Stringent environmental regulations and safety standards are driving the adoption of advanced decommissioning technologies.
- Substitute Products: Limited substitutes exist for specialized decommissioning services, but ongoing innovation might introduce alternative approaches in the future.
- End-User Profiles: Major oil and gas operators are the primary end users, with a growing focus on cost optimization and environmental responsibility.
North Sea Decommissioning Oil Rigs Industry Evolution
The North Sea decommissioning oil rigs industry has experienced significant growth over the past decade, fueled by the aging infrastructure and increasing regulatory pressures. The market is projected to witness a Compound Annual Growth Rate (CAGR) of xx% from 2025 to 2033, driven by a surge in decommissioning projects. Technological advancements, such as remotely operated vehicles (ROVs) and advanced dismantling techniques, have enhanced efficiency and reduced environmental impact. Furthermore, the industry is witnessing a shift towards sustainable practices and circular economy principles, encouraging the reuse and recycling of materials from decommissioned rigs. The adoption of these technologies is estimated at xx% in 2025. The increasing focus on environmental concerns is a major catalyst, while the increasing complexity of decommissioning projects also presents challenges and opportunities for innovation.
Leading Regions, Countries, or Segments in North Sea Decommissioning Oil Rigs Industry
The UK remains the dominant region in the North Sea decommissioning industry, driven by its extensive oil and gas infrastructure and established decommissioning expertise.
- Key Drivers for UK Dominance:
- Significant investment in decommissioning infrastructure and technology.
- Supportive regulatory framework.
- Large pool of experienced personnel.
- High concentration of decommissioning projects.
- Deepwater Segment: The deepwater segment is expected to experience significant growth, driven by the increasing complexity of deep-sea operations and associated decommissioning challenges. This necessitates the development and deployment of advanced technologies and specialized vessels to meet the requirements of safe and efficient decommissioning.
North Sea Decommissioning Oil Rigs Industry Product Innovations
Recent innovations focus on enhancing efficiency, reducing environmental impact, and improving safety. This includes the development of advanced robotic systems for underwater dismantling, improved waste management strategies to minimize environmental impact, and the incorporation of sustainable practices throughout the entire decommissioning process. New materials and technologies are being employed to streamline operations and reduce costs, while the development of innovative recycling techniques for decommissioned components is also gaining traction.
Propelling Factors for North Sea Decommissioning Oil Rigs Industry Growth
Growth is propelled by several factors: the aging infrastructure of the North Sea oil and gas fields necessitates large-scale decommissioning, stringent environmental regulations mandate safe and environmentally sound practices, and technological advancements enable more efficient and cost-effective decommissioning. Government incentives and supportive policies further encourage investment in the sector.
Obstacles in the North Sea Decommissioning Oil Rigs Industry Market
Key obstacles include the high cost of decommissioning, logistical challenges associated with offshore operations, and potential supply chain disruptions. Regulatory uncertainty and fluctuating oil prices can also impact investment decisions and project timelines. The complexity of decommissioning projects, requiring specialized expertise and advanced equipment, also poses a significant challenge.
Future Opportunities in North Sea Decommissioning Oil Rigs Industry
Future opportunities lie in developing advanced technologies, expanding into new markets, and adopting sustainable practices. The integration of digital technologies, such as AI and automation, presents significant potential for efficiency gains and cost reduction. The increasing focus on circular economy principles creates further opportunities for innovation and market expansion.
Major Players in the North Sea Decommissioning Oil Rigs Industry Ecosystem
Key Developments in North Sea Decommissioning Oil Rigs Industry Industry
- 2022 Q4: Introduction of a new remotely operated vehicle (ROV) by Aker Solutions ASA, significantly improving underwater dismantling efficiency.
- 2023 Q2: DNV GL released a new industry standard for decommissioning waste management, pushing for sustainable practices.
- 2024 Q3: Heerema Marine Contractors (HMC) acquired a specialized decommissioning vessel, expanding its capacity and geographical reach. (Note: These are examples and need to be replaced with actual data)
Strategic North Sea Decommissioning Oil Rigs Industry Market Forecast
The North Sea decommissioning oil rigs market is poised for continued growth, driven by the increasing number of aging platforms requiring decommissioning and technological advancements enabling more efficient and sustainable operations. The market is expected to expand at a steady pace, with significant opportunities for companies that can provide innovative and cost-effective solutions. The rising focus on environmental compliance and the increasing adoption of sustainable practices will further shape the market dynamics.
North Sea Decommissioning Oil Rigs Industry Segmentation
-
1. Water Depth
- 1.1. Shallow Water
- 1.2. Deepwater and Ultra-deepwater
-
2. Geography
- 2.1. United Kingdom
- 2.2. Norway
- 2.3. Rest of North Sea
North Sea Decommissioning Oil Rigs Industry Segmentation By Geography
- 1. United Kingdom
- 2. Norway
- 3. Rest of North Sea
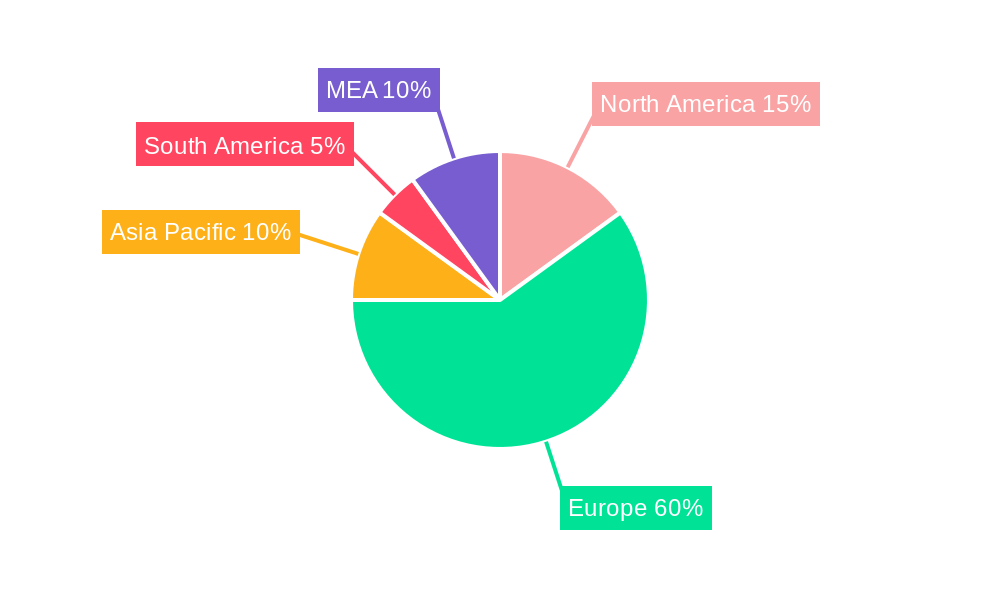
North Sea Decommissioning Oil Rigs Industry Regional Market Share
Geographic Coverage of North Sea Decommissioning Oil Rigs Industry
North Sea Decommissioning Oil Rigs Industry REPORT HIGHLIGHTS
| Aspects | Details |
|---|---|
| Study Period | 2020-2034 |
| Base Year | 2025 |
| Estimated Year | 2026 |
| Forecast Period | 2026-2034 |
| Historical Period | 2020-2025 |
| Growth Rate | CAGR of 8.2% from 2020-2034 |
| Segmentation |
|
Table of Contents
- 1. Introduction
- 1.1. Research Scope
- 1.2. Market Segmentation
- 1.3. Research Objective
- 1.4. Definitions and Assumptions
- 2. Executive Summary
- 2.1. Market Snapshot
- 3. Market Dynamics
- 3.1. Market Drivers
- 3.2. Market Restrains
- 3.3. Market Trends
- 3.4. Market Opportunities
- 4. Market Factor Analysis
- 4.1. Porters Five Forces
- 4.1.1. Bargaining Power of Suppliers
- 4.1.2. Bargaining Power of Buyers
- 4.1.3. Threat of New Entrants
- 4.1.4. Threat of Substitutes
- 4.1.5. Competitive Rivalry
- 4.2. PESTEL analysis
- 4.3. BCG Analysis
- 4.3.1. Stars (High Growth, High Market Share)
- 4.3.2. Cash Cows (Low Growth, High Market Share)
- 4.3.3. Question Mark (High Growth, Low Market Share)
- 4.3.4. Dogs (Low Growth, Low Market Share)
- 4.4. Ansoff Matrix Analysis
- 4.5. Supply Chain Analysis
- 4.6. Regulatory Landscape
- 4.7. Current Market Potential and Opportunity Assessment (TAM–SAM–SOM Framework)
- 4.8. DMV Analyst Note
- 4.1. Porters Five Forces
- 5. Market Analysis, Insights and Forecast 2021-2033
- 5.1. Market Analysis, Insights and Forecast - by Water Depth
- 5.1.1. Shallow Water
- 5.1.2. Deepwater and Ultra-deepwater
- 5.2. Market Analysis, Insights and Forecast - by Geography
- 5.2.1. United Kingdom
- 5.2.2. Norway
- 5.2.3. Rest of North Sea
- 5.3. Market Analysis, Insights and Forecast - by Region
- 5.3.1. United Kingdom
- 5.3.2. Norway
- 5.3.3. Rest of North Sea
- 5.1. Market Analysis, Insights and Forecast - by Water Depth
- 6. Global North Sea Decommissioning Oil Rigs Industry Analysis, Insights and Forecast, 2021-2033
- 6.1. Market Analysis, Insights and Forecast - by Water Depth
- 6.1.1. Shallow Water
- 6.1.2. Deepwater and Ultra-deepwater
- 6.2. Market Analysis, Insights and Forecast - by Geography
- 6.2.1. United Kingdom
- 6.2.2. Norway
- 6.2.3. Rest of North Sea
- 6.1. Market Analysis, Insights and Forecast - by Water Depth
- 7. United Kingdom North Sea Decommissioning Oil Rigs Industry Analysis, Insights and Forecast, 2020-2032
- 7.1. Market Analysis, Insights and Forecast - by Water Depth
- 7.1.1. Shallow Water
- 7.1.2. Deepwater and Ultra-deepwater
- 7.2. Market Analysis, Insights and Forecast - by Geography
- 7.2.1. United Kingdom
- 7.2.2. Norway
- 7.2.3. Rest of North Sea
- 7.1. Market Analysis, Insights and Forecast - by Water Depth
- 8. Norway North Sea Decommissioning Oil Rigs Industry Analysis, Insights and Forecast, 2020-2032
- 8.1. Market Analysis, Insights and Forecast - by Water Depth
- 8.1.1. Shallow Water
- 8.1.2. Deepwater and Ultra-deepwater
- 8.2. Market Analysis, Insights and Forecast - by Geography
- 8.2.1. United Kingdom
- 8.2.2. Norway
- 8.2.3. Rest of North Sea
- 8.1. Market Analysis, Insights and Forecast - by Water Depth
- 9. Rest of North Sea North Sea Decommissioning Oil Rigs Industry Analysis, Insights and Forecast, 2020-2032
- 9.1. Market Analysis, Insights and Forecast - by Water Depth
- 9.1.1. Shallow Water
- 9.1.2. Deepwater and Ultra-deepwater
- 9.2. Market Analysis, Insights and Forecast - by Geography
- 9.2.1. United Kingdom
- 9.2.2. Norway
- 9.2.3. Rest of North Sea
- 9.1. Market Analysis, Insights and Forecast - by Water Depth
- 10. Competitive Analysis
- 10.1. Company Profiles
- 10.1.1 Aker Solutions ASA
- 10.1.1.1. Company Overview
- 10.1.1.2. Products
- 10.1.1.3. Company Financials
- 10.1.1.4. SWOT Analysis
- 10.1.2 DNV GL
- 10.1.2.1. Company Overview
- 10.1.2.2. Products
- 10.1.2.3. Company Financials
- 10.1.2.4. SWOT Analysis
- 10.1.3 Heerema Marine Contractors (HMC)
- 10.1.3.1. Company Overview
- 10.1.3.2. Products
- 10.1.3.3. Company Financials
- 10.1.3.4. SWOT Analysis
- 10.1.4 DeepOcean Group Holding BV
- 10.1.4.1. Company Overview
- 10.1.4.2. Products
- 10.1.4.3. Company Financials
- 10.1.4.4. SWOT Analysis
- 10.1.5 Equinor ASA*List Not Exhaustive
- 10.1.5.1. Company Overview
- 10.1.5.2. Products
- 10.1.5.3. Company Financials
- 10.1.5.4. SWOT Analysis
- 10.1.6 Able UK
- 10.1.6.1. Company Overview
- 10.1.6.2. Products
- 10.1.6.3. Company Financials
- 10.1.6.4. SWOT Analysis
- 10.1.7 John Wood Group PLC
- 10.1.7.1. Company Overview
- 10.1.7.2. Products
- 10.1.7.3. Company Financials
- 10.1.7.4. SWOT Analysis
- 10.1.8 TechnipFMC PLC
- 10.1.8.1. Company Overview
- 10.1.8.2. Products
- 10.1.8.3. Company Financials
- 10.1.8.4. SWOT Analysis
- 10.1.9 AF Gruppen SA
- 10.1.9.1. Company Overview
- 10.1.9.2. Products
- 10.1.9.3. Company Financials
- 10.1.9.4. SWOT Analysis
- 10.1.10 Allseas Group
- 10.1.10.1. Company Overview
- 10.1.10.2. Products
- 10.1.10.3. Company Financials
- 10.1.10.4. SWOT Analysis
- 10.1.1 Aker Solutions ASA
- 10.2. Market Entropy
- 10.2.1 Company's Key Areas Served
- 10.2.2 Recent Developments
- 10.3. Company Market Share Analysis 2025
- 10.3.1 Top 5 Companies Market Share Analysis
- 10.3.2 Top 3 Companies Market Share Analysis
- 10.4. List of Potential Customers
- 11. Research Methodology
List of Figures
- Figure 1: Global North Sea Decommissioning Oil Rigs Industry Revenue Breakdown (undefined, %) by Region 2025 & 2033
- Figure 2: United Kingdom North Sea Decommissioning Oil Rigs Industry Revenue (undefined), by Water Depth 2025 & 2033
- Figure 3: United Kingdom North Sea Decommissioning Oil Rigs Industry Revenue Share (%), by Water Depth 2025 & 2033
- Figure 4: United Kingdom North Sea Decommissioning Oil Rigs Industry Revenue (undefined), by Geography 2025 & 2033
- Figure 5: United Kingdom North Sea Decommissioning Oil Rigs Industry Revenue Share (%), by Geography 2025 & 2033
- Figure 6: United Kingdom North Sea Decommissioning Oil Rigs Industry Revenue (undefined), by Country 2025 & 2033
- Figure 7: United Kingdom North Sea Decommissioning Oil Rigs Industry Revenue Share (%), by Country 2025 & 2033
- Figure 8: Norway North Sea Decommissioning Oil Rigs Industry Revenue (undefined), by Water Depth 2025 & 2033
- Figure 9: Norway North Sea Decommissioning Oil Rigs Industry Revenue Share (%), by Water Depth 2025 & 2033
- Figure 10: Norway North Sea Decommissioning Oil Rigs Industry Revenue (undefined), by Geography 2025 & 2033
- Figure 11: Norway North Sea Decommissioning Oil Rigs Industry Revenue Share (%), by Geography 2025 & 2033
- Figure 12: Norway North Sea Decommissioning Oil Rigs Industry Revenue (undefined), by Country 2025 & 2033
- Figure 13: Norway North Sea Decommissioning Oil Rigs Industry Revenue Share (%), by Country 2025 & 2033
- Figure 14: Rest of North Sea North Sea Decommissioning Oil Rigs Industry Revenue (undefined), by Water Depth 2025 & 2033
- Figure 15: Rest of North Sea North Sea Decommissioning Oil Rigs Industry Revenue Share (%), by Water Depth 2025 & 2033
- Figure 16: Rest of North Sea North Sea Decommissioning Oil Rigs Industry Revenue (undefined), by Geography 2025 & 2033
- Figure 17: Rest of North Sea North Sea Decommissioning Oil Rigs Industry Revenue Share (%), by Geography 2025 & 2033
- Figure 18: Rest of North Sea North Sea Decommissioning Oil Rigs Industry Revenue (undefined), by Country 2025 & 2033
- Figure 19: Rest of North Sea North Sea Decommissioning Oil Rigs Industry Revenue Share (%), by Country 2025 & 2033
List of Tables
- Table 1: Global North Sea Decommissioning Oil Rigs Industry Revenue undefined Forecast, by Water Depth 2020 & 2033
- Table 2: Global North Sea Decommissioning Oil Rigs Industry Revenue undefined Forecast, by Geography 2020 & 2033
- Table 3: Global North Sea Decommissioning Oil Rigs Industry Revenue undefined Forecast, by Region 2020 & 2033
- Table 4: Global North Sea Decommissioning Oil Rigs Industry Revenue undefined Forecast, by Water Depth 2020 & 2033
- Table 5: Global North Sea Decommissioning Oil Rigs Industry Revenue undefined Forecast, by Geography 2020 & 2033
- Table 6: Global North Sea Decommissioning Oil Rigs Industry Revenue undefined Forecast, by Country 2020 & 2033
- Table 7: Global North Sea Decommissioning Oil Rigs Industry Revenue undefined Forecast, by Water Depth 2020 & 2033
- Table 8: Global North Sea Decommissioning Oil Rigs Industry Revenue undefined Forecast, by Geography 2020 & 2033
- Table 9: Global North Sea Decommissioning Oil Rigs Industry Revenue undefined Forecast, by Country 2020 & 2033
- Table 10: Global North Sea Decommissioning Oil Rigs Industry Revenue undefined Forecast, by Water Depth 2020 & 2033
- Table 11: Global North Sea Decommissioning Oil Rigs Industry Revenue undefined Forecast, by Geography 2020 & 2033
- Table 12: Global North Sea Decommissioning Oil Rigs Industry Revenue undefined Forecast, by Country 2020 & 2033
Frequently Asked Questions
1. What is the projected Compound Annual Growth Rate (CAGR) of the North Sea Decommissioning Oil Rigs Industry?
The projected CAGR is approximately 8.2%.
2. Which companies are prominent players in the North Sea Decommissioning Oil Rigs Industry?
Key companies in the market include Aker Solutions ASA, DNV GL, Heerema Marine Contractors (HMC), DeepOcean Group Holding BV, Equinor ASA*List Not Exhaustive, Able UK, John Wood Group PLC, TechnipFMC PLC, AF Gruppen SA, Allseas Group.
3. What are the main segments of the North Sea Decommissioning Oil Rigs Industry?
The market segments include Water Depth, Geography.
4. Can you provide details about the market size?
The market size is estimated to be USD XXX N/A as of 2022.
5. What are some drivers contributing to market growth?
4.; Increasing Demand for Secure. Sustainable. and Clean Energy.
6. What are the notable trends driving market growth?
Shallow Water to Dominate the Market.
7. Are there any restraints impacting market growth?
4.; High Cost of Production of Biofuels.
8. Can you provide examples of recent developments in the market?
N/A
9. What pricing options are available for accessing the report?
Pricing options include single-user, multi-user, and enterprise licenses priced at USD 4750, USD 5250, and USD 8750 respectively.
10. Is the market size provided in terms of value or volume?
The market size is provided in terms of value, measured in N/A.
11. Are there any specific market keywords associated with the report?
Yes, the market keyword associated with the report is "North Sea Decommissioning Oil Rigs Industry," which aids in identifying and referencing the specific market segment covered.
12. How do I determine which pricing option suits my needs best?
The pricing options vary based on user requirements and access needs. Individual users may opt for single-user licenses, while businesses requiring broader access may choose multi-user or enterprise licenses for cost-effective access to the report.
13. Are there any additional resources or data provided in the North Sea Decommissioning Oil Rigs Industry report?
While the report offers comprehensive insights, it's advisable to review the specific contents or supplementary materials provided to ascertain if additional resources or data are available.
14. How can I stay updated on further developments or reports in the North Sea Decommissioning Oil Rigs Industry?
To stay informed about further developments, trends, and reports in the North Sea Decommissioning Oil Rigs Industry, consider subscribing to industry newsletters, following relevant companies and organizations, or regularly checking reputable industry news sources and publications.
Methodology
Step 1 - Identification of Relevant Samples Size from Population Database


Step 2 - Approaches for Defining Global Market Size (Value, Volume* & Price*)

Note*: In applicable scenarios
Step 3 - Data Sources
Primary Research
- Web Analytics
- Survey Reports
- Research Institute
- Latest Research Reports
- Opinion Leaders
Secondary Research
- Annual Reports
- White Paper
- Latest Press Release
- Industry Association
- Paid Database
- Investor Presentations

Step 4 - Data Triangulation
Involves using different sources of information in order to increase the validity of a study
These sources are likely to be stakeholders in a program - participants, other researchers, program staff, other community members, and so on.
Then we put all data in single framework & apply various statistical tools to find out the dynamic on the market.
During the analysis stage, feedback from the stakeholder groups would be compared to determine areas of agreement as well as areas of divergence