

Key Insights
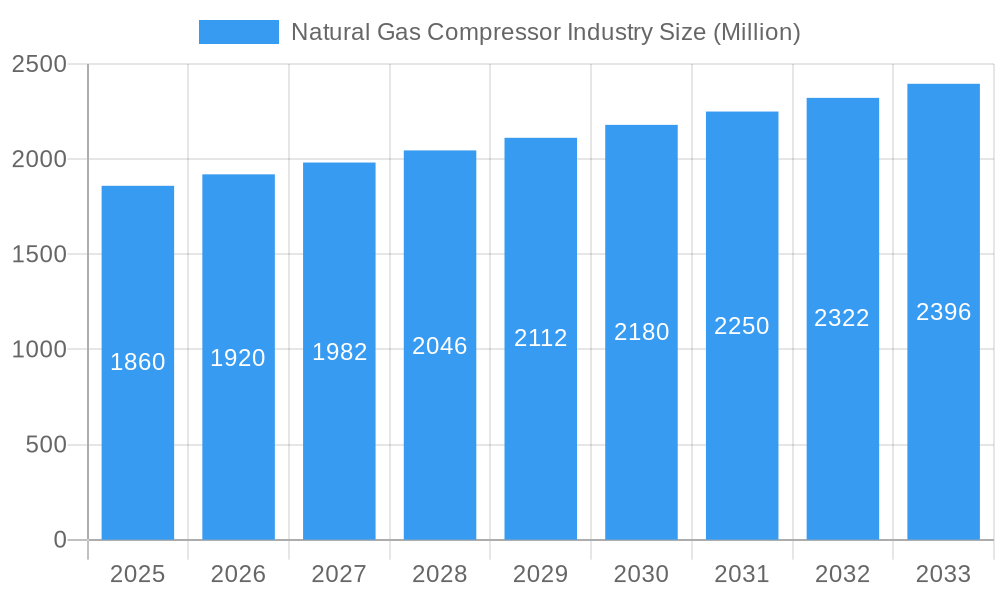
The global natural gas compressor market, valued at $1.86 billion in 2025, is projected to experience steady growth, driven primarily by the expanding natural gas infrastructure and increasing demand for natural gas globally. The market's Compound Annual Growth Rate (CAGR) of 3.13% from 2025 to 2033 reflects a consistent, albeit moderate, expansion. Key drivers include the ongoing transition to cleaner energy sources, where natural gas plays a significant role as a bridging fuel, coupled with rising industrialization and urbanization in developing economies fueling energy demand. Technological advancements in compressor design, focusing on improved efficiency and reduced emissions, further stimulate market growth. While regulatory changes related to emissions and environmental concerns might pose some restraints, the overall positive outlook for natural gas consumption globally suggests a resilient and expanding market for natural gas compressors. Market segmentation reveals a significant share held by reciprocating compressors in the upstream sector, reflecting the established presence of this technology in gas production and processing. However, screw compressors are gaining traction, particularly in downstream applications due to their suitability for higher flow rates and pressures. Major players like Atlas Copco, Siemens, and Ingersoll Rand dominate the market, leveraging their technological capabilities and extensive global presence to capture significant market share. Competition is intense, fueled by continuous innovation and the pursuit of cost-effective and efficient compressor technologies.
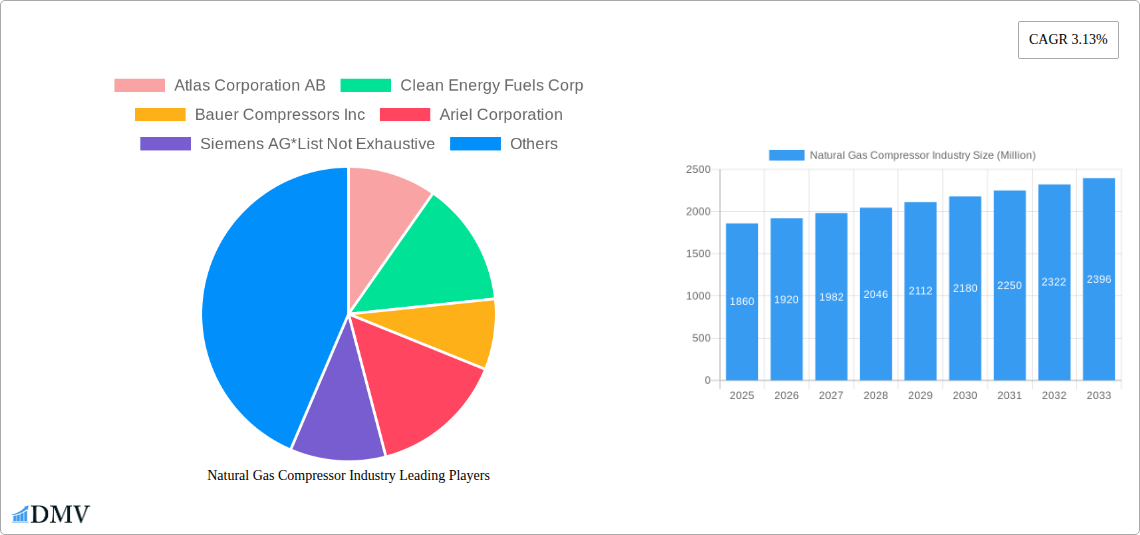
Natural Gas Compressor Industry Market Size (In Billion)
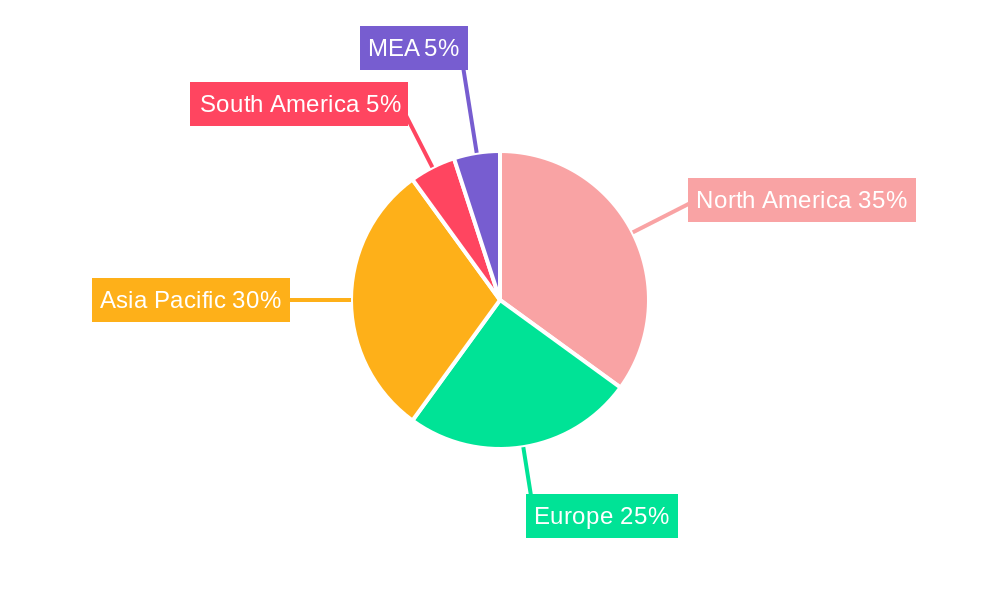
The geographical distribution of the market showcases strong growth in North America and Asia Pacific, reflecting the significant natural gas production and consumption in these regions. North America's established energy infrastructure and the presence of key market players contribute to its substantial market share. Asia-Pacific, driven by rapid industrialization and urbanization in countries like China and India, exhibits high growth potential. Europe also maintains a significant market share owing to its established energy sector and ongoing efforts to diversify energy sources. Emerging markets in the Middle East and Africa are expected to witness gradual but significant growth, supported by investments in gas infrastructure development. The forecast period of 2025-2033 anticipates sustained growth driven by factors such as increased investment in gas pipelines, expanding liquefied natural gas (LNG) infrastructure, and the rising adoption of cleaner energy solutions. The interplay of these factors underscores a positive, albeit moderately paced, growth trajectory for the natural gas compressor market.
Natural Gas Compressor Industry Company Market Share
Natural Gas Compressor Industry Market Report: 2019-2033
This comprehensive report provides a detailed analysis of the Natural Gas Compressor industry, offering invaluable insights for stakeholders seeking to navigate this dynamic market. From market size and segmentation to key players and future trends, this report covers all essential aspects, forecasting market growth from 2025 to 2033, with 2025 as the base year and a historical overview from 2019-2024. The report’s meticulous data analysis and forward-looking projections are crucial for strategic decision-making. The global market value is projected to reach xx Million by 2033.
Natural Gas Compressor Industry Market Composition & Trends
This section delves into the intricate structure of the natural gas compressor market, examining its concentration, innovative drivers, regulatory landscape, substitute technologies, end-user profiles, and merger & acquisition (M&A) activities. The market is moderately concentrated, with several key players holding significant market share. However, the emergence of innovative technologies and the increasing demand for cleaner energy solutions are fostering competition.
- Market Share Distribution: While precise figures vary by segment, the top five players (Atlas Corporation AB, Clean Energy Fuels Corp, Bauer Compressors Inc, Ariel Corporation, and Siemens AG) collectively hold an estimated 40% market share in 2025, with a projected decrease to 35% by 2033 due to increased competition.
- M&A Activity: The historical period (2019-2024) witnessed approximately xx Million in M&A deals, primarily driven by strategic expansions and technology acquisitions. The forecast period (2025-2033) is expected to see a rise in M&A activity, exceeding xx Million, fueled by consolidation within the industry.
- Regulatory Landscape: Stringent emission regulations are driving innovation towards more energy-efficient and environmentally friendly compressor technologies. The changing regulatory landscape necessitates continuous adaptation by industry players.
- Substitute Products: While natural gas remains a dominant energy source, competition from renewable energy sources necessitates the development of compressors compatible with alternative fuels.
Natural Gas Compressor Industry Evolution
This section charts the evolutionary trajectory of the natural gas compressor market, analyzing growth trends, technological advancements, and evolving consumer preferences. The market has witnessed significant growth driven by increasing natural gas production and infrastructure development. This growth is expected to continue, although at a slightly reduced pace compared to the historical period. The adoption of advanced technologies such as digitalization and automation is rapidly changing the landscape.
- Market Growth Trajectories: The market exhibited a Compound Annual Growth Rate (CAGR) of xx% during the historical period (2019-2024). The forecast period (2025-2033) anticipates a CAGR of xx%, albeit a slower rate, reflecting market maturity and the impact of economic factors.
- Technological Advancements: Advancements in materials science, design optimization, and digital technologies are leading to greater efficiency, reliability, and reduced emissions. Adoption rates of advanced technologies, like digital twins, are increasing at an approximate rate of xx% annually.
- Shifting Consumer Demands: Increased focus on sustainability and energy efficiency is driving demand for lower-emission and more energy-efficient compressors. This demand is impacting product design and manufacturing processes.
Leading Regions, Countries, or Segments in Natural Gas Compressor Industry
This section identifies the leading regions, countries, and market segments within the natural gas compressor industry, analyzing the factors contributing to their dominance. North America, with significant shale gas production, and Asia-Pacific, due to rapid industrialization and infrastructure development, are key market drivers.
- Dominant Segment: The reciprocating compressor segment holds a significant market share due to its versatility and adaptability to various applications. The upstream segment is leading in terms of revenue contribution.
- Key Drivers:
- North America: Strong upstream oil and gas exploration, supportive government policies.
- Asia-Pacific: Rapid industrial expansion, growing energy demand, investments in natural gas infrastructure.
- Reciprocating Compressors: Wide applicability, suitability for diverse operating conditions, well-established technology.
- Upstream Applications: High demand for natural gas extraction, exploration activities.
- Dominance Factors: Abundant natural gas resources, supportive government policies, and substantial investments in infrastructure are pivotal factors in market leadership.
Natural Gas Compressor Industry Product Innovations
Recent innovations focus on improving energy efficiency, reducing emissions, and enhancing operational reliability. Advanced materials, improved designs, and integrated digital technologies are key features. Unique selling propositions include enhanced control systems, predictive maintenance capabilities, and modular designs for easier installation and maintenance.
Propelling Factors for Natural Gas Compressor Industry Growth
Several factors are driving the growth of the natural gas compressor industry. These include the increasing demand for natural gas, technological advancements leading to increased efficiency and reduced emissions, and supportive government policies promoting natural gas usage. The expansion of LNG infrastructure is also significantly impacting demand.
Obstacles in the Natural Gas Compressor Industry Market
The industry faces challenges, including fluctuating natural gas prices, supply chain disruptions affecting component availability, and intensifying competition. Stringent environmental regulations and increasing costs associated with compliance also pose challenges. These factors can impact profitability and necessitate strategic adjustments by industry players.
Future Opportunities in Natural Gas Compressor Industry
Future growth will be driven by exploration of new markets, particularly in developing economies, the rise of next-generation compressor technologies (such as those leveraging AI and machine learning), and the growing demand for renewable gas compression.
Major Players in the Natural Gas Compressor Industry Ecosystem
- Atlas Corporation AB
- Clean Energy Fuels Corp
- Bauer Compressors Inc
- Ariel Corporation
- Siemens AG
- Burckhardt Compression Holding AG
- Ingersoll Rand PLC
- General Electric Company
- HMS Group
- Howden Group Ltd
Key Developments in Natural Gas Compressor Industry Industry
- April 2023: Baker Hughes secures a contract from QatarEnergy for the North Field South project, involving the supply of twelve centrifugal compressors driven by six gas turbines. This signals significant investment in the LNG sector and boosts demand for high-capacity compressors.
- January 2022: Burckhardt Compression wins a contract from TECNIMONT for compression solutions for IOCL's polypropylene plant in India. This showcases the expanding role of gas compressors in the petrochemical industry.
Strategic Natural Gas Compressor Industry Market Forecast
The natural gas compressor market is poised for continued growth, driven by several key factors, including the increasing global demand for natural gas, advancements in compressor technology, and expansion of gas infrastructure projects worldwide. The industry's future will be shaped by the adoption of sustainable practices, and the development of innovative technologies designed to reduce emissions and enhance energy efficiency. This trend will continue to drive demand for advanced compressors and present opportunities for industry players.
Natural Gas Compressor Industry Segmentation
-
1. Type
- 1.1. Reciprocating
- 1.2. Screw
-
2. Application
- 2.1. Upstream
- 2.2. Downstream
- 2.3. Midstream
Natural Gas Compressor Industry Segmentation By Geography
-
1. North America
- 1.1. United States
- 1.2. Canada
- 1.3. Mexico
-
2. Europe
- 2.1. Germany
- 2.2. France
- 2.3. Spain
- 2.4. United Kingdom
- 2.5. Rest of Europe
-
3. Asia Pacific
- 3.1. China
- 3.2. India
- 3.3. Malaysia
- 3.4. Indonesia
- 3.5. Rest of Asia Pacifc
-
4. South America
- 4.1. Brazil
- 4.2. Argentina
- 4.3. Colombia
- 4.4. Rest of South America
- 5. Middle East
-
6. Saudi Arabia
- 6.1. United Arab Emirated
- 6.2. Nigeria
- 6.3. South Africa
- 6.4. Rest of Middle East
Natural Gas Compressor Industry Regional Market Share
Geographic Coverage of Natural Gas Compressor Industry
Natural Gas Compressor Industry REPORT HIGHLIGHTS
| Aspects | Details |
|---|---|
| Study Period | 2020-2034 |
| Base Year | 2025 |
| Estimated Year | 2026 |
| Forecast Period | 2026-2034 |
| Historical Period | 2020-2025 |
| Growth Rate | CAGR of 3.13% from 2020-2034 |
| Segmentation |
|
Table of Contents
- 1. Introduction
- 1.1. Research Scope
- 1.2. Market Segmentation
- 1.3. Research Objective
- 1.4. Definitions and Assumptions
- 2. Executive Summary
- 2.1. Market Snapshot
- 3. Market Dynamics
- 3.1. Market Drivers
- 3.2. Market Restrains
- 3.3. Market Trends
- 3.4. Market Opportunities
- 4. Market Factor Analysis
- 4.1. Porters Five Forces
- 4.1.1. Bargaining Power of Suppliers
- 4.1.2. Bargaining Power of Buyers
- 4.1.3. Threat of New Entrants
- 4.1.4. Threat of Substitutes
- 4.1.5. Competitive Rivalry
- 4.2. PESTEL analysis
- 4.3. BCG Analysis
- 4.3.1. Stars (High Growth, High Market Share)
- 4.3.2. Cash Cows (Low Growth, High Market Share)
- 4.3.3. Question Mark (High Growth, Low Market Share)
- 4.3.4. Dogs (Low Growth, Low Market Share)
- 4.4. Ansoff Matrix Analysis
- 4.5. Supply Chain Analysis
- 4.6. Regulatory Landscape
- 4.7. Current Market Potential and Opportunity Assessment (TAM–SAM–SOM Framework)
- 4.8. DMV Analyst Note
- 4.1. Porters Five Forces
- 5. Market Analysis, Insights and Forecast 2021-2033
- 5.1. Market Analysis, Insights and Forecast - by Type
- 5.1.1. Reciprocating
- 5.1.2. Screw
- 5.2. Market Analysis, Insights and Forecast - by Application
- 5.2.1. Upstream
- 5.2.2. Downstream
- 5.2.3. Midstream
- 5.3. Market Analysis, Insights and Forecast - by Region
- 5.3.1. North America
- 5.3.2. Europe
- 5.3.3. Asia Pacific
- 5.3.4. South America
- 5.3.5. Middle East
- 5.3.6. Saudi Arabia
- 5.1. Market Analysis, Insights and Forecast - by Type
- 6. Global Natural Gas Compressor Industry Analysis, Insights and Forecast, 2021-2033
- 6.1. Market Analysis, Insights and Forecast - by Type
- 6.1.1. Reciprocating
- 6.1.2. Screw
- 6.2. Market Analysis, Insights and Forecast - by Application
- 6.2.1. Upstream
- 6.2.2. Downstream
- 6.2.3. Midstream
- 6.1. Market Analysis, Insights and Forecast - by Type
- 7. North America Natural Gas Compressor Industry Analysis, Insights and Forecast, 2020-2032
- 7.1. Market Analysis, Insights and Forecast - by Type
- 7.1.1. Reciprocating
- 7.1.2. Screw
- 7.2. Market Analysis, Insights and Forecast - by Application
- 7.2.1. Upstream
- 7.2.2. Downstream
- 7.2.3. Midstream
- 7.1. Market Analysis, Insights and Forecast - by Type
- 8. Europe Natural Gas Compressor Industry Analysis, Insights and Forecast, 2020-2032
- 8.1. Market Analysis, Insights and Forecast - by Type
- 8.1.1. Reciprocating
- 8.1.2. Screw
- 8.2. Market Analysis, Insights and Forecast - by Application
- 8.2.1. Upstream
- 8.2.2. Downstream
- 8.2.3. Midstream
- 8.1. Market Analysis, Insights and Forecast - by Type
- 9. Asia Pacific Natural Gas Compressor Industry Analysis, Insights and Forecast, 2020-2032
- 9.1. Market Analysis, Insights and Forecast - by Type
- 9.1.1. Reciprocating
- 9.1.2. Screw
- 9.2. Market Analysis, Insights and Forecast - by Application
- 9.2.1. Upstream
- 9.2.2. Downstream
- 9.2.3. Midstream
- 9.1. Market Analysis, Insights and Forecast - by Type
- 10. South America Natural Gas Compressor Industry Analysis, Insights and Forecast, 2020-2032
- 10.1. Market Analysis, Insights and Forecast - by Type
- 10.1.1. Reciprocating
- 10.1.2. Screw
- 10.2. Market Analysis, Insights and Forecast - by Application
- 10.2.1. Upstream
- 10.2.2. Downstream
- 10.2.3. Midstream
- 10.1. Market Analysis, Insights and Forecast - by Type
- 11. Middle East Natural Gas Compressor Industry Analysis, Insights and Forecast, 2020-2032
- 11.1. Market Analysis, Insights and Forecast - by Type
- 11.1.1. Reciprocating
- 11.1.2. Screw
- 11.2. Market Analysis, Insights and Forecast - by Application
- 11.2.1. Upstream
- 11.2.2. Downstream
- 11.2.3. Midstream
- 11.1. Market Analysis, Insights and Forecast - by Type
- 12. Saudi Arabia Natural Gas Compressor Industry Analysis, Insights and Forecast, 2020-2032
- 12.1. Market Analysis, Insights and Forecast - by Type
- 12.1.1. Reciprocating
- 12.1.2. Screw
- 12.2. Market Analysis, Insights and Forecast - by Application
- 12.2.1. Upstream
- 12.2.2. Downstream
- 12.2.3. Midstream
- 12.1. Market Analysis, Insights and Forecast - by Type
- 13. Competitive Analysis
- 13.1. Company Profiles
- 13.1.1 Atlas Corporation AB
- 13.1.1.1. Company Overview
- 13.1.1.2. Products
- 13.1.1.3. Company Financials
- 13.1.1.4. SWOT Analysis
- 13.1.2 Clean Energy Fuels Corp
- 13.1.2.1. Company Overview
- 13.1.2.2. Products
- 13.1.2.3. Company Financials
- 13.1.2.4. SWOT Analysis
- 13.1.3 Bauer Compressors Inc
- 13.1.3.1. Company Overview
- 13.1.3.2. Products
- 13.1.3.3. Company Financials
- 13.1.3.4. SWOT Analysis
- 13.1.4 Ariel Corporation
- 13.1.4.1. Company Overview
- 13.1.4.2. Products
- 13.1.4.3. Company Financials
- 13.1.4.4. SWOT Analysis
- 13.1.5 Siemens AG*List Not Exhaustive
- 13.1.5.1. Company Overview
- 13.1.5.2. Products
- 13.1.5.3. Company Financials
- 13.1.5.4. SWOT Analysis
- 13.1.6 Burckhardt Compression Holding AG
- 13.1.6.1. Company Overview
- 13.1.6.2. Products
- 13.1.6.3. Company Financials
- 13.1.6.4. SWOT Analysis
- 13.1.7 Ingersoll Rand PLC
- 13.1.7.1. Company Overview
- 13.1.7.2. Products
- 13.1.7.3. Company Financials
- 13.1.7.4. SWOT Analysis
- 13.1.8 General Electric Company
- 13.1.8.1. Company Overview
- 13.1.8.2. Products
- 13.1.8.3. Company Financials
- 13.1.8.4. SWOT Analysis
- 13.1.9 HMS Group
- 13.1.9.1. Company Overview
- 13.1.9.2. Products
- 13.1.9.3. Company Financials
- 13.1.9.4. SWOT Analysis
- 13.1.10 Howden Group Ltd
- 13.1.10.1. Company Overview
- 13.1.10.2. Products
- 13.1.10.3. Company Financials
- 13.1.10.4. SWOT Analysis
- 13.1.1 Atlas Corporation AB
- 13.2. Market Entropy
- 13.2.1 Company's Key Areas Served
- 13.2.2 Recent Developments
- 13.3. Company Market Share Analysis 2025
- 13.3.1 Top 5 Companies Market Share Analysis
- 13.3.2 Top 3 Companies Market Share Analysis
- 13.4. List of Potential Customers
- 14. Research Methodology
List of Figures
- Figure 1: Global Natural Gas Compressor Industry Revenue Breakdown (Million, %) by Region 2025 & 2033
- Figure 2: North America Natural Gas Compressor Industry Revenue (Million), by Type 2025 & 2033
- Figure 3: North America Natural Gas Compressor Industry Revenue Share (%), by Type 2025 & 2033
- Figure 4: North America Natural Gas Compressor Industry Revenue (Million), by Application 2025 & 2033
- Figure 5: North America Natural Gas Compressor Industry Revenue Share (%), by Application 2025 & 2033
- Figure 6: North America Natural Gas Compressor Industry Revenue (Million), by Country 2025 & 2033
- Figure 7: North America Natural Gas Compressor Industry Revenue Share (%), by Country 2025 & 2033
- Figure 8: Europe Natural Gas Compressor Industry Revenue (Million), by Type 2025 & 2033
- Figure 9: Europe Natural Gas Compressor Industry Revenue Share (%), by Type 2025 & 2033
- Figure 10: Europe Natural Gas Compressor Industry Revenue (Million), by Application 2025 & 2033
- Figure 11: Europe Natural Gas Compressor Industry Revenue Share (%), by Application 2025 & 2033
- Figure 12: Europe Natural Gas Compressor Industry Revenue (Million), by Country 2025 & 2033
- Figure 13: Europe Natural Gas Compressor Industry Revenue Share (%), by Country 2025 & 2033
- Figure 14: Asia Pacific Natural Gas Compressor Industry Revenue (Million), by Type 2025 & 2033
- Figure 15: Asia Pacific Natural Gas Compressor Industry Revenue Share (%), by Type 2025 & 2033
- Figure 16: Asia Pacific Natural Gas Compressor Industry Revenue (Million), by Application 2025 & 2033
- Figure 17: Asia Pacific Natural Gas Compressor Industry Revenue Share (%), by Application 2025 & 2033
- Figure 18: Asia Pacific Natural Gas Compressor Industry Revenue (Million), by Country 2025 & 2033
- Figure 19: Asia Pacific Natural Gas Compressor Industry Revenue Share (%), by Country 2025 & 2033
- Figure 20: South America Natural Gas Compressor Industry Revenue (Million), by Type 2025 & 2033
- Figure 21: South America Natural Gas Compressor Industry Revenue Share (%), by Type 2025 & 2033
- Figure 22: South America Natural Gas Compressor Industry Revenue (Million), by Application 2025 & 2033
- Figure 23: South America Natural Gas Compressor Industry Revenue Share (%), by Application 2025 & 2033
- Figure 24: South America Natural Gas Compressor Industry Revenue (Million), by Country 2025 & 2033
- Figure 25: South America Natural Gas Compressor Industry Revenue Share (%), by Country 2025 & 2033
- Figure 26: Middle East Natural Gas Compressor Industry Revenue (Million), by Type 2025 & 2033
- Figure 27: Middle East Natural Gas Compressor Industry Revenue Share (%), by Type 2025 & 2033
- Figure 28: Middle East Natural Gas Compressor Industry Revenue (Million), by Application 2025 & 2033
- Figure 29: Middle East Natural Gas Compressor Industry Revenue Share (%), by Application 2025 & 2033
- Figure 30: Middle East Natural Gas Compressor Industry Revenue (Million), by Country 2025 & 2033
- Figure 31: Middle East Natural Gas Compressor Industry Revenue Share (%), by Country 2025 & 2033
- Figure 32: Saudi Arabia Natural Gas Compressor Industry Revenue (Million), by Type 2025 & 2033
- Figure 33: Saudi Arabia Natural Gas Compressor Industry Revenue Share (%), by Type 2025 & 2033
- Figure 34: Saudi Arabia Natural Gas Compressor Industry Revenue (Million), by Application 2025 & 2033
- Figure 35: Saudi Arabia Natural Gas Compressor Industry Revenue Share (%), by Application 2025 & 2033
- Figure 36: Saudi Arabia Natural Gas Compressor Industry Revenue (Million), by Country 2025 & 2033
- Figure 37: Saudi Arabia Natural Gas Compressor Industry Revenue Share (%), by Country 2025 & 2033
List of Tables
- Table 1: Global Natural Gas Compressor Industry Revenue Million Forecast, by Type 2020 & 2033
- Table 2: Global Natural Gas Compressor Industry Revenue Million Forecast, by Application 2020 & 2033
- Table 3: Global Natural Gas Compressor Industry Revenue Million Forecast, by Region 2020 & 2033
- Table 4: Global Natural Gas Compressor Industry Revenue Million Forecast, by Type 2020 & 2033
- Table 5: Global Natural Gas Compressor Industry Revenue Million Forecast, by Application 2020 & 2033
- Table 6: Global Natural Gas Compressor Industry Revenue Million Forecast, by Country 2020 & 2033
- Table 7: United States Natural Gas Compressor Industry Revenue (Million) Forecast, by Application 2020 & 2033
- Table 8: Canada Natural Gas Compressor Industry Revenue (Million) Forecast, by Application 2020 & 2033
- Table 9: Mexico Natural Gas Compressor Industry Revenue (Million) Forecast, by Application 2020 & 2033
- Table 10: Global Natural Gas Compressor Industry Revenue Million Forecast, by Type 2020 & 2033
- Table 11: Global Natural Gas Compressor Industry Revenue Million Forecast, by Application 2020 & 2033
- Table 12: Global Natural Gas Compressor Industry Revenue Million Forecast, by Country 2020 & 2033
- Table 13: Germany Natural Gas Compressor Industry Revenue (Million) Forecast, by Application 2020 & 2033
- Table 14: France Natural Gas Compressor Industry Revenue (Million) Forecast, by Application 2020 & 2033
- Table 15: Spain Natural Gas Compressor Industry Revenue (Million) Forecast, by Application 2020 & 2033
- Table 16: United Kingdom Natural Gas Compressor Industry Revenue (Million) Forecast, by Application 2020 & 2033
- Table 17: Rest of Europe Natural Gas Compressor Industry Revenue (Million) Forecast, by Application 2020 & 2033
- Table 18: Global Natural Gas Compressor Industry Revenue Million Forecast, by Type 2020 & 2033
- Table 19: Global Natural Gas Compressor Industry Revenue Million Forecast, by Application 2020 & 2033
- Table 20: Global Natural Gas Compressor Industry Revenue Million Forecast, by Country 2020 & 2033
- Table 21: China Natural Gas Compressor Industry Revenue (Million) Forecast, by Application 2020 & 2033
- Table 22: India Natural Gas Compressor Industry Revenue (Million) Forecast, by Application 2020 & 2033
- Table 23: Malaysia Natural Gas Compressor Industry Revenue (Million) Forecast, by Application 2020 & 2033
- Table 24: Indonesia Natural Gas Compressor Industry Revenue (Million) Forecast, by Application 2020 & 2033
- Table 25: Rest of Asia Pacifc Natural Gas Compressor Industry Revenue (Million) Forecast, by Application 2020 & 2033
- Table 26: Global Natural Gas Compressor Industry Revenue Million Forecast, by Type 2020 & 2033
- Table 27: Global Natural Gas Compressor Industry Revenue Million Forecast, by Application 2020 & 2033
- Table 28: Global Natural Gas Compressor Industry Revenue Million Forecast, by Country 2020 & 2033
- Table 29: Brazil Natural Gas Compressor Industry Revenue (Million) Forecast, by Application 2020 & 2033
- Table 30: Argentina Natural Gas Compressor Industry Revenue (Million) Forecast, by Application 2020 & 2033
- Table 31: Colombia Natural Gas Compressor Industry Revenue (Million) Forecast, by Application 2020 & 2033
- Table 32: Rest of South America Natural Gas Compressor Industry Revenue (Million) Forecast, by Application 2020 & 2033
- Table 33: Global Natural Gas Compressor Industry Revenue Million Forecast, by Type 2020 & 2033
- Table 34: Global Natural Gas Compressor Industry Revenue Million Forecast, by Application 2020 & 2033
- Table 35: Global Natural Gas Compressor Industry Revenue Million Forecast, by Country 2020 & 2033
- Table 36: Global Natural Gas Compressor Industry Revenue Million Forecast, by Type 2020 & 2033
- Table 37: Global Natural Gas Compressor Industry Revenue Million Forecast, by Application 2020 & 2033
- Table 38: Global Natural Gas Compressor Industry Revenue Million Forecast, by Country 2020 & 2033
- Table 39: United Arab Emirated Natural Gas Compressor Industry Revenue (Million) Forecast, by Application 2020 & 2033
- Table 40: Nigeria Natural Gas Compressor Industry Revenue (Million) Forecast, by Application 2020 & 2033
- Table 41: South Africa Natural Gas Compressor Industry Revenue (Million) Forecast, by Application 2020 & 2033
- Table 42: Rest of Middle East Natural Gas Compressor Industry Revenue (Million) Forecast, by Application 2020 & 2033
Frequently Asked Questions
1. What is the projected Compound Annual Growth Rate (CAGR) of the Natural Gas Compressor Industry?
The projected CAGR is approximately 3.13%.
2. Which companies are prominent players in the Natural Gas Compressor Industry?
Key companies in the market include Atlas Corporation AB, Clean Energy Fuels Corp, Bauer Compressors Inc, Ariel Corporation, Siemens AG*List Not Exhaustive, Burckhardt Compression Holding AG, Ingersoll Rand PLC, General Electric Company, HMS Group, Howden Group Ltd.
3. What are the main segments of the Natural Gas Compressor Industry?
The market segments include Type, Application.
4. Can you provide details about the market size?
The market size is estimated to be USD 1.86 Million as of 2022.
5. What are some drivers contributing to market growth?
4.; Growth in Natural Gas Consumption for Various Applications.
6. What are the notable trends driving market growth?
Midstream Sector Expected to Dominate the Market.
7. Are there any restraints impacting market growth?
4.; Growing Penetration of Renewables in the Energy Sector.
8. Can you provide examples of recent developments in the market?
April 2023: Oilfield services specialist Baker Hughes has been awarded a contract to supply partner QatarEnergy with two main refrigerant compressors (MRCs) for Qatar's North Field South (NFS) project. Qatargas will execute the expansion project. Each MRC train will consist of three Frame 9E DLN Ultra Low NOx gas turbines and six centrifugal compressors across two LNG trains for a total scope of supply of six gas turbines to drive 12 compressors.
9. What pricing options are available for accessing the report?
Pricing options include single-user, multi-user, and enterprise licenses priced at USD 4750, USD 5250, and USD 8750 respectively.
10. Is the market size provided in terms of value or volume?
The market size is provided in terms of value, measured in Million.
11. Are there any specific market keywords associated with the report?
Yes, the market keyword associated with the report is "Natural Gas Compressor Industry," which aids in identifying and referencing the specific market segment covered.
12. How do I determine which pricing option suits my needs best?
The pricing options vary based on user requirements and access needs. Individual users may opt for single-user licenses, while businesses requiring broader access may choose multi-user or enterprise licenses for cost-effective access to the report.
13. Are there any additional resources or data provided in the Natural Gas Compressor Industry report?
While the report offers comprehensive insights, it's advisable to review the specific contents or supplementary materials provided to ascertain if additional resources or data are available.
14. How can I stay updated on further developments or reports in the Natural Gas Compressor Industry?
To stay informed about further developments, trends, and reports in the Natural Gas Compressor Industry, consider subscribing to industry newsletters, following relevant companies and organizations, or regularly checking reputable industry news sources and publications.
Methodology
Step 1 - Identification of Relevant Samples Size from Population Database


Step 2 - Approaches for Defining Global Market Size (Value, Volume* & Price*)

Note*: In applicable scenarios
Step 3 - Data Sources
Primary Research
- Web Analytics
- Survey Reports
- Research Institute
- Latest Research Reports
- Opinion Leaders
Secondary Research
- Annual Reports
- White Paper
- Latest Press Release
- Industry Association
- Paid Database
- Investor Presentations

Step 4 - Data Triangulation
Involves using different sources of information in order to increase the validity of a study
These sources are likely to be stakeholders in a program - participants, other researchers, program staff, other community members, and so on.
Then we put all data in single framework & apply various statistical tools to find out the dynamic on the market.
During the analysis stage, feedback from the stakeholder groups would be compared to determine areas of agreement as well as areas of divergence