

Key Insights
The Molten Salt Thermal Energy Storage (MSTE) market is poised for significant expansion, driven by the escalating demand for dependable energy storage to integrate intermittent renewable sources such as solar and wind power. Key growth catalysts include supportive government incentives for renewable energy adoption, declining molten salt technology costs, and growing environmental concerns. Advancements in parabolic troughs, Fresnel reflectors, and power tower systems are enhancing MSTE efficiency and scalability. The market is valued at $2.22 billion in 2025 and is projected to grow at a Compound Annual Growth Rate (CAGR) of 9.8%. North America and Europe currently lead the market, with the United States and Germany as prominent contributors. However, Asia-Pacific, particularly China and India, is expected to witness rapid growth due to substantial investments in renewable energy infrastructure and rising energy needs.
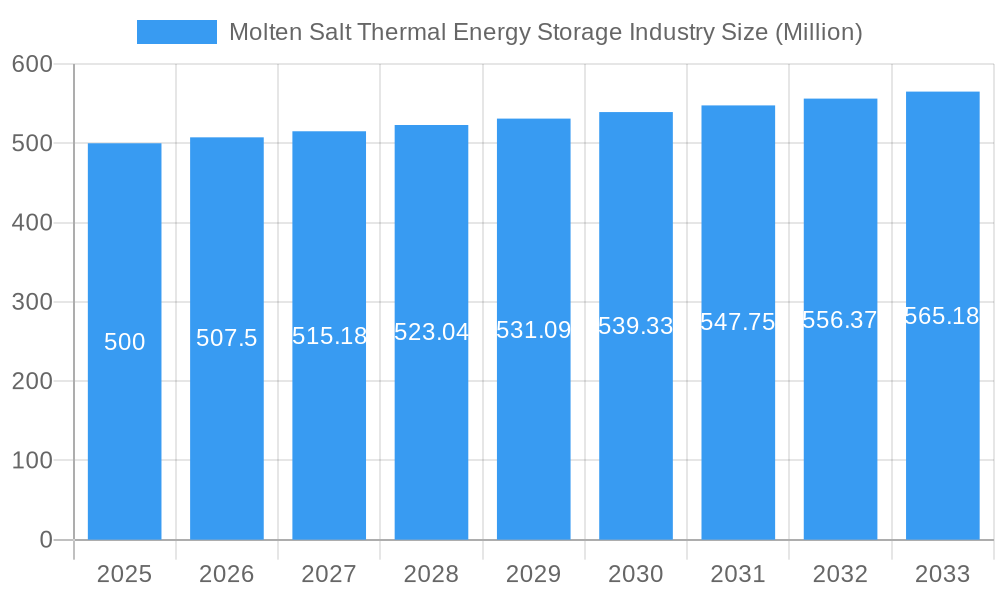
Molten Salt Thermal Energy Storage Industry Market Size (In Billion)
Despite a favorable outlook, challenges persist, including high initial investment costs for MSTE systems, which can be a hurdle for smaller projects. The requirement for specialized materials and expertise in handling high-temperature molten salts also presents operational complexities. Continuous technological advancements and stringent safety protocols are crucial for improving the long-term durability and safety of MSTE systems, thereby fostering wider adoption. Nonetheless, sustained research and development, coupled with favorable government policies and the increasing imperative for clean energy, are expected to overcome these restraints and drive substantial MSTE market growth. Leading companies such as SCHOTT AG and SolarReserve LLC are at the forefront of innovation, focusing on enhancing efficiency, reducing costs, and bolstering the safety of MSTE technologies, ultimately shaping the future of this vital energy storage sector.
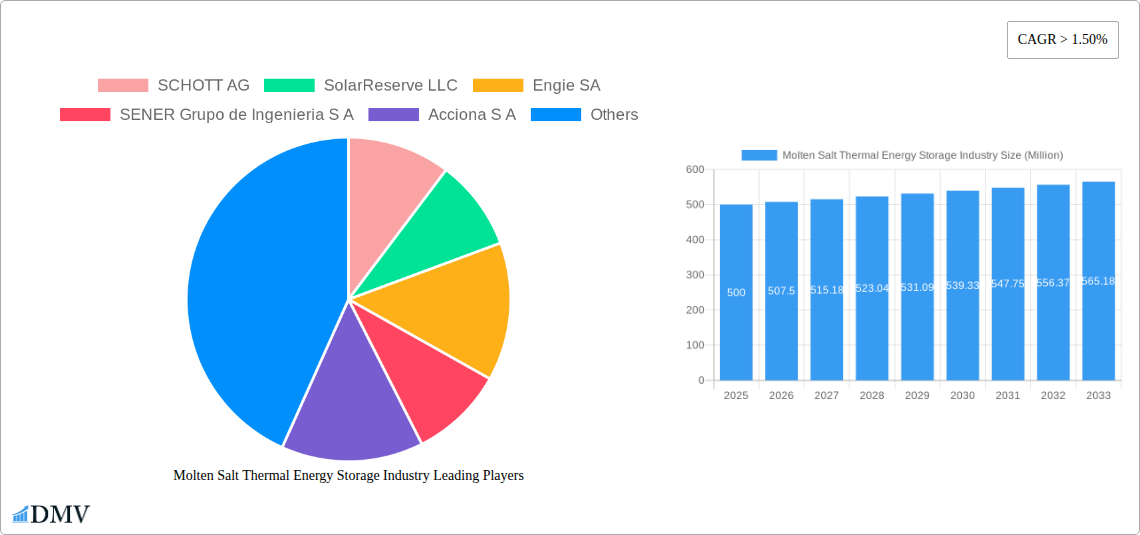
Molten Salt Thermal Energy Storage Industry Company Market Share
Molten Salt Thermal Energy Storage Industry: A Comprehensive Market Report (2019-2033)
This insightful report provides a comprehensive analysis of the Molten Salt Thermal Energy Storage (MSTS) industry, offering a detailed overview of market trends, technological advancements, and future growth prospects. The study period covers 2019-2033, with a base year of 2025 and a forecast period of 2025-2033. The report delves into key market segments, including Parabolic Troughs, Fresnel Reflectors, and Power Towers, and profiles major players such as SCHOTT AG, SolarReserve LLC, Engie SA, SENER Grupo de Ingenieria S A, Acciona S A, Abengoa SA, Yara International ASA, and BrightSource Energy Inc. This report is essential for stakeholders seeking to understand the current market landscape and navigate the future of MSTS technology.
Molten Salt Thermal Energy Storage Industry Market Composition & Trends
The Molten Salt Thermal Energy Storage (MSTS) market exhibits a moderately concentrated landscape, with a few major players holding significant market share. The market share distribution in 2025 is estimated as follows: SCHOTT AG (xx%), SolarReserve LLC (xx%), Engie SA (xx%), and others (xx%). Innovation is driven by the need for efficient and cost-effective energy storage solutions to support renewable energy integration. Stringent environmental regulations and government incentives are key catalysts, while competition from other energy storage technologies presents a significant challenge. The M&A activity in the MSTS market is relatively low, with a total deal value of approximately $xx Million in the historical period (2019-2024). Key end-users include power generation companies, industrial facilities, and utility companies.
- Market Concentration: Moderately concentrated, with key players holding significant shares.
- Innovation Catalysts: Stringent environmental regulations, government incentives, and the need for efficient energy storage.
- Regulatory Landscape: Supportive in many regions, driving adoption with subsidies and mandates.
- Substitute Products: Battery storage, pumped hydro storage, compressed air energy storage.
- End-User Profiles: Power generation companies, industrial facilities, and utilities.
- M&A Activity: Low, with a total deal value of approximately $xx Million (2019-2024).
Molten Salt Thermal Energy Storage Industry Industry Evolution
The MSTS industry has witnessed significant growth in recent years, driven by increasing demand for renewable energy and the need for reliable energy storage solutions. The market experienced a Compound Annual Growth Rate (CAGR) of xx% during the historical period (2019-2024) and is projected to grow at a CAGR of xx% during the forecast period (2025-2033), reaching a market value of $xx Million by 2033. This growth is fueled by advancements in molten salt technology, leading to improved efficiency and reduced costs. Consumer demand is shifting towards more sustainable and reliable energy solutions, further boosting the adoption of MSTS. The integration of MSTS with renewable energy sources like solar and wind power is a significant driver, enhancing grid stability and reducing reliance on fossil fuels. Technological advancements like improved heat transfer fluids and more efficient storage systems are also contributing to the market's expansion. The adoption rate of MSTS is steadily increasing, particularly in regions with high renewable energy penetration.
Leading Regions, Countries, or Segments in Molten Salt Thermal Energy Storage Industry
The North American region currently holds the leading position in the MSTS market, driven primarily by strong government support for renewable energy and significant investments in large-scale solar thermal power plants.
- Key Drivers in North America:
- High investment in renewable energy infrastructure.
- Favorable regulatory environment and government incentives.
- Significant presence of major MSTS technology providers.
- Growing demand for reliable and efficient energy storage.
- Increasing integration with solar thermal power plants.
Among the technologies, Parabolic Trough systems currently dominate the market, accounting for approximately xx% of the total market share in 2025. This dominance is primarily due to the relatively mature technology, cost-effectiveness, and proven track record. However, Fresnel reflectors and Power Towers are also showing significant growth potential, driven by technological advancements and increasing efficiency.
Molten Salt Thermal Energy Storage Industry Product Innovations
Recent innovations in MSTS technology focus on enhancing thermal efficiency, reducing material costs, and improving system lifespan. Advanced molten salt formulations, improved heat transfer systems, and innovative storage tank designs are leading to higher energy storage capacity and reduced energy losses. These advancements are coupled with the development of more robust and reliable control systems, ensuring optimal performance and long-term stability. The unique selling proposition of MSTS lies in its ability to store large amounts of thermal energy at high temperatures, providing reliable and dispatchable power for extended periods.
Propelling Factors for Molten Salt Thermal Energy Storage Industry Growth
The growth of the MSTS industry is primarily driven by the increasing need for efficient and reliable energy storage solutions to support the integration of renewable energy sources, particularly solar and wind power. Government policies promoting renewable energy and supportive regulations are also significant catalysts. The declining cost of molten salt technology and increasing efficiency are further boosting market adoption. Furthermore, the potential for MSTS to provide ancillary services to the power grid, enhancing grid stability and reliability, presents a significant growth opportunity.
Obstacles in the Molten Salt Thermal Energy Storage Industry Market
The MSTS market faces several challenges, including the high upfront capital costs associated with deploying large-scale storage systems. Supply chain disruptions and the availability of specialized materials can also hinder project development. Competition from alternative energy storage technologies, such as battery storage, presents a significant challenge, particularly in smaller-scale applications. Regulatory uncertainties and lack of standardized guidelines in certain regions can also impede market growth. These factors can lead to project delays and increased costs.
Future Opportunities in Molten Salt Thermal Energy Storage Industry
Future opportunities for the MSTS market lie in the expansion into new geographical regions with high renewable energy potential. Technological advancements focusing on improving energy density, reducing costs, and enhancing system lifespan will further drive market growth. The integration of MSTS with other energy storage technologies, such as batteries, could create hybrid systems providing optimal performance and flexibility. Emerging applications in industrial process heat and district heating also hold significant potential.
Major Players in the Molten Salt Thermal Energy Storage Industry Ecosystem
- SCHOTT AG
- SolarReserve LLC
- Engie SA
- SENER Grupo de Ingenieria S A
- Acciona S A
- Abengoa SA
- Yara International ASA
- BrightSource Energy Inc
Key Developments in Molten Salt Thermal Energy Storage Industry Industry
- November 2022: Hyme Energy ApS partners with Bornholms Energi & Forsyning (BEOF) to build a 1 MW/20 MWh molten salt thermal energy storage demonstrator in Bornholm, Denmark. This project signifies the growing interest in smaller-scale MSTS applications and the potential for providing multiple services (heat, power, ancillary services) from a single facility. The completion in 2024 will showcase the technology's viability and attract further investment.
Strategic Molten Salt Thermal Energy Storage Industry Market Forecast
The MSTS market is poised for substantial growth, driven by the increasing need for reliable and cost-effective energy storage to support the global transition towards renewable energy. Continued technological advancements, supportive government policies, and declining costs will further propel market expansion. The focus on hybrid systems, integrating MSTS with other energy storage solutions, and expanding into new applications will unlock significant market opportunities in the coming years. The market is expected to witness a substantial increase in investment and deployment of MSTS systems, contributing to a significant growth trajectory throughout the forecast period.
Molten Salt Thermal Energy Storage Industry Segmentation
-
1. Technology
- 1.1. Parabolic Troughs
- 1.2. Fresnel Reflector
- 1.3. Power Tower
Molten Salt Thermal Energy Storage Industry Segmentation By Geography
- 1. North America
- 2. Asia Pacific
- 3. Europe
- 4. South America
- 5. Middle East and Africa
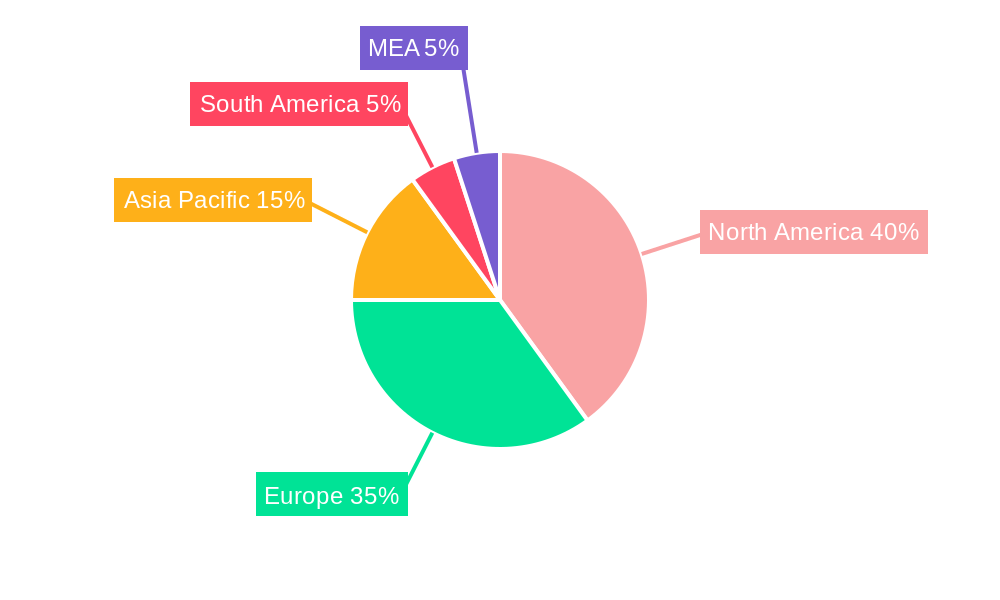
Molten Salt Thermal Energy Storage Industry Regional Market Share
Geographic Coverage of Molten Salt Thermal Energy Storage Industry
Molten Salt Thermal Energy Storage Industry REPORT HIGHLIGHTS
| Aspects | Details |
|---|---|
| Study Period | 2020-2034 |
| Base Year | 2025 |
| Estimated Year | 2026 |
| Forecast Period | 2026-2034 |
| Historical Period | 2020-2025 |
| Growth Rate | CAGR of 9.8% from 2020-2034 |
| Segmentation |
|
Table of Contents
- 1. Introduction
- 1.1. Research Scope
- 1.2. Market Segmentation
- 1.3. Research Objective
- 1.4. Definitions and Assumptions
- 2. Executive Summary
- 2.1. Market Snapshot
- 3. Market Dynamics
- 3.1. Market Drivers
- 3.2. Market Restrains
- 3.3. Market Trends
- 3.4. Market Opportunities
- 4. Market Factor Analysis
- 4.1. Porters Five Forces
- 4.1.1. Bargaining Power of Suppliers
- 4.1.2. Bargaining Power of Buyers
- 4.1.3. Threat of New Entrants
- 4.1.4. Threat of Substitutes
- 4.1.5. Competitive Rivalry
- 4.2. PESTEL analysis
- 4.3. BCG Analysis
- 4.3.1. Stars (High Growth, High Market Share)
- 4.3.2. Cash Cows (Low Growth, High Market Share)
- 4.3.3. Question Mark (High Growth, Low Market Share)
- 4.3.4. Dogs (Low Growth, Low Market Share)
- 4.4. Ansoff Matrix Analysis
- 4.5. Supply Chain Analysis
- 4.6. Regulatory Landscape
- 4.7. Current Market Potential and Opportunity Assessment (TAM–SAM–SOM Framework)
- 4.8. DMV Analyst Note
- 4.1. Porters Five Forces
- 5. Market Analysis, Insights and Forecast 2021-2033
- 5.1. Market Analysis, Insights and Forecast - by Technology
- 5.1.1. Parabolic Troughs
- 5.1.2. Fresnel Reflector
- 5.1.3. Power Tower
- 5.2. Market Analysis, Insights and Forecast - by Region
- 5.2.1. North America
- 5.2.2. Asia Pacific
- 5.2.3. Europe
- 5.2.4. South America
- 5.2.5. Middle East and Africa
- 5.1. Market Analysis, Insights and Forecast - by Technology
- 6. Global Molten Salt Thermal Energy Storage Industry Analysis, Insights and Forecast, 2021-2033
- 6.1. Market Analysis, Insights and Forecast - by Technology
- 6.1.1. Parabolic Troughs
- 6.1.2. Fresnel Reflector
- 6.1.3. Power Tower
- 6.1. Market Analysis, Insights and Forecast - by Technology
- 7. North America Molten Salt Thermal Energy Storage Industry Analysis, Insights and Forecast, 2020-2032
- 7.1. Market Analysis, Insights and Forecast - by Technology
- 7.1.1. Parabolic Troughs
- 7.1.2. Fresnel Reflector
- 7.1.3. Power Tower
- 7.1. Market Analysis, Insights and Forecast - by Technology
- 8. Asia Pacific Molten Salt Thermal Energy Storage Industry Analysis, Insights and Forecast, 2020-2032
- 8.1. Market Analysis, Insights and Forecast - by Technology
- 8.1.1. Parabolic Troughs
- 8.1.2. Fresnel Reflector
- 8.1.3. Power Tower
- 8.1. Market Analysis, Insights and Forecast - by Technology
- 9. Europe Molten Salt Thermal Energy Storage Industry Analysis, Insights and Forecast, 2020-2032
- 9.1. Market Analysis, Insights and Forecast - by Technology
- 9.1.1. Parabolic Troughs
- 9.1.2. Fresnel Reflector
- 9.1.3. Power Tower
- 9.1. Market Analysis, Insights and Forecast - by Technology
- 10. South America Molten Salt Thermal Energy Storage Industry Analysis, Insights and Forecast, 2020-2032
- 10.1. Market Analysis, Insights and Forecast - by Technology
- 10.1.1. Parabolic Troughs
- 10.1.2. Fresnel Reflector
- 10.1.3. Power Tower
- 10.1. Market Analysis, Insights and Forecast - by Technology
- 11. Middle East and Africa Molten Salt Thermal Energy Storage Industry Analysis, Insights and Forecast, 2020-2032
- 11.1. Market Analysis, Insights and Forecast - by Technology
- 11.1.1. Parabolic Troughs
- 11.1.2. Fresnel Reflector
- 11.1.3. Power Tower
- 11.1. Market Analysis, Insights and Forecast - by Technology
- 12. Competitive Analysis
- 12.1. Company Profiles
- 12.1.1 SCHOTT AG
- 12.1.1.1. Company Overview
- 12.1.1.2. Products
- 12.1.1.3. Company Financials
- 12.1.1.4. SWOT Analysis
- 12.1.2 SolarReserve LLC
- 12.1.2.1. Company Overview
- 12.1.2.2. Products
- 12.1.2.3. Company Financials
- 12.1.2.4. SWOT Analysis
- 12.1.3 Engie SA
- 12.1.3.1. Company Overview
- 12.1.3.2. Products
- 12.1.3.3. Company Financials
- 12.1.3.4. SWOT Analysis
- 12.1.4 SENER Grupo de Ingenieria S A
- 12.1.4.1. Company Overview
- 12.1.4.2. Products
- 12.1.4.3. Company Financials
- 12.1.4.4. SWOT Analysis
- 12.1.5 Acciona S A
- 12.1.5.1. Company Overview
- 12.1.5.2. Products
- 12.1.5.3. Company Financials
- 12.1.5.4. SWOT Analysis
- 12.1.6 Abengoa SA
- 12.1.6.1. Company Overview
- 12.1.6.2. Products
- 12.1.6.3. Company Financials
- 12.1.6.4. SWOT Analysis
- 12.1.7 Yara International ASA
- 12.1.7.1. Company Overview
- 12.1.7.2. Products
- 12.1.7.3. Company Financials
- 12.1.7.4. SWOT Analysis
- 12.1.8 BrightSource Energy Inc
- 12.1.8.1. Company Overview
- 12.1.8.2. Products
- 12.1.8.3. Company Financials
- 12.1.8.4. SWOT Analysis
- 12.1.1 SCHOTT AG
- 12.2. Market Entropy
- 12.2.1 Company's Key Areas Served
- 12.2.2 Recent Developments
- 12.3. Company Market Share Analysis 2025
- 12.3.1 Top 5 Companies Market Share Analysis
- 12.3.2 Top 3 Companies Market Share Analysis
- 12.4. List of Potential Customers
- 13. Research Methodology
List of Figures
- Figure 1: Global Molten Salt Thermal Energy Storage Industry Revenue Breakdown (billion, %) by Region 2025 & 2033
- Figure 2: North America Molten Salt Thermal Energy Storage Industry Revenue (billion), by Technology 2025 & 2033
- Figure 3: North America Molten Salt Thermal Energy Storage Industry Revenue Share (%), by Technology 2025 & 2033
- Figure 4: North America Molten Salt Thermal Energy Storage Industry Revenue (billion), by Country 2025 & 2033
- Figure 5: North America Molten Salt Thermal Energy Storage Industry Revenue Share (%), by Country 2025 & 2033
- Figure 6: Asia Pacific Molten Salt Thermal Energy Storage Industry Revenue (billion), by Technology 2025 & 2033
- Figure 7: Asia Pacific Molten Salt Thermal Energy Storage Industry Revenue Share (%), by Technology 2025 & 2033
- Figure 8: Asia Pacific Molten Salt Thermal Energy Storage Industry Revenue (billion), by Country 2025 & 2033
- Figure 9: Asia Pacific Molten Salt Thermal Energy Storage Industry Revenue Share (%), by Country 2025 & 2033
- Figure 10: Europe Molten Salt Thermal Energy Storage Industry Revenue (billion), by Technology 2025 & 2033
- Figure 11: Europe Molten Salt Thermal Energy Storage Industry Revenue Share (%), by Technology 2025 & 2033
- Figure 12: Europe Molten Salt Thermal Energy Storage Industry Revenue (billion), by Country 2025 & 2033
- Figure 13: Europe Molten Salt Thermal Energy Storage Industry Revenue Share (%), by Country 2025 & 2033
- Figure 14: South America Molten Salt Thermal Energy Storage Industry Revenue (billion), by Technology 2025 & 2033
- Figure 15: South America Molten Salt Thermal Energy Storage Industry Revenue Share (%), by Technology 2025 & 2033
- Figure 16: South America Molten Salt Thermal Energy Storage Industry Revenue (billion), by Country 2025 & 2033
- Figure 17: South America Molten Salt Thermal Energy Storage Industry Revenue Share (%), by Country 2025 & 2033
- Figure 18: Middle East and Africa Molten Salt Thermal Energy Storage Industry Revenue (billion), by Technology 2025 & 2033
- Figure 19: Middle East and Africa Molten Salt Thermal Energy Storage Industry Revenue Share (%), by Technology 2025 & 2033
- Figure 20: Middle East and Africa Molten Salt Thermal Energy Storage Industry Revenue (billion), by Country 2025 & 2033
- Figure 21: Middle East and Africa Molten Salt Thermal Energy Storage Industry Revenue Share (%), by Country 2025 & 2033
List of Tables
- Table 1: Global Molten Salt Thermal Energy Storage Industry Revenue billion Forecast, by Technology 2020 & 2033
- Table 2: Global Molten Salt Thermal Energy Storage Industry Revenue billion Forecast, by Region 2020 & 2033
- Table 3: Global Molten Salt Thermal Energy Storage Industry Revenue billion Forecast, by Technology 2020 & 2033
- Table 4: Global Molten Salt Thermal Energy Storage Industry Revenue billion Forecast, by Country 2020 & 2033
- Table 5: Global Molten Salt Thermal Energy Storage Industry Revenue billion Forecast, by Technology 2020 & 2033
- Table 6: Global Molten Salt Thermal Energy Storage Industry Revenue billion Forecast, by Country 2020 & 2033
- Table 7: Global Molten Salt Thermal Energy Storage Industry Revenue billion Forecast, by Technology 2020 & 2033
- Table 8: Global Molten Salt Thermal Energy Storage Industry Revenue billion Forecast, by Country 2020 & 2033
- Table 9: Global Molten Salt Thermal Energy Storage Industry Revenue billion Forecast, by Technology 2020 & 2033
- Table 10: Global Molten Salt Thermal Energy Storage Industry Revenue billion Forecast, by Country 2020 & 2033
- Table 11: Global Molten Salt Thermal Energy Storage Industry Revenue billion Forecast, by Technology 2020 & 2033
- Table 12: Global Molten Salt Thermal Energy Storage Industry Revenue billion Forecast, by Country 2020 & 2033
Frequently Asked Questions
1. What is the projected Compound Annual Growth Rate (CAGR) of the Molten Salt Thermal Energy Storage Industry?
The projected CAGR is approximately 9.8%.
2. Which companies are prominent players in the Molten Salt Thermal Energy Storage Industry?
Key companies in the market include SCHOTT AG, SolarReserve LLC, Engie SA, SENER Grupo de Ingenieria S A, Acciona S A, Abengoa SA, Yara International ASA, BrightSource Energy Inc.
3. What are the main segments of the Molten Salt Thermal Energy Storage Industry?
The market segments include Technology.
4. Can you provide details about the market size?
The market size is estimated to be USD 2.22 billion as of 2022.
5. What are some drivers contributing to market growth?
4.; Increasing Investments in Offshore Wind Power Projects4.; Supportive Government Policies.
6. What are the notable trends driving market growth?
Parabolic Trough Segment to Dominate the Market.
7. Are there any restraints impacting market growth?
4.; Increasing Adopting of Alternative Clean Energy Sources (Ex: Solar. Hydro).
8. Can you provide examples of recent developments in the market?
November 2022: Hyme Energy ApS announced that the company is partnering with Bornholms Energi & Forsyning (BEOF) to build its first molten salt thermal energy storage demonstrator on the Danish island of Bornholm. The storage facility is scheduled for completion in 2024 and will have a capacity of 1 MW/20 MWh. It will provide heat, power, and ancillary services to the local network.
9. What pricing options are available for accessing the report?
Pricing options include single-user, multi-user, and enterprise licenses priced at USD 4750, USD 5250, and USD 8750 respectively.
10. Is the market size provided in terms of value or volume?
The market size is provided in terms of value, measured in billion.
11. Are there any specific market keywords associated with the report?
Yes, the market keyword associated with the report is "Molten Salt Thermal Energy Storage Industry," which aids in identifying and referencing the specific market segment covered.
12. How do I determine which pricing option suits my needs best?
The pricing options vary based on user requirements and access needs. Individual users may opt for single-user licenses, while businesses requiring broader access may choose multi-user or enterprise licenses for cost-effective access to the report.
13. Are there any additional resources or data provided in the Molten Salt Thermal Energy Storage Industry report?
While the report offers comprehensive insights, it's advisable to review the specific contents or supplementary materials provided to ascertain if additional resources or data are available.
14. How can I stay updated on further developments or reports in the Molten Salt Thermal Energy Storage Industry?
To stay informed about further developments, trends, and reports in the Molten Salt Thermal Energy Storage Industry, consider subscribing to industry newsletters, following relevant companies and organizations, or regularly checking reputable industry news sources and publications.
Methodology
Step 1 - Identification of Relevant Samples Size from Population Database


Step 2 - Approaches for Defining Global Market Size (Value, Volume* & Price*)

Note*: In applicable scenarios
Step 3 - Data Sources
Primary Research
- Web Analytics
- Survey Reports
- Research Institute
- Latest Research Reports
- Opinion Leaders
Secondary Research
- Annual Reports
- White Paper
- Latest Press Release
- Industry Association
- Paid Database
- Investor Presentations

Step 4 - Data Triangulation
Involves using different sources of information in order to increase the validity of a study
These sources are likely to be stakeholders in a program - participants, other researchers, program staff, other community members, and so on.
Then we put all data in single framework & apply various statistical tools to find out the dynamic on the market.
During the analysis stage, feedback from the stakeholder groups would be compared to determine areas of agreement as well as areas of divergence