

Key Insights
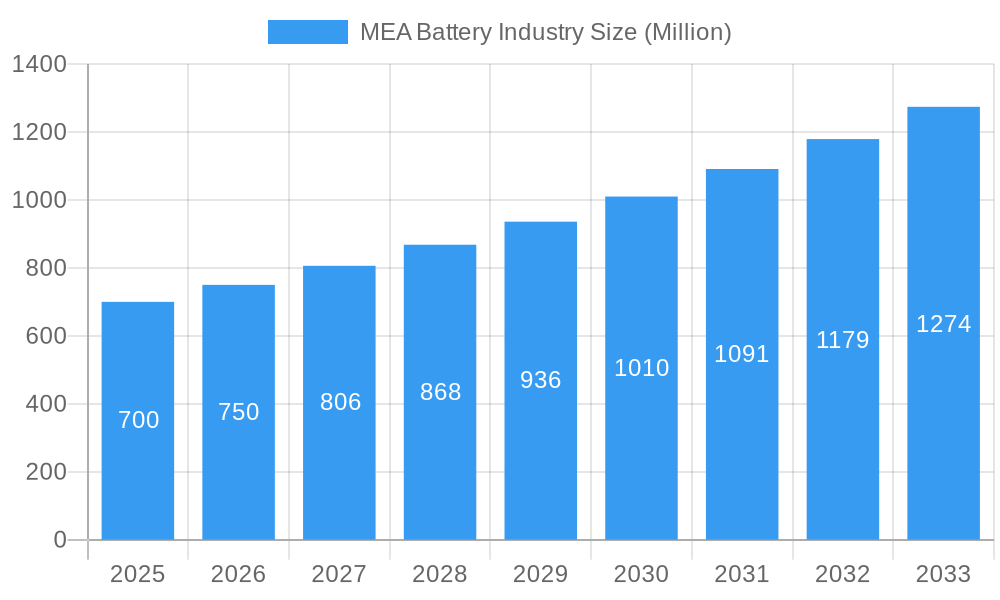
The Middle East and Africa (MEA) battery market, valued at approximately $700 million in 2025, is poised for robust growth, exhibiting a Compound Annual Growth Rate (CAGR) exceeding 7% through 2033. This expansion is fueled by several key factors. The burgeoning automotive sector, particularly the increasing adoption of electric vehicles (EVs) and hybrid electric vehicles (HEVs) across the region, significantly drives demand for advanced battery technologies like lithium-ion. Furthermore, the rising need for reliable energy storage solutions in the telecommunications and renewable energy sectors (solar and wind power integration) contributes to the market's growth. Increased industrialization and the expanding consumer electronics market further fuel demand for various battery types, including lead-acid batteries for backup power and lithium-ion batteries for portable devices. Growth is unevenly distributed across the MEA region, with countries like the United Arab Emirates and Saudi Arabia leading the charge due to significant investments in infrastructure development and renewable energy projects. However, challenges remain, including the high initial cost of advanced battery technologies, a dependence on imports for raw materials, and the need for improved battery recycling infrastructure to promote sustainability.
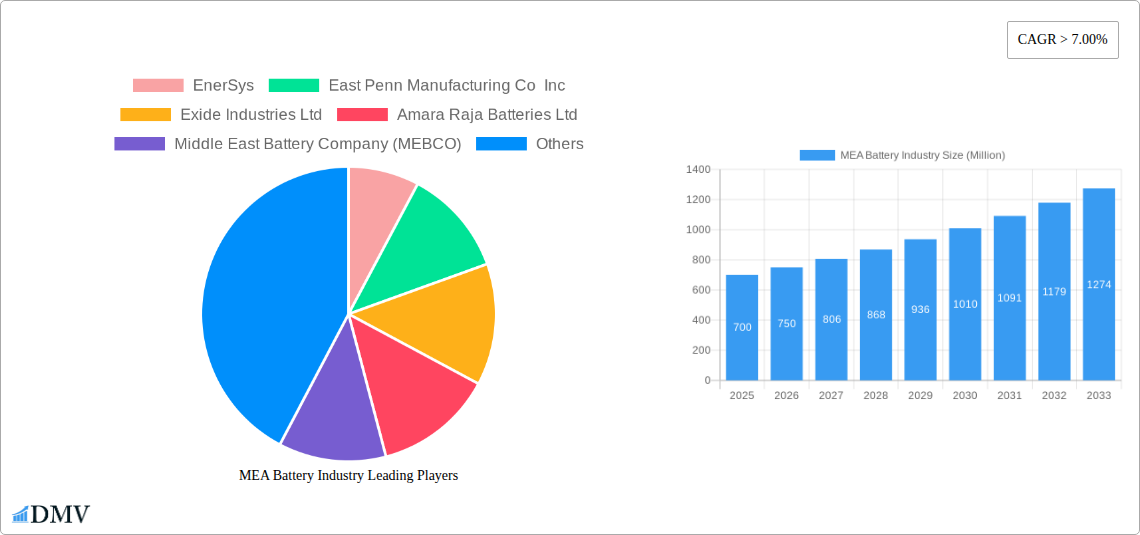
MEA Battery Industry Market Size (In Million)
The MEA battery market segmentation reveals a diverse landscape. While lead-acid batteries currently dominate the market due to their cost-effectiveness, the increasing adoption of EVs and energy storage systems is driving substantial growth for lithium-ion batteries. The industrial sector, encompassing applications such as telecom UPS and energy storage systems (ESS), represents a considerable market segment, while portable batteries for consumer electronics contribute a significant portion of the overall demand. Key players in the MEA battery market include both international giants and regional manufacturers. These companies are actively investing in research and development to improve battery performance, lifespan, and safety, while simultaneously focusing on localized manufacturing to reduce reliance on imports and enhance supply chain resilience. The market's future trajectory is strongly linked to government policies supporting renewable energy adoption, electric vehicle penetration, and advancements in battery technology, creating opportunities for significant market expansion in the coming years.
MEA Battery Industry Company Market Share
MEA Battery Industry: A Comprehensive Market Analysis (2019-2033)
This insightful report provides a comprehensive analysis of the Middle East and Africa (MEA) battery industry, offering a detailed overview of market trends, competitive landscape, and future growth prospects. With a study period spanning 2019-2033, a base year of 2025, and a forecast period of 2025-2033, this report is an essential resource for stakeholders seeking to understand and capitalize on opportunities within this dynamic sector. The report includes in-depth analysis of key market segments, leading players, and significant industry developments, offering valuable insights for strategic decision-making. The MEA battery market is projected to reach xx Million by 2033.
MEA Battery Industry Market Composition & Trends
This section delves into the MEA battery market's intricate structure, analyzing market concentration, innovation drivers, regulatory frameworks, substitute products, end-user profiles, and mergers and acquisitions (M&A) activities. The market exhibits a moderately concentrated structure, with key players like EnerSys, East Penn Manufacturing Co Inc, Exide Industries Ltd, Amara Raja Batteries Ltd, Middle East Battery Company (MEBCO), C&D Technologies Inc, First National Battery Pty Ltd, SAFT GROUPE SA, and Panasonic Corporation holding significant market share. The combined market share of the top five players is estimated at xx%.
- Market Share Distribution (2024): EnerSys (xx%), East Penn Manufacturing Co Inc (xx%), Exide Industries Ltd (xx%), Amara Raja Batteries Ltd (xx%), MEBCO (xx%), Others (xx%).
- Innovation Catalysts: Growing demand for electric vehicles (EVs), renewable energy storage solutions, and portable electronics are driving innovation in battery technologies.
- Regulatory Landscape: Government initiatives promoting renewable energy and EV adoption are shaping the market dynamics.
- Substitute Products: Alternative energy storage technologies, such as fuel cells and flywheels, present competitive pressures.
- End-User Profiles: Key end-users include automotive, industrial, and consumer electronics sectors.
- M&A Activities: The past five years have witnessed xx M&A deals, with a total transaction value of approximately xx Million, indicating ongoing consolidation within the industry. Examples include (specific examples to be inserted with deal values).
MEA Battery Industry Industry Evolution
This section analyzes the MEA battery market's evolutionary trajectory, encompassing market growth trajectories, technological advancements, and evolving consumer preferences. The market experienced significant growth during the historical period (2019-2024), with a Compound Annual Growth Rate (CAGR) of xx%. This growth is anticipated to continue during the forecast period (2025-2033), with a projected CAGR of xx%, driven by increasing demand for electric vehicles and renewable energy storage systems. The shift towards electric mobility is a major catalyst, along with growing awareness of environmental sustainability and the need for reliable power backup solutions. Technological advancements, particularly in lithium-ion battery technology, are improving energy density, lifespan, and safety, leading to wider adoption across various applications. Consumer demand for longer-lasting, higher-performing batteries is pushing innovation further. Furthermore, the increasing focus on grid-scale energy storage is creating new opportunities for large-format battery systems.
Leading Regions, Countries, or Segments in MEA Battery Industry
This section identifies the dominant regions, countries, and segments within the MEA battery market. The market is geographically diverse, with significant growth observed across various countries, each driven by unique factors.
Dominant Segments:
- Type: Secondary batteries dominate the market due to their rechargeable nature and suitability for various applications.
- Technology: Lead-acid batteries currently hold a significant market share due to their cost-effectiveness, but lithium-ion batteries are experiencing rapid growth, driven by their superior performance characteristics.
- Application: Automotive batteries, especially for EVs, are the fastest-growing segment. Industrial batteries (especially for telecom UPS and ESS) are also exhibiting strong growth.
Key Drivers (by region/country - examples to be included):
- Investment Trends: Government incentives and private sector investment are fueling growth in certain regions.
- Regulatory Support: Supportive government policies promoting renewable energy and EV adoption are boosting market expansion.
Factors driving dominance (detailed analysis to be included):
MEA Battery Industry Product Innovations
Recent product innovations focus on enhancing battery performance, safety, and lifespan. Advances in lithium-ion battery technology, such as solid-state batteries and improved cathode materials, are improving energy density and reducing charging times. Innovations in battery management systems (BMS) are enhancing safety and extending battery lifespan. These advancements are reflected in the introduction of higher-capacity batteries with improved performance metrics, including increased energy density, faster charging rates, and extended cycle life. Unique selling propositions (USPs) often include features such as improved thermal management, enhanced safety features, and longer warranties.
Propelling Factors for MEA Battery Industry Growth
Several factors are driving the growth of the MEA battery industry. Technological advancements in battery technologies, particularly lithium-ion batteries, are leading to improved performance and reduced costs. Economic factors, such as rising demand for electric vehicles and renewable energy storage, are creating a large and expanding market for batteries. Favorable government regulations and policies, including subsidies and tax incentives for electric vehicles and renewable energy projects, are further stimulating market growth. For example, the increasing adoption of renewable energy sources like solar and wind power is leading to a greater need for energy storage solutions, boosting the demand for batteries.
Obstacles in the MEA Battery Industry Market
The MEA battery industry faces several challenges. Regulatory hurdles, such as complex permitting processes and inconsistent standards, can hinder market expansion. Supply chain disruptions, including material shortages and geopolitical uncertainties, can affect battery production and availability. Intense competition among battery manufacturers creates pricing pressures and necessitates continuous innovation. These factors can collectively lead to increased costs and potential delays in project timelines, impacting overall market growth. Specific quantifiable examples of the impacts of these challenges are needed.
Future Opportunities in MEA Battery Industry
The MEA battery market presents numerous future opportunities. The growth of electric vehicles and renewable energy storage is expected to fuel significant demand for batteries in the coming years. New markets, particularly in emerging economies within the MEA region, offer considerable potential for expansion. Emerging battery technologies, such as solid-state batteries, hold promise for further performance improvements and cost reductions. Furthermore, new consumer trends, such as increasing demand for portable electronic devices, present further growth opportunities.
Major Players in the MEA Battery Industry Ecosystem
- EnerSys
- East Penn Manufacturing Co Inc
- Exide Industries Ltd
- Amara Raja Batteries Ltd
- Middle East Battery Company (MEBCO)
- C&D Technologies Inc
- First National Battery Pty Ltd
- SAFT GROUPE SA
- Panasonic Corporation
Key Developments in MEA Battery Industry Industry
- August 2023: Mahindra & Mahindra's launch of the electric Thar SUV and seven new electric tractor models in South Africa signals increased investment in electric mobility in the region, boosting demand for automotive batteries.
- June 2023: Saudi Arabia's USD 5.6 billion deal with Human Horizons signifies a major push towards electric vehicle manufacturing in the MEA region, creating substantial opportunities for battery manufacturers.
Strategic MEA Battery Industry Market Forecast
The MEA battery market is poised for substantial growth driven by increasing demand for electric vehicles, renewable energy storage systems, and portable electronic devices. Technological advancements in battery technologies will further enhance performance and reduce costs, making batteries more accessible and affordable. Government policies promoting renewable energy and electric mobility will create a favorable environment for market expansion. The market is expected to witness considerable expansion across various segments, propelled by the factors outlined above.
MEA Battery Industry Segmentation
-
1. Type
- 1.1. Primary Battery
- 1.2. Secondary Battery
-
2. Technology
- 2.1. Lead-acid Battery
- 2.2. Lithium-ion Battery
- 2.3. Nickel-metal Hydride (NiMH) Battery
- 2.4. Other Te
-
3. Application
- 3.1. Automotive Batteries
- 3.2. Industri
- 3.3. Portable Batteries (Consumer Electronics, etc.)
- 3.4. Other Applications
-
4. Geography
- 4.1. Saudi Arabia
- 4.2. United Arab Emirates
- 4.3. South Africa
- 4.4. Rest of Middle-East and Africa
MEA Battery Industry Segmentation By Geography
- 1. Saudi Arabia
- 2. United Arab Emirates
- 3. South Africa
- 4. Rest of Middle East and Africa
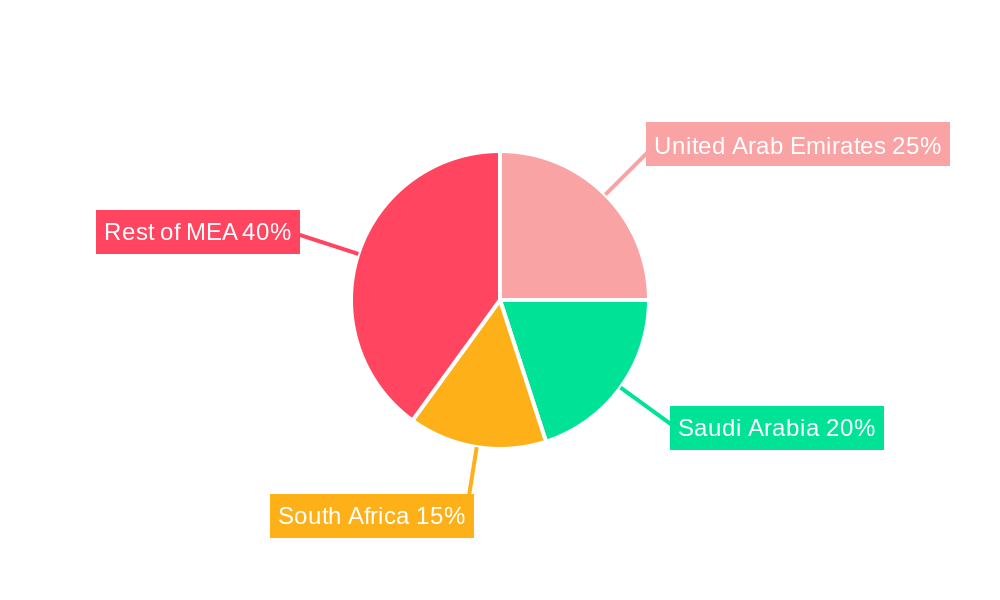
MEA Battery Industry Regional Market Share
Geographic Coverage of MEA Battery Industry
MEA Battery Industry REPORT HIGHLIGHTS
| Aspects | Details |
|---|---|
| Study Period | 2020-2034 |
| Base Year | 2025 |
| Estimated Year | 2026 |
| Forecast Period | 2026-2034 |
| Historical Period | 2020-2025 |
| Growth Rate | CAGR of > 7.00% from 2020-2034 |
| Segmentation |
|
Table of Contents
- 1. Introduction
- 1.1. Research Scope
- 1.2. Market Segmentation
- 1.3. Research Objective
- 1.4. Definitions and Assumptions
- 2. Executive Summary
- 2.1. Market Snapshot
- 3. Market Dynamics
- 3.1. Market Drivers
- 3.2. Market Restrains
- 3.3. Market Trends
- 3.4. Market Opportunities
- 4. Market Factor Analysis
- 4.1. Porters Five Forces
- 4.1.1. Bargaining Power of Suppliers
- 4.1.2. Bargaining Power of Buyers
- 4.1.3. Threat of New Entrants
- 4.1.4. Threat of Substitutes
- 4.1.5. Competitive Rivalry
- 4.2. PESTEL analysis
- 4.3. BCG Analysis
- 4.3.1. Stars (High Growth, High Market Share)
- 4.3.2. Cash Cows (Low Growth, High Market Share)
- 4.3.3. Question Mark (High Growth, Low Market Share)
- 4.3.4. Dogs (Low Growth, Low Market Share)
- 4.4. Ansoff Matrix Analysis
- 4.5. Supply Chain Analysis
- 4.6. Regulatory Landscape
- 4.7. Current Market Potential and Opportunity Assessment (TAM–SAM–SOM Framework)
- 4.8. DMV Analyst Note
- 4.1. Porters Five Forces
- 5. Market Analysis, Insights and Forecast 2021-2033
- 5.1. Market Analysis, Insights and Forecast - by Type
- 5.1.1. Primary Battery
- 5.1.2. Secondary Battery
- 5.2. Market Analysis, Insights and Forecast - by Technology
- 5.2.1. Lead-acid Battery
- 5.2.2. Lithium-ion Battery
- 5.2.3. Nickel-metal Hydride (NiMH) Battery
- 5.2.4. Other Te
- 5.3. Market Analysis, Insights and Forecast - by Application
- 5.3.1. Automotive Batteries
- 5.3.2. Industri
- 5.3.3. Portable Batteries (Consumer Electronics, etc.)
- 5.3.4. Other Applications
- 5.4. Market Analysis, Insights and Forecast - by Geography
- 5.4.1. Saudi Arabia
- 5.4.2. United Arab Emirates
- 5.4.3. South Africa
- 5.4.4. Rest of Middle-East and Africa
- 5.5. Market Analysis, Insights and Forecast - by Region
- 5.5.1. Saudi Arabia
- 5.5.2. United Arab Emirates
- 5.5.3. South Africa
- 5.5.4. Rest of Middle East and Africa
- 5.1. Market Analysis, Insights and Forecast - by Type
- 6. Global MEA Battery Industry Analysis, Insights and Forecast, 2021-2033
- 6.1. Market Analysis, Insights and Forecast - by Type
- 6.1.1. Primary Battery
- 6.1.2. Secondary Battery
- 6.2. Market Analysis, Insights and Forecast - by Technology
- 6.2.1. Lead-acid Battery
- 6.2.2. Lithium-ion Battery
- 6.2.3. Nickel-metal Hydride (NiMH) Battery
- 6.2.4. Other Te
- 6.3. Market Analysis, Insights and Forecast - by Application
- 6.3.1. Automotive Batteries
- 6.3.2. Industri
- 6.3.3. Portable Batteries (Consumer Electronics, etc.)
- 6.3.4. Other Applications
- 6.4. Market Analysis, Insights and Forecast - by Geography
- 6.4.1. Saudi Arabia
- 6.4.2. United Arab Emirates
- 6.4.3. South Africa
- 6.4.4. Rest of Middle-East and Africa
- 6.1. Market Analysis, Insights and Forecast - by Type
- 7. Saudi Arabia MEA Battery Industry Analysis, Insights and Forecast, 2020-2032
- 7.1. Market Analysis, Insights and Forecast - by Type
- 7.1.1. Primary Battery
- 7.1.2. Secondary Battery
- 7.2. Market Analysis, Insights and Forecast - by Technology
- 7.2.1. Lead-acid Battery
- 7.2.2. Lithium-ion Battery
- 7.2.3. Nickel-metal Hydride (NiMH) Battery
- 7.2.4. Other Te
- 7.3. Market Analysis, Insights and Forecast - by Application
- 7.3.1. Automotive Batteries
- 7.3.2. Industri
- 7.3.3. Portable Batteries (Consumer Electronics, etc.)
- 7.3.4. Other Applications
- 7.4. Market Analysis, Insights and Forecast - by Geography
- 7.4.1. Saudi Arabia
- 7.4.2. United Arab Emirates
- 7.4.3. South Africa
- 7.4.4. Rest of Middle-East and Africa
- 7.1. Market Analysis, Insights and Forecast - by Type
- 8. United Arab Emirates MEA Battery Industry Analysis, Insights and Forecast, 2020-2032
- 8.1. Market Analysis, Insights and Forecast - by Type
- 8.1.1. Primary Battery
- 8.1.2. Secondary Battery
- 8.2. Market Analysis, Insights and Forecast - by Technology
- 8.2.1. Lead-acid Battery
- 8.2.2. Lithium-ion Battery
- 8.2.3. Nickel-metal Hydride (NiMH) Battery
- 8.2.4. Other Te
- 8.3. Market Analysis, Insights and Forecast - by Application
- 8.3.1. Automotive Batteries
- 8.3.2. Industri
- 8.3.3. Portable Batteries (Consumer Electronics, etc.)
- 8.3.4. Other Applications
- 8.4. Market Analysis, Insights and Forecast - by Geography
- 8.4.1. Saudi Arabia
- 8.4.2. United Arab Emirates
- 8.4.3. South Africa
- 8.4.4. Rest of Middle-East and Africa
- 8.1. Market Analysis, Insights and Forecast - by Type
- 9. South Africa MEA Battery Industry Analysis, Insights and Forecast, 2020-2032
- 9.1. Market Analysis, Insights and Forecast - by Type
- 9.1.1. Primary Battery
- 9.1.2. Secondary Battery
- 9.2. Market Analysis, Insights and Forecast - by Technology
- 9.2.1. Lead-acid Battery
- 9.2.2. Lithium-ion Battery
- 9.2.3. Nickel-metal Hydride (NiMH) Battery
- 9.2.4. Other Te
- 9.3. Market Analysis, Insights and Forecast - by Application
- 9.3.1. Automotive Batteries
- 9.3.2. Industri
- 9.3.3. Portable Batteries (Consumer Electronics, etc.)
- 9.3.4. Other Applications
- 9.4. Market Analysis, Insights and Forecast - by Geography
- 9.4.1. Saudi Arabia
- 9.4.2. United Arab Emirates
- 9.4.3. South Africa
- 9.4.4. Rest of Middle-East and Africa
- 9.1. Market Analysis, Insights and Forecast - by Type
- 10. Rest of Middle East and Africa MEA Battery Industry Analysis, Insights and Forecast, 2020-2032
- 10.1. Market Analysis, Insights and Forecast - by Type
- 10.1.1. Primary Battery
- 10.1.2. Secondary Battery
- 10.2. Market Analysis, Insights and Forecast - by Technology
- 10.2.1. Lead-acid Battery
- 10.2.2. Lithium-ion Battery
- 10.2.3. Nickel-metal Hydride (NiMH) Battery
- 10.2.4. Other Te
- 10.3. Market Analysis, Insights and Forecast - by Application
- 10.3.1. Automotive Batteries
- 10.3.2. Industri
- 10.3.3. Portable Batteries (Consumer Electronics, etc.)
- 10.3.4. Other Applications
- 10.4. Market Analysis, Insights and Forecast - by Geography
- 10.4.1. Saudi Arabia
- 10.4.2. United Arab Emirates
- 10.4.3. South Africa
- 10.4.4. Rest of Middle-East and Africa
- 10.1. Market Analysis, Insights and Forecast - by Type
- 11. Competitive Analysis
- 11.1. Company Profiles
- 11.1.1 EnerSys
- 11.1.1.1. Company Overview
- 11.1.1.2. Products
- 11.1.1.3. Company Financials
- 11.1.1.4. SWOT Analysis
- 11.1.2 East Penn Manufacturing Co Inc
- 11.1.2.1. Company Overview
- 11.1.2.2. Products
- 11.1.2.3. Company Financials
- 11.1.2.4. SWOT Analysis
- 11.1.3 Exide Industries Ltd
- 11.1.3.1. Company Overview
- 11.1.3.2. Products
- 11.1.3.3. Company Financials
- 11.1.3.4. SWOT Analysis
- 11.1.4 Amara Raja Batteries Ltd
- 11.1.4.1. Company Overview
- 11.1.4.2. Products
- 11.1.4.3. Company Financials
- 11.1.4.4. SWOT Analysis
- 11.1.5 Middle East Battery Company (MEBCO)
- 11.1.5.1. Company Overview
- 11.1.5.2. Products
- 11.1.5.3. Company Financials
- 11.1.5.4. SWOT Analysis
- 11.1.6 C&D Technologies Inc
- 11.1.6.1. Company Overview
- 11.1.6.2. Products
- 11.1.6.3. Company Financials
- 11.1.6.4. SWOT Analysis
- 11.1.7 First National Battery Pty Ltd
- 11.1.7.1. Company Overview
- 11.1.7.2. Products
- 11.1.7.3. Company Financials
- 11.1.7.4. SWOT Analysis
- 11.1.8 SAFT GROUPE SA
- 11.1.8.1. Company Overview
- 11.1.8.2. Products
- 11.1.8.3. Company Financials
- 11.1.8.4. SWOT Analysis
- 11.1.9 Panasonic Corporation
- 11.1.9.1. Company Overview
- 11.1.9.2. Products
- 11.1.9.3. Company Financials
- 11.1.9.4. SWOT Analysis
- 11.1.1 EnerSys
- 11.2. Market Entropy
- 11.2.1 Company's Key Areas Served
- 11.2.2 Recent Developments
- 11.3. Company Market Share Analysis 2025
- 11.3.1 Top 5 Companies Market Share Analysis
- 11.3.2 Top 3 Companies Market Share Analysis
- 11.4. List of Potential Customers
- 12. Research Methodology
List of Figures
- Figure 1: Global MEA Battery Industry Revenue Breakdown (Million, %) by Region 2025 & 2033
- Figure 2: Global MEA Battery Industry Volume Breakdown (K Unit, %) by Region 2025 & 2033
- Figure 3: Saudi Arabia MEA Battery Industry Revenue (Million), by Type 2025 & 2033
- Figure 4: Saudi Arabia MEA Battery Industry Volume (K Unit), by Type 2025 & 2033
- Figure 5: Saudi Arabia MEA Battery Industry Revenue Share (%), by Type 2025 & 2033
- Figure 6: Saudi Arabia MEA Battery Industry Volume Share (%), by Type 2025 & 2033
- Figure 7: Saudi Arabia MEA Battery Industry Revenue (Million), by Technology 2025 & 2033
- Figure 8: Saudi Arabia MEA Battery Industry Volume (K Unit), by Technology 2025 & 2033
- Figure 9: Saudi Arabia MEA Battery Industry Revenue Share (%), by Technology 2025 & 2033
- Figure 10: Saudi Arabia MEA Battery Industry Volume Share (%), by Technology 2025 & 2033
- Figure 11: Saudi Arabia MEA Battery Industry Revenue (Million), by Application 2025 & 2033
- Figure 12: Saudi Arabia MEA Battery Industry Volume (K Unit), by Application 2025 & 2033
- Figure 13: Saudi Arabia MEA Battery Industry Revenue Share (%), by Application 2025 & 2033
- Figure 14: Saudi Arabia MEA Battery Industry Volume Share (%), by Application 2025 & 2033
- Figure 15: Saudi Arabia MEA Battery Industry Revenue (Million), by Geography 2025 & 2033
- Figure 16: Saudi Arabia MEA Battery Industry Volume (K Unit), by Geography 2025 & 2033
- Figure 17: Saudi Arabia MEA Battery Industry Revenue Share (%), by Geography 2025 & 2033
- Figure 18: Saudi Arabia MEA Battery Industry Volume Share (%), by Geography 2025 & 2033
- Figure 19: Saudi Arabia MEA Battery Industry Revenue (Million), by Country 2025 & 2033
- Figure 20: Saudi Arabia MEA Battery Industry Volume (K Unit), by Country 2025 & 2033
- Figure 21: Saudi Arabia MEA Battery Industry Revenue Share (%), by Country 2025 & 2033
- Figure 22: Saudi Arabia MEA Battery Industry Volume Share (%), by Country 2025 & 2033
- Figure 23: United Arab Emirates MEA Battery Industry Revenue (Million), by Type 2025 & 2033
- Figure 24: United Arab Emirates MEA Battery Industry Volume (K Unit), by Type 2025 & 2033
- Figure 25: United Arab Emirates MEA Battery Industry Revenue Share (%), by Type 2025 & 2033
- Figure 26: United Arab Emirates MEA Battery Industry Volume Share (%), by Type 2025 & 2033
- Figure 27: United Arab Emirates MEA Battery Industry Revenue (Million), by Technology 2025 & 2033
- Figure 28: United Arab Emirates MEA Battery Industry Volume (K Unit), by Technology 2025 & 2033
- Figure 29: United Arab Emirates MEA Battery Industry Revenue Share (%), by Technology 2025 & 2033
- Figure 30: United Arab Emirates MEA Battery Industry Volume Share (%), by Technology 2025 & 2033
- Figure 31: United Arab Emirates MEA Battery Industry Revenue (Million), by Application 2025 & 2033
- Figure 32: United Arab Emirates MEA Battery Industry Volume (K Unit), by Application 2025 & 2033
- Figure 33: United Arab Emirates MEA Battery Industry Revenue Share (%), by Application 2025 & 2033
- Figure 34: United Arab Emirates MEA Battery Industry Volume Share (%), by Application 2025 & 2033
- Figure 35: United Arab Emirates MEA Battery Industry Revenue (Million), by Geography 2025 & 2033
- Figure 36: United Arab Emirates MEA Battery Industry Volume (K Unit), by Geography 2025 & 2033
- Figure 37: United Arab Emirates MEA Battery Industry Revenue Share (%), by Geography 2025 & 2033
- Figure 38: United Arab Emirates MEA Battery Industry Volume Share (%), by Geography 2025 & 2033
- Figure 39: United Arab Emirates MEA Battery Industry Revenue (Million), by Country 2025 & 2033
- Figure 40: United Arab Emirates MEA Battery Industry Volume (K Unit), by Country 2025 & 2033
- Figure 41: United Arab Emirates MEA Battery Industry Revenue Share (%), by Country 2025 & 2033
- Figure 42: United Arab Emirates MEA Battery Industry Volume Share (%), by Country 2025 & 2033
- Figure 43: South Africa MEA Battery Industry Revenue (Million), by Type 2025 & 2033
- Figure 44: South Africa MEA Battery Industry Volume (K Unit), by Type 2025 & 2033
- Figure 45: South Africa MEA Battery Industry Revenue Share (%), by Type 2025 & 2033
- Figure 46: South Africa MEA Battery Industry Volume Share (%), by Type 2025 & 2033
- Figure 47: South Africa MEA Battery Industry Revenue (Million), by Technology 2025 & 2033
- Figure 48: South Africa MEA Battery Industry Volume (K Unit), by Technology 2025 & 2033
- Figure 49: South Africa MEA Battery Industry Revenue Share (%), by Technology 2025 & 2033
- Figure 50: South Africa MEA Battery Industry Volume Share (%), by Technology 2025 & 2033
- Figure 51: South Africa MEA Battery Industry Revenue (Million), by Application 2025 & 2033
- Figure 52: South Africa MEA Battery Industry Volume (K Unit), by Application 2025 & 2033
- Figure 53: South Africa MEA Battery Industry Revenue Share (%), by Application 2025 & 2033
- Figure 54: South Africa MEA Battery Industry Volume Share (%), by Application 2025 & 2033
- Figure 55: South Africa MEA Battery Industry Revenue (Million), by Geography 2025 & 2033
- Figure 56: South Africa MEA Battery Industry Volume (K Unit), by Geography 2025 & 2033
- Figure 57: South Africa MEA Battery Industry Revenue Share (%), by Geography 2025 & 2033
- Figure 58: South Africa MEA Battery Industry Volume Share (%), by Geography 2025 & 2033
- Figure 59: South Africa MEA Battery Industry Revenue (Million), by Country 2025 & 2033
- Figure 60: South Africa MEA Battery Industry Volume (K Unit), by Country 2025 & 2033
- Figure 61: South Africa MEA Battery Industry Revenue Share (%), by Country 2025 & 2033
- Figure 62: South Africa MEA Battery Industry Volume Share (%), by Country 2025 & 2033
- Figure 63: Rest of Middle East and Africa MEA Battery Industry Revenue (Million), by Type 2025 & 2033
- Figure 64: Rest of Middle East and Africa MEA Battery Industry Volume (K Unit), by Type 2025 & 2033
- Figure 65: Rest of Middle East and Africa MEA Battery Industry Revenue Share (%), by Type 2025 & 2033
- Figure 66: Rest of Middle East and Africa MEA Battery Industry Volume Share (%), by Type 2025 & 2033
- Figure 67: Rest of Middle East and Africa MEA Battery Industry Revenue (Million), by Technology 2025 & 2033
- Figure 68: Rest of Middle East and Africa MEA Battery Industry Volume (K Unit), by Technology 2025 & 2033
- Figure 69: Rest of Middle East and Africa MEA Battery Industry Revenue Share (%), by Technology 2025 & 2033
- Figure 70: Rest of Middle East and Africa MEA Battery Industry Volume Share (%), by Technology 2025 & 2033
- Figure 71: Rest of Middle East and Africa MEA Battery Industry Revenue (Million), by Application 2025 & 2033
- Figure 72: Rest of Middle East and Africa MEA Battery Industry Volume (K Unit), by Application 2025 & 2033
- Figure 73: Rest of Middle East and Africa MEA Battery Industry Revenue Share (%), by Application 2025 & 2033
- Figure 74: Rest of Middle East and Africa MEA Battery Industry Volume Share (%), by Application 2025 & 2033
- Figure 75: Rest of Middle East and Africa MEA Battery Industry Revenue (Million), by Geography 2025 & 2033
- Figure 76: Rest of Middle East and Africa MEA Battery Industry Volume (K Unit), by Geography 2025 & 2033
- Figure 77: Rest of Middle East and Africa MEA Battery Industry Revenue Share (%), by Geography 2025 & 2033
- Figure 78: Rest of Middle East and Africa MEA Battery Industry Volume Share (%), by Geography 2025 & 2033
- Figure 79: Rest of Middle East and Africa MEA Battery Industry Revenue (Million), by Country 2025 & 2033
- Figure 80: Rest of Middle East and Africa MEA Battery Industry Volume (K Unit), by Country 2025 & 2033
- Figure 81: Rest of Middle East and Africa MEA Battery Industry Revenue Share (%), by Country 2025 & 2033
- Figure 82: Rest of Middle East and Africa MEA Battery Industry Volume Share (%), by Country 2025 & 2033
List of Tables
- Table 1: Global MEA Battery Industry Revenue Million Forecast, by Type 2020 & 2033
- Table 2: Global MEA Battery Industry Volume K Unit Forecast, by Type 2020 & 2033
- Table 3: Global MEA Battery Industry Revenue Million Forecast, by Technology 2020 & 2033
- Table 4: Global MEA Battery Industry Volume K Unit Forecast, by Technology 2020 & 2033
- Table 5: Global MEA Battery Industry Revenue Million Forecast, by Application 2020 & 2033
- Table 6: Global MEA Battery Industry Volume K Unit Forecast, by Application 2020 & 2033
- Table 7: Global MEA Battery Industry Revenue Million Forecast, by Geography 2020 & 2033
- Table 8: Global MEA Battery Industry Volume K Unit Forecast, by Geography 2020 & 2033
- Table 9: Global MEA Battery Industry Revenue Million Forecast, by Region 2020 & 2033
- Table 10: Global MEA Battery Industry Volume K Unit Forecast, by Region 2020 & 2033
- Table 11: Global MEA Battery Industry Revenue Million Forecast, by Type 2020 & 2033
- Table 12: Global MEA Battery Industry Volume K Unit Forecast, by Type 2020 & 2033
- Table 13: Global MEA Battery Industry Revenue Million Forecast, by Technology 2020 & 2033
- Table 14: Global MEA Battery Industry Volume K Unit Forecast, by Technology 2020 & 2033
- Table 15: Global MEA Battery Industry Revenue Million Forecast, by Application 2020 & 2033
- Table 16: Global MEA Battery Industry Volume K Unit Forecast, by Application 2020 & 2033
- Table 17: Global MEA Battery Industry Revenue Million Forecast, by Geography 2020 & 2033
- Table 18: Global MEA Battery Industry Volume K Unit Forecast, by Geography 2020 & 2033
- Table 19: Global MEA Battery Industry Revenue Million Forecast, by Country 2020 & 2033
- Table 20: Global MEA Battery Industry Volume K Unit Forecast, by Country 2020 & 2033
- Table 21: Global MEA Battery Industry Revenue Million Forecast, by Type 2020 & 2033
- Table 22: Global MEA Battery Industry Volume K Unit Forecast, by Type 2020 & 2033
- Table 23: Global MEA Battery Industry Revenue Million Forecast, by Technology 2020 & 2033
- Table 24: Global MEA Battery Industry Volume K Unit Forecast, by Technology 2020 & 2033
- Table 25: Global MEA Battery Industry Revenue Million Forecast, by Application 2020 & 2033
- Table 26: Global MEA Battery Industry Volume K Unit Forecast, by Application 2020 & 2033
- Table 27: Global MEA Battery Industry Revenue Million Forecast, by Geography 2020 & 2033
- Table 28: Global MEA Battery Industry Volume K Unit Forecast, by Geography 2020 & 2033
- Table 29: Global MEA Battery Industry Revenue Million Forecast, by Country 2020 & 2033
- Table 30: Global MEA Battery Industry Volume K Unit Forecast, by Country 2020 & 2033
- Table 31: Global MEA Battery Industry Revenue Million Forecast, by Type 2020 & 2033
- Table 32: Global MEA Battery Industry Volume K Unit Forecast, by Type 2020 & 2033
- Table 33: Global MEA Battery Industry Revenue Million Forecast, by Technology 2020 & 2033
- Table 34: Global MEA Battery Industry Volume K Unit Forecast, by Technology 2020 & 2033
- Table 35: Global MEA Battery Industry Revenue Million Forecast, by Application 2020 & 2033
- Table 36: Global MEA Battery Industry Volume K Unit Forecast, by Application 2020 & 2033
- Table 37: Global MEA Battery Industry Revenue Million Forecast, by Geography 2020 & 2033
- Table 38: Global MEA Battery Industry Volume K Unit Forecast, by Geography 2020 & 2033
- Table 39: Global MEA Battery Industry Revenue Million Forecast, by Country 2020 & 2033
- Table 40: Global MEA Battery Industry Volume K Unit Forecast, by Country 2020 & 2033
- Table 41: Global MEA Battery Industry Revenue Million Forecast, by Type 2020 & 2033
- Table 42: Global MEA Battery Industry Volume K Unit Forecast, by Type 2020 & 2033
- Table 43: Global MEA Battery Industry Revenue Million Forecast, by Technology 2020 & 2033
- Table 44: Global MEA Battery Industry Volume K Unit Forecast, by Technology 2020 & 2033
- Table 45: Global MEA Battery Industry Revenue Million Forecast, by Application 2020 & 2033
- Table 46: Global MEA Battery Industry Volume K Unit Forecast, by Application 2020 & 2033
- Table 47: Global MEA Battery Industry Revenue Million Forecast, by Geography 2020 & 2033
- Table 48: Global MEA Battery Industry Volume K Unit Forecast, by Geography 2020 & 2033
- Table 49: Global MEA Battery Industry Revenue Million Forecast, by Country 2020 & 2033
- Table 50: Global MEA Battery Industry Volume K Unit Forecast, by Country 2020 & 2033
Frequently Asked Questions
1. What is the projected Compound Annual Growth Rate (CAGR) of the MEA Battery Industry?
The projected CAGR is approximately > 7.00%.
2. Which companies are prominent players in the MEA Battery Industry?
Key companies in the market include EnerSys, East Penn Manufacturing Co Inc, Exide Industries Ltd, Amara Raja Batteries Ltd, Middle East Battery Company (MEBCO), C&D Technologies Inc, First National Battery Pty Ltd, SAFT GROUPE SA, Panasonic Corporation.
3. What are the main segments of the MEA Battery Industry?
The market segments include Type, Technology, Application, Geography.
4. Can you provide details about the market size?
The market size is estimated to be USD 7.06 Million as of 2022.
5. What are some drivers contributing to market growth?
4.; Declining lithium-ion battery prices4.; Increasing adoption of electric vehicles.
6. What are the notable trends driving market growth?
Automotive Batteries Segment to Witness Significant Growth.
7. Are there any restraints impacting market growth?
4.; Demand-supply mismatch of raw materials.
8. Can you provide examples of recent developments in the market?
Aug 2023: Mahindra & Mahindra, India's fourth largest car manufacturer, unveiled the electric version of the Thar SUV at an event in South Africa. Apart from the Thar.e, Mahindra also unveiled seven new tractor models at the event in Cape Town, South Africa.
9. What pricing options are available for accessing the report?
Pricing options include single-user, multi-user, and enterprise licenses priced at USD 4750, USD 5250, and USD 8750 respectively.
10. Is the market size provided in terms of value or volume?
The market size is provided in terms of value, measured in Million and volume, measured in K Unit.
11. Are there any specific market keywords associated with the report?
Yes, the market keyword associated with the report is "MEA Battery Industry," which aids in identifying and referencing the specific market segment covered.
12. How do I determine which pricing option suits my needs best?
The pricing options vary based on user requirements and access needs. Individual users may opt for single-user licenses, while businesses requiring broader access may choose multi-user or enterprise licenses for cost-effective access to the report.
13. Are there any additional resources or data provided in the MEA Battery Industry report?
While the report offers comprehensive insights, it's advisable to review the specific contents or supplementary materials provided to ascertain if additional resources or data are available.
14. How can I stay updated on further developments or reports in the MEA Battery Industry?
To stay informed about further developments, trends, and reports in the MEA Battery Industry, consider subscribing to industry newsletters, following relevant companies and organizations, or regularly checking reputable industry news sources and publications.
Methodology
Step 1 - Identification of Relevant Samples Size from Population Database


Step 2 - Approaches for Defining Global Market Size (Value, Volume* & Price*)

Note*: In applicable scenarios
Step 3 - Data Sources
Primary Research
- Web Analytics
- Survey Reports
- Research Institute
- Latest Research Reports
- Opinion Leaders
Secondary Research
- Annual Reports
- White Paper
- Latest Press Release
- Industry Association
- Paid Database
- Investor Presentations

Step 4 - Data Triangulation
Involves using different sources of information in order to increase the validity of a study
These sources are likely to be stakeholders in a program - participants, other researchers, program staff, other community members, and so on.
Then we put all data in single framework & apply various statistical tools to find out the dynamic on the market.
During the analysis stage, feedback from the stakeholder groups would be compared to determine areas of agreement as well as areas of divergence