

Key Insights
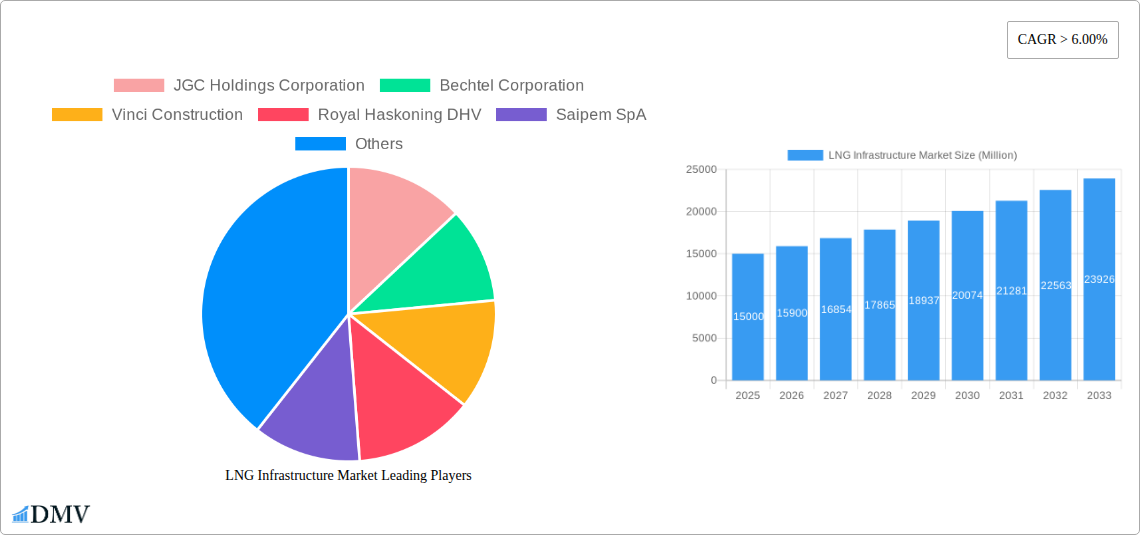
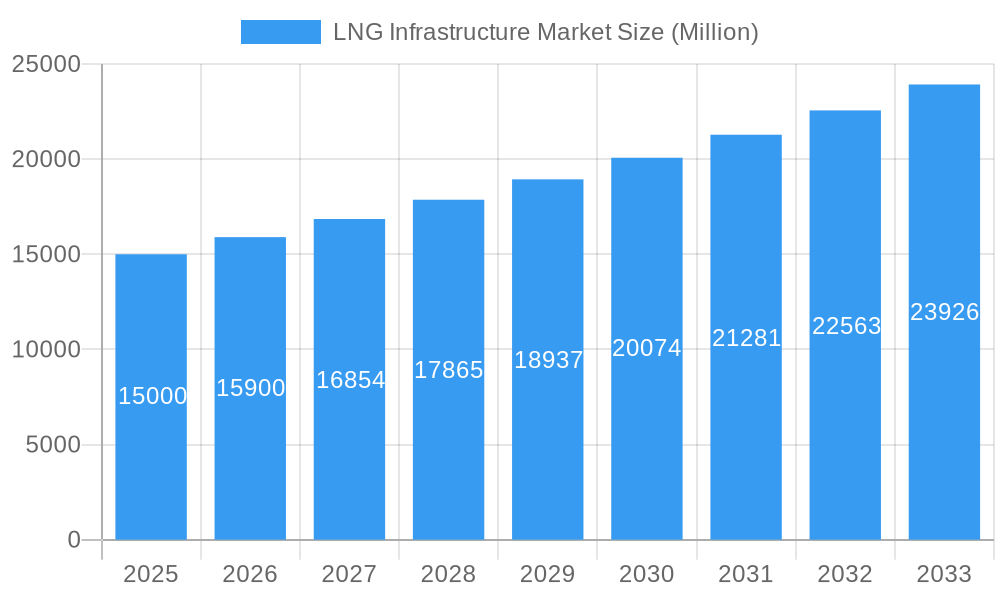
The LNG Infrastructure market, encompassing regasification and liquefaction terminals, is experiencing robust growth, projected to maintain a Compound Annual Growth Rate (CAGR) exceeding 6% from 2025 to 2033. This expansion is fueled by several key factors. The increasing global demand for natural gas, driven by its cleaner-burning nature compared to coal and its role in bridging the energy transition, is a primary driver. Government policies promoting energy security and diversification, coupled with investments in renewable energy sources that often require natural gas for backup power, further stimulate market growth. Technological advancements in liquefaction and regasification technologies, leading to improved efficiency and reduced costs, also contribute significantly. Expansion into new geographic regions, especially in Asia-Pacific and the Middle East, where energy demand is rapidly increasing, presents substantial opportunities for market players.
LNG Infrastructure Market Market Size (In Billion)
However, the market also faces certain challenges. High capital expenditures associated with building and maintaining these large-scale infrastructure projects pose a significant barrier to entry. Geopolitical instability and regulatory uncertainties in certain regions can create project delays and increase risks. Fluctuations in natural gas prices and competition from alternative energy sources present ongoing challenges for market stability. Despite these restraints, the long-term outlook for the LNG Infrastructure market remains positive, with continued growth anticipated across various segments and regions. The major players, including JGC Holdings Corporation, Bechtel Corporation, and others, are well-positioned to capitalize on this growth, focusing on innovation, strategic partnerships, and efficient project execution. The geographic distribution of projects is expected to shift towards regions with rapidly growing energy demands.
LNG Infrastructure Market Company Market Share
LNG Infrastructure Market: A Comprehensive Report (2019-2033)
This insightful report provides a detailed analysis of the LNG Infrastructure Market, encompassing historical data (2019-2024), current estimates (2025), and future projections (2025-2033). The study covers key market segments, leading players, and emerging trends, offering invaluable insights for stakeholders seeking to navigate this dynamic industry. The market is projected to reach xx Million by 2033, presenting significant opportunities for growth and investment.
LNG Infrastructure Market Composition & Trends
This section delves into the intricate structure of the LNG infrastructure market, evaluating its concentration, innovation drivers, regulatory landscape, substitute products, and end-user profiles. We analyze the competitive landscape, highlighting market share distribution among key players like JGC Holdings Corporation, Bechtel Corporation, Vinci Construction, Royal Haskoning DHV, Saipem SpA, Chiyoda Corporation, Technip FMC plc, Fluor Corporation, McDermott International Inc, and John Wood Group PLC. The report also examines the impact of mergers and acquisitions (M&A) activities, providing insights into deal values and their influence on market dynamics. The estimated market size in 2025 is xx Million.
- Market Concentration: The market exhibits a moderately concentrated structure, with the top 5 players holding an estimated xx% market share in 2025.
- Innovation Catalysts: Technological advancements in liquefaction and regasification technologies, coupled with the development of floating LNG (FLNG) facilities, are driving innovation.
- Regulatory Landscape: Varying regulations across regions influence project approvals and timelines, creating both opportunities and challenges.
- Substitute Products: While LNG holds a strong position as a clean energy source, competition from other energy sources necessitates continuous innovation.
- End-User Profiles: Key end-users include power generation companies, industrial consumers, and transportation sectors.
- M&A Activities: Analysis of recent M&A activities reveals a focus on consolidating expertise and expanding geographical reach. Total M&A deal value in the past 5 years is estimated at xx Million.
LNG Infrastructure Market Industry Evolution
This section analyzes the evolution of the LNG infrastructure market from 2019 to 2033, focusing on market growth trajectories, technological advancements, and shifting consumer demands. We examine the factors influencing the market's expansion, including increasing global energy demand, growing adoption of LNG as a cleaner fuel alternative, and strategic investments in new infrastructure projects. The compound annual growth rate (CAGR) from 2025-2033 is projected to be xx%.
Technological advancements in areas such as cryogenic equipment, automation, and digitalization are enabling greater efficiency and cost-effectiveness in LNG operations. Shifting consumer preferences towards cleaner energy sources and supportive government policies are also propelling market growth. The report includes detailed analysis of specific data points such as capacity additions, investment trends, and technology adoption rates.
Leading Regions, Countries, or Segments in LNG Infrastructure Market
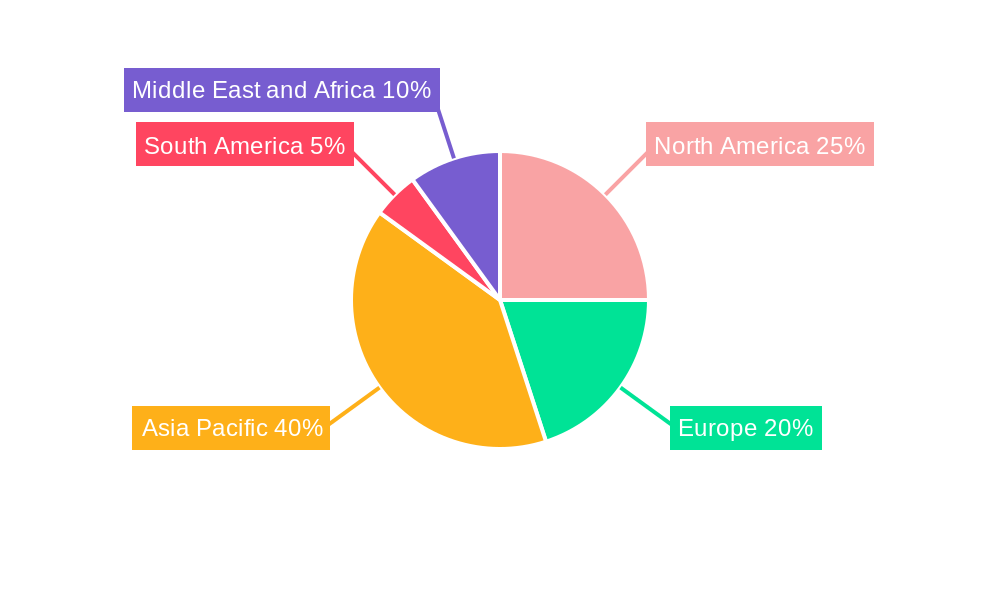
This section identifies the dominant regions, countries, and segments within the LNG infrastructure market, focusing on the "Type" segment: Regasification Terminal and Liquefaction Terminal. Asia-Pacific is currently the leading region, driven by robust demand and significant infrastructure development.
- Regasification Terminals: Key drivers include growing demand for LNG imports in regions with limited domestic gas production. Strong regulatory support and investments in new facilities are further boosting growth.
- Liquefaction Terminals: The market is primarily driven by the expansion of LNG exports from major producing countries. Government incentives and substantial investments in new liquefaction capacity contribute to its growth.
- Dominance Factors: Factors contributing to the dominance of specific regions include existing infrastructure, supportive government policies, access to capital, and strategic geographic location.
LNG Infrastructure Market Product Innovations
Recent product innovations encompass advanced cryogenic equipment, efficient liquefaction and regasification technologies, and enhanced safety systems. The focus is on improving operational efficiency, reducing environmental impact, and ensuring reliability. These advancements are improving the overall performance metrics of LNG infrastructure, reflected in reduced operating costs and enhanced safety records. Unique selling propositions include improved energy efficiency, lower emissions, and increased flexibility in plant operations.
Propelling Factors for LNG Infrastructure Market Growth
Several factors are driving the growth of the LNG infrastructure market. These include:
- Growing global energy demand: The increasing demand for cleaner energy sources is driving investment in LNG infrastructure.
- Government incentives and supportive policies: Many countries are offering incentives to promote LNG adoption.
- Technological advancements: Innovations in liquefaction and regasification technologies are improving efficiency and reducing costs.
Obstacles in the LNG Infrastructure Market
Challenges hindering market growth include:
- Regulatory hurdles: Complex permitting processes and environmental regulations can delay project development.
- Supply chain disruptions: Global supply chain issues can impact project timelines and costs.
- Competitive pressures: Competition from other energy sources, such as renewables and pipeline gas, can affect market growth.
Future Opportunities in LNG Infrastructure Market
Future opportunities lie in:
- Expansion into new markets: Developing economies with rising energy demand present significant growth potential.
- Technological innovation: Further advancements in liquefaction, regasification, and storage technologies will drive efficiency gains and cost reductions.
- Small-scale LNG solutions: Growth in the adoption of small-scale LNG solutions for remote areas and transportation.
Major Players in the LNG Infrastructure Market Ecosystem
- JGC Holdings Corporation
- Bechtel Corporation
- Vinci Construction
- Royal HaskoningDHV
- Saipem SpA
- Chiyoda Corporation
- TechnipFMC plc
- Fluor Corporation
- McDermott International Inc
- John Wood Group PLC
Key Developments in LNG Infrastructure Market Industry
- March 2023: Germany's plans to build extensive LNG infrastructure to enhance European energy security reflect a significant shift in market dynamics, boosting demand for regasification terminals.
- January 2023: BP's deployment of a floating LNG processing facility in West Africa showcases the growing adoption of FLNG technologies and their potential for expanding LNG production in remote areas.
- June 2022: Novatek's agreements for small-scale LNG infrastructure in Russia indicate growing interest in utilizing LNG for diverse applications, particularly in off-grid areas and transportation.
Strategic LNG Infrastructure Market Forecast
The LNG infrastructure market is poised for significant growth driven by sustained global energy demand, increasing investments in new projects, and ongoing technological advancements. Future opportunities lie in expanding into new markets, further developing FLNG technologies, and exploring innovative applications for small-scale LNG solutions. The market’s projected robust growth presents attractive investment opportunities for companies operating in this sector.
LNG Infrastructure Market Segmentation
-
1. Type
- 1.1. Regasification Terminal
- 1.2. Liquefication Terminal
LNG Infrastructure Market Segmentation By Geography
-
1. North America
- 1.1. United States
- 1.2. Canada
- 1.3. Mexico
-
2. Europe
- 2.1. Germany
- 2.2. France
- 2.3. Spain
- 2.4. United Kingdom
- 2.5. Rest of Europe
-
3. Asia Pacifc
- 3.1. China
- 3.2. India
- 3.3. Japan
- 3.4. South Korea
- 3.5. Rest of Asia Pacifc
-
4. South America
- 4.1. Brazil
- 4.2. Argentina
- 4.3. Rest of South America
-
5. Middle East and Africa
- 5.1. United Arab Emirates
- 5.2. Saudi Arabia
- 5.3. Rest of Middle East and Africa
LNG Infrastructure Market Regional Market Share
Geographic Coverage of LNG Infrastructure Market
LNG Infrastructure Market REPORT HIGHLIGHTS
| Aspects | Details |
|---|---|
| Study Period | 2020-2034 |
| Base Year | 2025 |
| Estimated Year | 2026 |
| Forecast Period | 2026-2034 |
| Historical Period | 2020-2025 |
| Growth Rate | CAGR of > 6.00% from 2020-2034 |
| Segmentation |
|
Table of Contents
- 1. Introduction
- 1.1. Research Scope
- 1.2. Market Segmentation
- 1.3. Research Methodology
- 1.4. Definitions and Assumptions
- 2. Executive Summary
- 2.1. Introduction
- 3. Market Dynamics
- 3.1. Introduction
- 3.2. Market Drivers
- 3.2.1. 4.; Growing Vehicle Ownership4.; Government Initiatives
- 3.3. Market Restrains
- 3.3.1. 4.; Volatile Crude Oil Prices
- 3.4. Market Trends
- 3.4.1. Regasification LNG Terminals is Expected to Dominate the Market
- 4. Market Factor Analysis
- 4.1. Porters Five Forces
- 4.2. Supply/Value Chain
- 4.3. PESTEL analysis
- 4.4. Market Entropy
- 4.5. Patent/Trademark Analysis
- 5. Global LNG Infrastructure Market Analysis, Insights and Forecast, 2020-2032
- 5.1. Market Analysis, Insights and Forecast - by Type
- 5.1.1. Regasification Terminal
- 5.1.2. Liquefication Terminal
- 5.2. Market Analysis, Insights and Forecast - by Region
- 5.2.1. North America
- 5.2.2. Europe
- 5.2.3. Asia Pacifc
- 5.2.4. South America
- 5.2.5. Middle East and Africa
- 5.1. Market Analysis, Insights and Forecast - by Type
- 6. North America LNG Infrastructure Market Analysis, Insights and Forecast, 2020-2032
- 6.1. Market Analysis, Insights and Forecast - by Type
- 6.1.1. Regasification Terminal
- 6.1.2. Liquefication Terminal
- 6.1. Market Analysis, Insights and Forecast - by Type
- 7. Europe LNG Infrastructure Market Analysis, Insights and Forecast, 2020-2032
- 7.1. Market Analysis, Insights and Forecast - by Type
- 7.1.1. Regasification Terminal
- 7.1.2. Liquefication Terminal
- 7.1. Market Analysis, Insights and Forecast - by Type
- 8. Asia Pacifc LNG Infrastructure Market Analysis, Insights and Forecast, 2020-2032
- 8.1. Market Analysis, Insights and Forecast - by Type
- 8.1.1. Regasification Terminal
- 8.1.2. Liquefication Terminal
- 8.1. Market Analysis, Insights and Forecast - by Type
- 9. South America LNG Infrastructure Market Analysis, Insights and Forecast, 2020-2032
- 9.1. Market Analysis, Insights and Forecast - by Type
- 9.1.1. Regasification Terminal
- 9.1.2. Liquefication Terminal
- 9.1. Market Analysis, Insights and Forecast - by Type
- 10. Middle East and Africa LNG Infrastructure Market Analysis, Insights and Forecast, 2020-2032
- 10.1. Market Analysis, Insights and Forecast - by Type
- 10.1.1. Regasification Terminal
- 10.1.2. Liquefication Terminal
- 10.1. Market Analysis, Insights and Forecast - by Type
- 11. Competitive Analysis
- 11.1. Global Market Share Analysis 2025
- 11.2. Company Profiles
- 11.2.1 JGC Holdings Corporation
- 11.2.1.1. Overview
- 11.2.1.2. Products
- 11.2.1.3. SWOT Analysis
- 11.2.1.4. Recent Developments
- 11.2.1.5. Financials (Based on Availability)
- 11.2.2 Bechtel Corporation
- 11.2.2.1. Overview
- 11.2.2.2. Products
- 11.2.2.3. SWOT Analysis
- 11.2.2.4. Recent Developments
- 11.2.2.5. Financials (Based on Availability)
- 11.2.3 Vinci Construction
- 11.2.3.1. Overview
- 11.2.3.2. Products
- 11.2.3.3. SWOT Analysis
- 11.2.3.4. Recent Developments
- 11.2.3.5. Financials (Based on Availability)
- 11.2.4 Royal Haskoning DHV
- 11.2.4.1. Overview
- 11.2.4.2. Products
- 11.2.4.3. SWOT Analysis
- 11.2.4.4. Recent Developments
- 11.2.4.5. Financials (Based on Availability)
- 11.2.5 Saipem SpA
- 11.2.5.1. Overview
- 11.2.5.2. Products
- 11.2.5.3. SWOT Analysis
- 11.2.5.4. Recent Developments
- 11.2.5.5. Financials (Based on Availability)
- 11.2.6 Chiyoda Corporation
- 11.2.6.1. Overview
- 11.2.6.2. Products
- 11.2.6.3. SWOT Analysis
- 11.2.6.4. Recent Developments
- 11.2.6.5. Financials (Based on Availability)
- 11.2.7 Technip FMC plc
- 11.2.7.1. Overview
- 11.2.7.2. Products
- 11.2.7.3. SWOT Analysis
- 11.2.7.4. Recent Developments
- 11.2.7.5. Financials (Based on Availability)
- 11.2.8 Fluor Corporation
- 11.2.8.1. Overview
- 11.2.8.2. Products
- 11.2.8.3. SWOT Analysis
- 11.2.8.4. Recent Developments
- 11.2.8.5. Financials (Based on Availability)
- 11.2.9 McDermott International Inc
- 11.2.9.1. Overview
- 11.2.9.2. Products
- 11.2.9.3. SWOT Analysis
- 11.2.9.4. Recent Developments
- 11.2.9.5. Financials (Based on Availability)
- 11.2.10 John Wood Group PLC
- 11.2.10.1. Overview
- 11.2.10.2. Products
- 11.2.10.3. SWOT Analysis
- 11.2.10.4. Recent Developments
- 11.2.10.5. Financials (Based on Availability)
- 11.2.1 JGC Holdings Corporation
List of Figures
- Figure 1: Global LNG Infrastructure Market Revenue Breakdown (Million, %) by Region 2025 & 2033
- Figure 2: North America LNG Infrastructure Market Revenue (Million), by Type 2025 & 2033
- Figure 3: North America LNG Infrastructure Market Revenue Share (%), by Type 2025 & 2033
- Figure 4: North America LNG Infrastructure Market Revenue (Million), by Country 2025 & 2033
- Figure 5: North America LNG Infrastructure Market Revenue Share (%), by Country 2025 & 2033
- Figure 6: Europe LNG Infrastructure Market Revenue (Million), by Type 2025 & 2033
- Figure 7: Europe LNG Infrastructure Market Revenue Share (%), by Type 2025 & 2033
- Figure 8: Europe LNG Infrastructure Market Revenue (Million), by Country 2025 & 2033
- Figure 9: Europe LNG Infrastructure Market Revenue Share (%), by Country 2025 & 2033
- Figure 10: Asia Pacifc LNG Infrastructure Market Revenue (Million), by Type 2025 & 2033
- Figure 11: Asia Pacifc LNG Infrastructure Market Revenue Share (%), by Type 2025 & 2033
- Figure 12: Asia Pacifc LNG Infrastructure Market Revenue (Million), by Country 2025 & 2033
- Figure 13: Asia Pacifc LNG Infrastructure Market Revenue Share (%), by Country 2025 & 2033
- Figure 14: South America LNG Infrastructure Market Revenue (Million), by Type 2025 & 2033
- Figure 15: South America LNG Infrastructure Market Revenue Share (%), by Type 2025 & 2033
- Figure 16: South America LNG Infrastructure Market Revenue (Million), by Country 2025 & 2033
- Figure 17: South America LNG Infrastructure Market Revenue Share (%), by Country 2025 & 2033
- Figure 18: Middle East and Africa LNG Infrastructure Market Revenue (Million), by Type 2025 & 2033
- Figure 19: Middle East and Africa LNG Infrastructure Market Revenue Share (%), by Type 2025 & 2033
- Figure 20: Middle East and Africa LNG Infrastructure Market Revenue (Million), by Country 2025 & 2033
- Figure 21: Middle East and Africa LNG Infrastructure Market Revenue Share (%), by Country 2025 & 2033
List of Tables
- Table 1: Global LNG Infrastructure Market Revenue Million Forecast, by Type 2020 & 2033
- Table 2: Global LNG Infrastructure Market Revenue Million Forecast, by Region 2020 & 2033
- Table 3: Global LNG Infrastructure Market Revenue Million Forecast, by Type 2020 & 2033
- Table 4: Global LNG Infrastructure Market Revenue Million Forecast, by Country 2020 & 2033
- Table 5: United States LNG Infrastructure Market Revenue (Million) Forecast, by Application 2020 & 2033
- Table 6: Canada LNG Infrastructure Market Revenue (Million) Forecast, by Application 2020 & 2033
- Table 7: Mexico LNG Infrastructure Market Revenue (Million) Forecast, by Application 2020 & 2033
- Table 8: Global LNG Infrastructure Market Revenue Million Forecast, by Type 2020 & 2033
- Table 9: Global LNG Infrastructure Market Revenue Million Forecast, by Country 2020 & 2033
- Table 10: Germany LNG Infrastructure Market Revenue (Million) Forecast, by Application 2020 & 2033
- Table 11: France LNG Infrastructure Market Revenue (Million) Forecast, by Application 2020 & 2033
- Table 12: Spain LNG Infrastructure Market Revenue (Million) Forecast, by Application 2020 & 2033
- Table 13: United Kingdom LNG Infrastructure Market Revenue (Million) Forecast, by Application 2020 & 2033
- Table 14: Rest of Europe LNG Infrastructure Market Revenue (Million) Forecast, by Application 2020 & 2033
- Table 15: Global LNG Infrastructure Market Revenue Million Forecast, by Type 2020 & 2033
- Table 16: Global LNG Infrastructure Market Revenue Million Forecast, by Country 2020 & 2033
- Table 17: China LNG Infrastructure Market Revenue (Million) Forecast, by Application 2020 & 2033
- Table 18: India LNG Infrastructure Market Revenue (Million) Forecast, by Application 2020 & 2033
- Table 19: Japan LNG Infrastructure Market Revenue (Million) Forecast, by Application 2020 & 2033
- Table 20: South Korea LNG Infrastructure Market Revenue (Million) Forecast, by Application 2020 & 2033
- Table 21: Rest of Asia Pacifc LNG Infrastructure Market Revenue (Million) Forecast, by Application 2020 & 2033
- Table 22: Global LNG Infrastructure Market Revenue Million Forecast, by Type 2020 & 2033
- Table 23: Global LNG Infrastructure Market Revenue Million Forecast, by Country 2020 & 2033
- Table 24: Brazil LNG Infrastructure Market Revenue (Million) Forecast, by Application 2020 & 2033
- Table 25: Argentina LNG Infrastructure Market Revenue (Million) Forecast, by Application 2020 & 2033
- Table 26: Rest of South America LNG Infrastructure Market Revenue (Million) Forecast, by Application 2020 & 2033
- Table 27: Global LNG Infrastructure Market Revenue Million Forecast, by Type 2020 & 2033
- Table 28: Global LNG Infrastructure Market Revenue Million Forecast, by Country 2020 & 2033
- Table 29: United Arab Emirates LNG Infrastructure Market Revenue (Million) Forecast, by Application 2020 & 2033
- Table 30: Saudi Arabia LNG Infrastructure Market Revenue (Million) Forecast, by Application 2020 & 2033
- Table 31: Rest of Middle East and Africa LNG Infrastructure Market Revenue (Million) Forecast, by Application 2020 & 2033
Frequently Asked Questions
1. What is the projected Compound Annual Growth Rate (CAGR) of the LNG Infrastructure Market?
The projected CAGR is approximately > 6.00%.
2. Which companies are prominent players in the LNG Infrastructure Market?
Key companies in the market include JGC Holdings Corporation, Bechtel Corporation, Vinci Construction, Royal Haskoning DHV, Saipem SpA, Chiyoda Corporation, Technip FMC plc, Fluor Corporation, McDermott International Inc, John Wood Group PLC.
3. What are the main segments of the LNG Infrastructure Market?
The market segments include Type.
4. Can you provide details about the market size?
The market size is estimated to be USD XX Million as of 2022.
5. What are some drivers contributing to market growth?
4.; Growing Vehicle Ownership4.; Government Initiatives.
6. What are the notable trends driving market growth?
Regasification LNG Terminals is Expected to Dominate the Market.
7. Are there any restraints impacting market growth?
4.; Volatile Crude Oil Prices.
8. Can you provide examples of recent developments in the market?
March 2023: The German government intends to build massive LNG infrastructure to maintain European supply security. The German government sees a need for large overcapacity in LNG imports to ensure the region's supply in the event of accidents or sabotage to any of its infrastructure, such as pipelines from Norway.
9. What pricing options are available for accessing the report?
Pricing options include single-user, multi-user, and enterprise licenses priced at USD 4750, USD 5250, and USD 8750 respectively.
10. Is the market size provided in terms of value or volume?
The market size is provided in terms of value, measured in Million.
11. Are there any specific market keywords associated with the report?
Yes, the market keyword associated with the report is "LNG Infrastructure Market," which aids in identifying and referencing the specific market segment covered.
12. How do I determine which pricing option suits my needs best?
The pricing options vary based on user requirements and access needs. Individual users may opt for single-user licenses, while businesses requiring broader access may choose multi-user or enterprise licenses for cost-effective access to the report.
13. Are there any additional resources or data provided in the LNG Infrastructure Market report?
While the report offers comprehensive insights, it's advisable to review the specific contents or supplementary materials provided to ascertain if additional resources or data are available.
14. How can I stay updated on further developments or reports in the LNG Infrastructure Market?
To stay informed about further developments, trends, and reports in the LNG Infrastructure Market, consider subscribing to industry newsletters, following relevant companies and organizations, or regularly checking reputable industry news sources and publications.
Methodology
Step 1 - Identification of Relevant Samples Size from Population Database


Step 2 - Approaches for Defining Global Market Size (Value, Volume* & Price*)

Note*: In applicable scenarios
Step 3 - Data Sources
Primary Research
- Web Analytics
- Survey Reports
- Research Institute
- Latest Research Reports
- Opinion Leaders
Secondary Research
- Annual Reports
- White Paper
- Latest Press Release
- Industry Association
- Paid Database
- Investor Presentations

Step 4 - Data Triangulation
Involves using different sources of information in order to increase the validity of a study
These sources are likely to be stakeholders in a program - participants, other researchers, program staff, other community members, and so on.
Then we put all data in single framework & apply various statistical tools to find out the dynamic on the market.
During the analysis stage, feedback from the stakeholder groups would be compared to determine areas of agreement as well as areas of divergence