

Key Insights
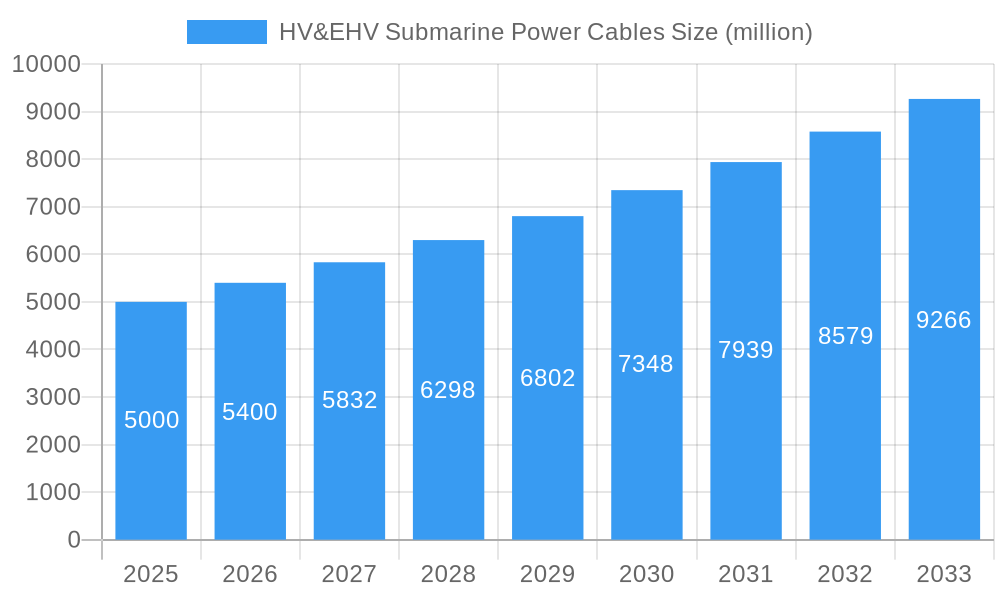
The global HV&EHV submarine power cable market is experiencing robust growth, driven by the increasing demand for renewable energy sources, particularly offshore wind farms. The need to transmit large amounts of power over long distances from these offshore installations to onshore grids is fueling significant investment in this specialized cable infrastructure. Furthermore, the ongoing expansion of interconnector projects between countries is contributing to market expansion, enabling efficient electricity exchange and enhancing grid stability. Technological advancements, such as the development of higher voltage cables and improved installation techniques, are further enhancing the efficiency and reliability of submarine power cable systems. We estimate the market size to be approximately $5 billion in 2025, exhibiting a Compound Annual Growth Rate (CAGR) of around 8% during the forecast period of 2025-2033. This growth is projected to continue due to the aforementioned factors, particularly the substantial growth anticipated in offshore wind energy generation globally.
HV&EHV Submarine Power Cables Market Size (In Billion)
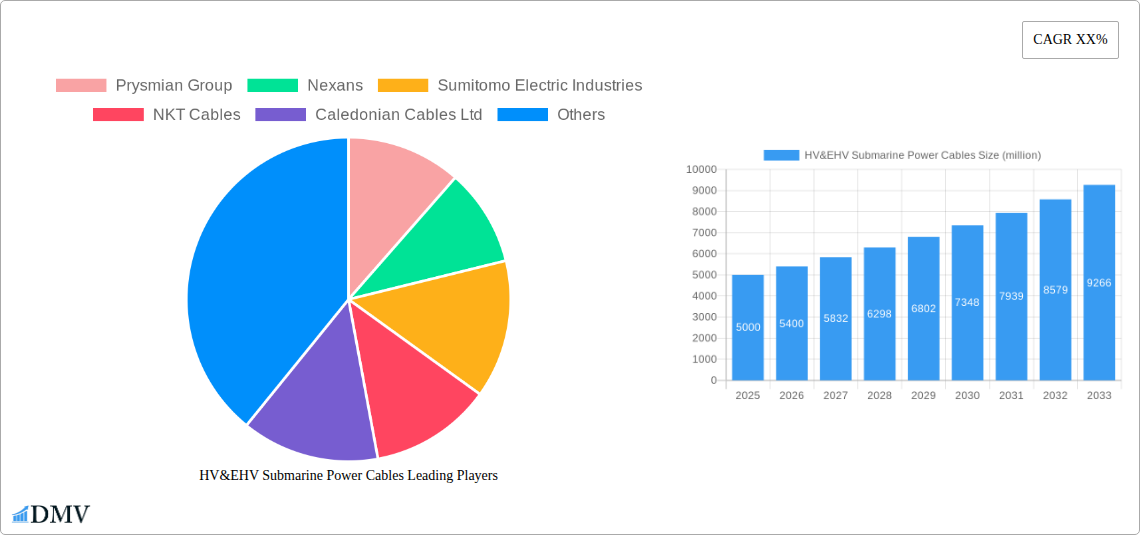
While the market faces challenges like the high initial investment costs associated with HV&EHV submarine cable projects and potential environmental concerns, these are being mitigated through innovative financing models and stricter environmental regulations. The market is highly competitive, with leading players such as Prysmian Group, Nexans, and Sumitomo Electric Industries holding significant market share. However, smaller, regionally focused companies also contribute significantly. Future growth is expected to be influenced by governmental policies supporting renewable energy development and grid modernization, alongside technological advancements in cable materials and installation methods that enhance efficiency and reduce long-term operational costs. The Asia-Pacific region is likely to show strong growth due to its significant investments in renewable energy infrastructure.
HV&EHV Submarine Power Cables Company Market Share
HV&EHV Submarine Power Cables Market: A Comprehensive Report (2019-2033)
This insightful report provides a comprehensive analysis of the HV&EHV Submarine Power Cables market, offering a detailed forecast from 2025 to 2033. Leveraging data from the historical period (2019-2024) and a base year of 2025, this study unveils crucial market trends, technological advancements, and competitive dynamics shaping this vital sector. The report meticulously examines key players, regional variations, and future opportunities, equipping stakeholders with the knowledge necessary for strategic decision-making in this rapidly evolving landscape. With a projected market valuation exceeding xx million by 2033, this report is an indispensable resource for industry professionals, investors, and policymakers alike.
HV&EHV Submarine Power Cables Market Composition & Trends
This section delves into the intricate structure of the HV&EHV Submarine Power Cables market, evaluating its concentration, innovative drivers, regulatory frameworks, substitute products, end-user profiles, and mergers and acquisitions (M&A) activity. The market's competitive landscape is analyzed, highlighting the share distribution among key players such as Prysmian Group, Nexans, Sumitomo Electric Industries, and others.
Market Concentration & Share Distribution:
- Prysmian Group holds an estimated xx% market share in 2025.
- Nexans commands approximately xx% of the market.
- Sumitomo Electric Industries holds a significant xx% share.
- The remaining market share is distributed among other players including NKT Cables, Caledonian Cables Ltd, Furukawa Electric, LS Cable&System, TELE-FONIKA Kable SA, ZTT, Orient Cable, Hengtong Optic Electric, and Qingdao Hanhe Cable.
Innovation Catalysts & Regulatory Landscape: The report examines the influence of technological advancements, such as the development of high-voltage direct current (HVDC) cables and improved insulation materials, on market growth. Regulatory changes impacting cable installation and safety standards are also assessed, influencing both opportunities and challenges within this market.
Substitute Products & End-User Profiles: The study explores the presence of substitute products and their impact on market dynamics. Detailed profiles of end-users, including offshore wind farm developers, electric utilities, and oil & gas companies, are analyzed to understand their specific needs and drivers for HV&EHV submarine cable adoption.
M&A Activity: The report reviews significant M&A activities during the study period (2019-2024), quantifying deal values (in millions) and their impact on market consolidation and competitive positioning. For example, the acquisition of Company X by Company Y in 2022, valued at approximately xx million, significantly altered the market landscape.
HV&EHV Submarine Power Cables Industry Evolution
This section provides a detailed analysis of the evolution of the HV&EHV Submarine Power Cables industry, focusing on market growth trajectories, technological advancements, and shifting consumer demands during the period 2019–2033. The analysis covers the historical period (2019-2024), the base year (2025), and projects growth for the forecast period (2025-2033).
The global HV&EHV Submarine Power Cables market experienced a compound annual growth rate (CAGR) of xx% during the historical period (2019-2024), driven primarily by the increasing demand for renewable energy and the expansion of offshore wind farms. This robust growth is expected to continue in the forecast period, with a projected CAGR of xx% between 2025 and 2033. This growth is fueled by several key factors: the growing need for efficient and reliable electricity transmission across vast distances, particularly in offshore renewable energy projects, technological advancements that lead to higher capacity and longer lifespan cables, as well as increased government support and investment in renewable energy infrastructure. The industry also witnesses a shift towards more sustainable and environmentally friendly cable materials and manufacturing processes. Adoption rates of advanced cable technologies such as HVDC are increasing year-on-year, reflecting a clear trend towards higher transmission capacity and reduced energy losses. The changing landscape of consumer demand focuses on enhanced reliability, longer lifespans, and reduced environmental impact.
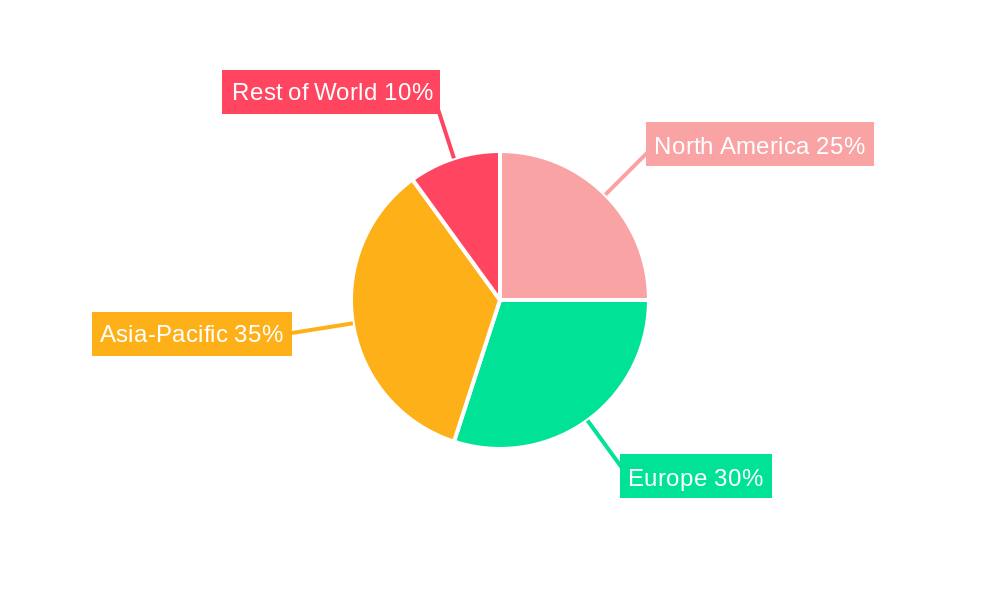
Leading Regions, Countries, or Segments in HV&EHV Submarine Power Cables
This section identifies the leading regions and countries in the HV&EHV Submarine Power Cables market. Analysis indicates that the North American and European regions currently dominate the market. However, Asia-Pacific is experiencing rapid growth, largely driven by significant investments in renewable energy projects, particularly offshore wind farms in countries like China and Taiwan.
Key Drivers of Regional Dominance:
- North America: Strong government support for renewable energy initiatives, extensive offshore wind farm development, and significant investments in grid modernization.
- Europe: High penetration of renewable energy sources, robust regulatory frameworks supporting offshore wind projects, and a well-established infrastructure for submarine cable installation.
- Asia-Pacific: Rapid expansion of renewable energy capacity, particularly offshore wind, coupled with substantial governmental investment in infrastructure development.
Dominance Factors: The dominance of specific regions is primarily attributed to favorable government policies, substantial investments in renewable energy infrastructure, and the presence of established players in the cable manufacturing sector. The significant investments in offshore wind farms are a major catalyst driving demand for HV&EHV submarine power cables, particularly in regions with extensive coastal areas.
HV&EHV Submarine Power Cables Product Innovations
Recent innovations in HV&EHV submarine power cables focus on enhancing performance, reliability, and sustainability. Manufacturers are developing cables with increased voltage capacity, improved insulation materials for enhanced durability, and lighter weight designs for easier installation. The introduction of new manufacturing processes contributes to improved cable longevity and reduced environmental impact. The integration of advanced monitoring systems allows for real-time cable health assessment, enabling preventative maintenance and minimizing downtime. These advancements provide unique selling propositions, attracting customers seeking higher efficiency and lower operational costs.
Propelling Factors for HV&EHV Submarine Power Cables Growth
Several key factors drive the growth of the HV&EHV submarine power cables market. The increasing demand for renewable energy sources, particularly offshore wind power, necessitates efficient and reliable submarine cable systems for power transmission. Government regulations and incentives supporting renewable energy projects further stimulate market expansion. Technological advancements, including the development of higher-voltage capacity cables and improved insulation materials, enhance the efficiency and longevity of these systems. The growing need for grid modernization and upgrades across various regions creates a strong impetus for HV&EHV submarine cable deployment, providing additional growth impetus.
Obstacles in the HV&EHV Submarine Power Cables Market
The HV&EHV submarine power cables market faces several challenges. Stringent regulatory approvals and environmental impact assessments can significantly delay project timelines. Supply chain disruptions, particularly in the sourcing of raw materials, can impact production capacities and increase costs. Intense competition among established cable manufacturers and new entrants exerts pressure on pricing and margins. Fluctuations in raw material prices can affect overall profitability and create pricing volatility. The high initial investment required for installation represents a significant barrier to entry for smaller projects.
Future Opportunities in HV&EHV Submarine Power Cables
Emerging opportunities exist in the HV&EHV submarine power cables market. Expanding offshore wind farms and the increasing reliance on renewable energy sources will drive demand for advanced cable systems. The development of innovative cable designs with higher voltage capacity, improved insulation materials, and integrated monitoring systems presents significant growth potential. Exploration of new materials and technologies aiming to reduce the environmental footprint will unlock further opportunities for sustainable development. The expansion of submarine cable networks connecting different regions and countries for enhanced power grid interconnections presents a notable opportunity for future growth.
Major Players in the HV&EHV Submarine Power Cables Ecosystem
- Prysmian Group
- Nexans
- Sumitomo Electric Industries
- NKT Cables
- Caledonian Cables Ltd
- Furukawa Electric
- LS Cable&System
- TELE-FONIKA Kable SA
- ZTT
- Orient Cable
- Hengtong Optic Electric
- Qingdao Hanhe Cable
Key Developments in HV&EHV Submarine Power Cables Industry
- 2022, Q4: Nexans announces the successful completion of a major HVDC cable installation project off the coast of Scotland.
- 2023, Q1: Prysmian Group launches a new generation of high-voltage submarine cables with improved performance and durability.
- 2023, Q3: Sumitomo Electric Industries partners with a renewable energy firm to develop a new cable technology for deep-water offshore wind farms.
Strategic HV&EHV Submarine Power Cables Market Forecast
The HV&EHV submarine power cables market is poised for robust growth, driven by the global transition to renewable energy and the expansion of offshore wind farms. Technological advancements in cable design and materials will continue to enhance performance and efficiency, reducing installation costs and operational expenditure. Governmental support and investments in grid modernization initiatives across several regions will create additional growth opportunities. The increasing demand for reliable and efficient power transmission over long distances will lead to substantial growth in the overall market size, exceeding xx million by 2033.
HV&EHV Submarine Power Cables Segmentation
-
1. Application
- 1.1. Shallow Sea
- 1.2. Deep Sea
-
2. Types
- 2.1. AC HV/EHV Submarine Power Cables
- 2.2. DC HV/EHV Submarine Power Cables
HV&EHV Submarine Power Cables Segmentation By Geography
-
1. North America
- 1.1. United States
- 1.2. Canada
- 1.3. Mexico
-
2. South America
- 2.1. Brazil
- 2.2. Argentina
- 2.3. Rest of South America
-
3. Europe
- 3.1. United Kingdom
- 3.2. Germany
- 3.3. France
- 3.4. Italy
- 3.5. Spain
- 3.6. Russia
- 3.7. Benelux
- 3.8. Nordics
- 3.9. Rest of Europe
-
4. Middle East & Africa
- 4.1. Turkey
- 4.2. Israel
- 4.3. GCC
- 4.4. North Africa
- 4.5. South Africa
- 4.6. Rest of Middle East & Africa
-
5. Asia Pacific
- 5.1. China
- 5.2. India
- 5.3. Japan
- 5.4. South Korea
- 5.5. ASEAN
- 5.6. Oceania
- 5.7. Rest of Asia Pacific
HV&EHV Submarine Power Cables Regional Market Share
Geographic Coverage of HV&EHV Submarine Power Cables
HV&EHV Submarine Power Cables REPORT HIGHLIGHTS
| Aspects | Details |
|---|---|
| Study Period | 2020-2034 |
| Base Year | 2025 |
| Estimated Year | 2026 |
| Forecast Period | 2026-2034 |
| Historical Period | 2020-2025 |
| Growth Rate | CAGR of 11.4% from 2020-2034 |
| Segmentation |
|
Table of Contents
- 1. Introduction
- 1.1. Research Scope
- 1.2. Market Segmentation
- 1.3. Research Methodology
- 1.4. Definitions and Assumptions
- 2. Executive Summary
- 2.1. Introduction
- 3. Market Dynamics
- 3.1. Introduction
- 3.2. Market Drivers
- 3.3. Market Restrains
- 3.4. Market Trends
- 4. Market Factor Analysis
- 4.1. Porters Five Forces
- 4.2. Supply/Value Chain
- 4.3. PESTEL analysis
- 4.4. Market Entropy
- 4.5. Patent/Trademark Analysis
- 5. Global HV&EHV Submarine Power Cables Analysis, Insights and Forecast, 2020-2032
- 5.1. Market Analysis, Insights and Forecast - by Application
- 5.1.1. Shallow Sea
- 5.1.2. Deep Sea
- 5.2. Market Analysis, Insights and Forecast - by Types
- 5.2.1. AC HV/EHV Submarine Power Cables
- 5.2.2. DC HV/EHV Submarine Power Cables
- 5.3. Market Analysis, Insights and Forecast - by Region
- 5.3.1. North America
- 5.3.2. South America
- 5.3.3. Europe
- 5.3.4. Middle East & Africa
- 5.3.5. Asia Pacific
- 5.1. Market Analysis, Insights and Forecast - by Application
- 6. North America HV&EHV Submarine Power Cables Analysis, Insights and Forecast, 2020-2032
- 6.1. Market Analysis, Insights and Forecast - by Application
- 6.1.1. Shallow Sea
- 6.1.2. Deep Sea
- 6.2. Market Analysis, Insights and Forecast - by Types
- 6.2.1. AC HV/EHV Submarine Power Cables
- 6.2.2. DC HV/EHV Submarine Power Cables
- 6.1. Market Analysis, Insights and Forecast - by Application
- 7. South America HV&EHV Submarine Power Cables Analysis, Insights and Forecast, 2020-2032
- 7.1. Market Analysis, Insights and Forecast - by Application
- 7.1.1. Shallow Sea
- 7.1.2. Deep Sea
- 7.2. Market Analysis, Insights and Forecast - by Types
- 7.2.1. AC HV/EHV Submarine Power Cables
- 7.2.2. DC HV/EHV Submarine Power Cables
- 7.1. Market Analysis, Insights and Forecast - by Application
- 8. Europe HV&EHV Submarine Power Cables Analysis, Insights and Forecast, 2020-2032
- 8.1. Market Analysis, Insights and Forecast - by Application
- 8.1.1. Shallow Sea
- 8.1.2. Deep Sea
- 8.2. Market Analysis, Insights and Forecast - by Types
- 8.2.1. AC HV/EHV Submarine Power Cables
- 8.2.2. DC HV/EHV Submarine Power Cables
- 8.1. Market Analysis, Insights and Forecast - by Application
- 9. Middle East & Africa HV&EHV Submarine Power Cables Analysis, Insights and Forecast, 2020-2032
- 9.1. Market Analysis, Insights and Forecast - by Application
- 9.1.1. Shallow Sea
- 9.1.2. Deep Sea
- 9.2. Market Analysis, Insights and Forecast - by Types
- 9.2.1. AC HV/EHV Submarine Power Cables
- 9.2.2. DC HV/EHV Submarine Power Cables
- 9.1. Market Analysis, Insights and Forecast - by Application
- 10. Asia Pacific HV&EHV Submarine Power Cables Analysis, Insights and Forecast, 2020-2032
- 10.1. Market Analysis, Insights and Forecast - by Application
- 10.1.1. Shallow Sea
- 10.1.2. Deep Sea
- 10.2. Market Analysis, Insights and Forecast - by Types
- 10.2.1. AC HV/EHV Submarine Power Cables
- 10.2.2. DC HV/EHV Submarine Power Cables
- 10.1. Market Analysis, Insights and Forecast - by Application
- 11. Competitive Analysis
- 11.1. Global Market Share Analysis 2025
- 11.2. Company Profiles
- 11.2.1 Prysmian Group
- 11.2.1.1. Overview
- 11.2.1.2. Products
- 11.2.1.3. SWOT Analysis
- 11.2.1.4. Recent Developments
- 11.2.1.5. Financials (Based on Availability)
- 11.2.2 Nexans
- 11.2.2.1. Overview
- 11.2.2.2. Products
- 11.2.2.3. SWOT Analysis
- 11.2.2.4. Recent Developments
- 11.2.2.5. Financials (Based on Availability)
- 11.2.3 Sumitomo Electric Industries
- 11.2.3.1. Overview
- 11.2.3.2. Products
- 11.2.3.3. SWOT Analysis
- 11.2.3.4. Recent Developments
- 11.2.3.5. Financials (Based on Availability)
- 11.2.4 NKT Cables
- 11.2.4.1. Overview
- 11.2.4.2. Products
- 11.2.4.3. SWOT Analysis
- 11.2.4.4. Recent Developments
- 11.2.4.5. Financials (Based on Availability)
- 11.2.5 Caledonian Cables Ltd
- 11.2.5.1. Overview
- 11.2.5.2. Products
- 11.2.5.3. SWOT Analysis
- 11.2.5.4. Recent Developments
- 11.2.5.5. Financials (Based on Availability)
- 11.2.6 Furukawa Electric
- 11.2.6.1. Overview
- 11.2.6.2. Products
- 11.2.6.3. SWOT Analysis
- 11.2.6.4. Recent Developments
- 11.2.6.5. Financials (Based on Availability)
- 11.2.7 LS Cable&System
- 11.2.7.1. Overview
- 11.2.7.2. Products
- 11.2.7.3. SWOT Analysis
- 11.2.7.4. Recent Developments
- 11.2.7.5. Financials (Based on Availability)
- 11.2.8 TELE-FONIKA Kable SA
- 11.2.8.1. Overview
- 11.2.8.2. Products
- 11.2.8.3. SWOT Analysis
- 11.2.8.4. Recent Developments
- 11.2.8.5. Financials (Based on Availability)
- 11.2.9 ZTT
- 11.2.9.1. Overview
- 11.2.9.2. Products
- 11.2.9.3. SWOT Analysis
- 11.2.9.4. Recent Developments
- 11.2.9.5. Financials (Based on Availability)
- 11.2.10 Orient Cable
- 11.2.10.1. Overview
- 11.2.10.2. Products
- 11.2.10.3. SWOT Analysis
- 11.2.10.4. Recent Developments
- 11.2.10.5. Financials (Based on Availability)
- 11.2.11 Hengtong Optic Electric
- 11.2.11.1. Overview
- 11.2.11.2. Products
- 11.2.11.3. SWOT Analysis
- 11.2.11.4. Recent Developments
- 11.2.11.5. Financials (Based on Availability)
- 11.2.12 Qingdao Hanhe Cable
- 11.2.12.1. Overview
- 11.2.12.2. Products
- 11.2.12.3. SWOT Analysis
- 11.2.12.4. Recent Developments
- 11.2.12.5. Financials (Based on Availability)
- 11.2.1 Prysmian Group
List of Figures
- Figure 1: Global HV&EHV Submarine Power Cables Revenue Breakdown (undefined, %) by Region 2025 & 2033
- Figure 2: Global HV&EHV Submarine Power Cables Volume Breakdown (K, %) by Region 2025 & 2033
- Figure 3: North America HV&EHV Submarine Power Cables Revenue (undefined), by Application 2025 & 2033
- Figure 4: North America HV&EHV Submarine Power Cables Volume (K), by Application 2025 & 2033
- Figure 5: North America HV&EHV Submarine Power Cables Revenue Share (%), by Application 2025 & 2033
- Figure 6: North America HV&EHV Submarine Power Cables Volume Share (%), by Application 2025 & 2033
- Figure 7: North America HV&EHV Submarine Power Cables Revenue (undefined), by Types 2025 & 2033
- Figure 8: North America HV&EHV Submarine Power Cables Volume (K), by Types 2025 & 2033
- Figure 9: North America HV&EHV Submarine Power Cables Revenue Share (%), by Types 2025 & 2033
- Figure 10: North America HV&EHV Submarine Power Cables Volume Share (%), by Types 2025 & 2033
- Figure 11: North America HV&EHV Submarine Power Cables Revenue (undefined), by Country 2025 & 2033
- Figure 12: North America HV&EHV Submarine Power Cables Volume (K), by Country 2025 & 2033
- Figure 13: North America HV&EHV Submarine Power Cables Revenue Share (%), by Country 2025 & 2033
- Figure 14: North America HV&EHV Submarine Power Cables Volume Share (%), by Country 2025 & 2033
- Figure 15: South America HV&EHV Submarine Power Cables Revenue (undefined), by Application 2025 & 2033
- Figure 16: South America HV&EHV Submarine Power Cables Volume (K), by Application 2025 & 2033
- Figure 17: South America HV&EHV Submarine Power Cables Revenue Share (%), by Application 2025 & 2033
- Figure 18: South America HV&EHV Submarine Power Cables Volume Share (%), by Application 2025 & 2033
- Figure 19: South America HV&EHV Submarine Power Cables Revenue (undefined), by Types 2025 & 2033
- Figure 20: South America HV&EHV Submarine Power Cables Volume (K), by Types 2025 & 2033
- Figure 21: South America HV&EHV Submarine Power Cables Revenue Share (%), by Types 2025 & 2033
- Figure 22: South America HV&EHV Submarine Power Cables Volume Share (%), by Types 2025 & 2033
- Figure 23: South America HV&EHV Submarine Power Cables Revenue (undefined), by Country 2025 & 2033
- Figure 24: South America HV&EHV Submarine Power Cables Volume (K), by Country 2025 & 2033
- Figure 25: South America HV&EHV Submarine Power Cables Revenue Share (%), by Country 2025 & 2033
- Figure 26: South America HV&EHV Submarine Power Cables Volume Share (%), by Country 2025 & 2033
- Figure 27: Europe HV&EHV Submarine Power Cables Revenue (undefined), by Application 2025 & 2033
- Figure 28: Europe HV&EHV Submarine Power Cables Volume (K), by Application 2025 & 2033
- Figure 29: Europe HV&EHV Submarine Power Cables Revenue Share (%), by Application 2025 & 2033
- Figure 30: Europe HV&EHV Submarine Power Cables Volume Share (%), by Application 2025 & 2033
- Figure 31: Europe HV&EHV Submarine Power Cables Revenue (undefined), by Types 2025 & 2033
- Figure 32: Europe HV&EHV Submarine Power Cables Volume (K), by Types 2025 & 2033
- Figure 33: Europe HV&EHV Submarine Power Cables Revenue Share (%), by Types 2025 & 2033
- Figure 34: Europe HV&EHV Submarine Power Cables Volume Share (%), by Types 2025 & 2033
- Figure 35: Europe HV&EHV Submarine Power Cables Revenue (undefined), by Country 2025 & 2033
- Figure 36: Europe HV&EHV Submarine Power Cables Volume (K), by Country 2025 & 2033
- Figure 37: Europe HV&EHV Submarine Power Cables Revenue Share (%), by Country 2025 & 2033
- Figure 38: Europe HV&EHV Submarine Power Cables Volume Share (%), by Country 2025 & 2033
- Figure 39: Middle East & Africa HV&EHV Submarine Power Cables Revenue (undefined), by Application 2025 & 2033
- Figure 40: Middle East & Africa HV&EHV Submarine Power Cables Volume (K), by Application 2025 & 2033
- Figure 41: Middle East & Africa HV&EHV Submarine Power Cables Revenue Share (%), by Application 2025 & 2033
- Figure 42: Middle East & Africa HV&EHV Submarine Power Cables Volume Share (%), by Application 2025 & 2033
- Figure 43: Middle East & Africa HV&EHV Submarine Power Cables Revenue (undefined), by Types 2025 & 2033
- Figure 44: Middle East & Africa HV&EHV Submarine Power Cables Volume (K), by Types 2025 & 2033
- Figure 45: Middle East & Africa HV&EHV Submarine Power Cables Revenue Share (%), by Types 2025 & 2033
- Figure 46: Middle East & Africa HV&EHV Submarine Power Cables Volume Share (%), by Types 2025 & 2033
- Figure 47: Middle East & Africa HV&EHV Submarine Power Cables Revenue (undefined), by Country 2025 & 2033
- Figure 48: Middle East & Africa HV&EHV Submarine Power Cables Volume (K), by Country 2025 & 2033
- Figure 49: Middle East & Africa HV&EHV Submarine Power Cables Revenue Share (%), by Country 2025 & 2033
- Figure 50: Middle East & Africa HV&EHV Submarine Power Cables Volume Share (%), by Country 2025 & 2033
- Figure 51: Asia Pacific HV&EHV Submarine Power Cables Revenue (undefined), by Application 2025 & 2033
- Figure 52: Asia Pacific HV&EHV Submarine Power Cables Volume (K), by Application 2025 & 2033
- Figure 53: Asia Pacific HV&EHV Submarine Power Cables Revenue Share (%), by Application 2025 & 2033
- Figure 54: Asia Pacific HV&EHV Submarine Power Cables Volume Share (%), by Application 2025 & 2033
- Figure 55: Asia Pacific HV&EHV Submarine Power Cables Revenue (undefined), by Types 2025 & 2033
- Figure 56: Asia Pacific HV&EHV Submarine Power Cables Volume (K), by Types 2025 & 2033
- Figure 57: Asia Pacific HV&EHV Submarine Power Cables Revenue Share (%), by Types 2025 & 2033
- Figure 58: Asia Pacific HV&EHV Submarine Power Cables Volume Share (%), by Types 2025 & 2033
- Figure 59: Asia Pacific HV&EHV Submarine Power Cables Revenue (undefined), by Country 2025 & 2033
- Figure 60: Asia Pacific HV&EHV Submarine Power Cables Volume (K), by Country 2025 & 2033
- Figure 61: Asia Pacific HV&EHV Submarine Power Cables Revenue Share (%), by Country 2025 & 2033
- Figure 62: Asia Pacific HV&EHV Submarine Power Cables Volume Share (%), by Country 2025 & 2033
List of Tables
- Table 1: Global HV&EHV Submarine Power Cables Revenue undefined Forecast, by Application 2020 & 2033
- Table 2: Global HV&EHV Submarine Power Cables Volume K Forecast, by Application 2020 & 2033
- Table 3: Global HV&EHV Submarine Power Cables Revenue undefined Forecast, by Types 2020 & 2033
- Table 4: Global HV&EHV Submarine Power Cables Volume K Forecast, by Types 2020 & 2033
- Table 5: Global HV&EHV Submarine Power Cables Revenue undefined Forecast, by Region 2020 & 2033
- Table 6: Global HV&EHV Submarine Power Cables Volume K Forecast, by Region 2020 & 2033
- Table 7: Global HV&EHV Submarine Power Cables Revenue undefined Forecast, by Application 2020 & 2033
- Table 8: Global HV&EHV Submarine Power Cables Volume K Forecast, by Application 2020 & 2033
- Table 9: Global HV&EHV Submarine Power Cables Revenue undefined Forecast, by Types 2020 & 2033
- Table 10: Global HV&EHV Submarine Power Cables Volume K Forecast, by Types 2020 & 2033
- Table 11: Global HV&EHV Submarine Power Cables Revenue undefined Forecast, by Country 2020 & 2033
- Table 12: Global HV&EHV Submarine Power Cables Volume K Forecast, by Country 2020 & 2033
- Table 13: United States HV&EHV Submarine Power Cables Revenue (undefined) Forecast, by Application 2020 & 2033
- Table 14: United States HV&EHV Submarine Power Cables Volume (K) Forecast, by Application 2020 & 2033
- Table 15: Canada HV&EHV Submarine Power Cables Revenue (undefined) Forecast, by Application 2020 & 2033
- Table 16: Canada HV&EHV Submarine Power Cables Volume (K) Forecast, by Application 2020 & 2033
- Table 17: Mexico HV&EHV Submarine Power Cables Revenue (undefined) Forecast, by Application 2020 & 2033
- Table 18: Mexico HV&EHV Submarine Power Cables Volume (K) Forecast, by Application 2020 & 2033
- Table 19: Global HV&EHV Submarine Power Cables Revenue undefined Forecast, by Application 2020 & 2033
- Table 20: Global HV&EHV Submarine Power Cables Volume K Forecast, by Application 2020 & 2033
- Table 21: Global HV&EHV Submarine Power Cables Revenue undefined Forecast, by Types 2020 & 2033
- Table 22: Global HV&EHV Submarine Power Cables Volume K Forecast, by Types 2020 & 2033
- Table 23: Global HV&EHV Submarine Power Cables Revenue undefined Forecast, by Country 2020 & 2033
- Table 24: Global HV&EHV Submarine Power Cables Volume K Forecast, by Country 2020 & 2033
- Table 25: Brazil HV&EHV Submarine Power Cables Revenue (undefined) Forecast, by Application 2020 & 2033
- Table 26: Brazil HV&EHV Submarine Power Cables Volume (K) Forecast, by Application 2020 & 2033
- Table 27: Argentina HV&EHV Submarine Power Cables Revenue (undefined) Forecast, by Application 2020 & 2033
- Table 28: Argentina HV&EHV Submarine Power Cables Volume (K) Forecast, by Application 2020 & 2033
- Table 29: Rest of South America HV&EHV Submarine Power Cables Revenue (undefined) Forecast, by Application 2020 & 2033
- Table 30: Rest of South America HV&EHV Submarine Power Cables Volume (K) Forecast, by Application 2020 & 2033
- Table 31: Global HV&EHV Submarine Power Cables Revenue undefined Forecast, by Application 2020 & 2033
- Table 32: Global HV&EHV Submarine Power Cables Volume K Forecast, by Application 2020 & 2033
- Table 33: Global HV&EHV Submarine Power Cables Revenue undefined Forecast, by Types 2020 & 2033
- Table 34: Global HV&EHV Submarine Power Cables Volume K Forecast, by Types 2020 & 2033
- Table 35: Global HV&EHV Submarine Power Cables Revenue undefined Forecast, by Country 2020 & 2033
- Table 36: Global HV&EHV Submarine Power Cables Volume K Forecast, by Country 2020 & 2033
- Table 37: United Kingdom HV&EHV Submarine Power Cables Revenue (undefined) Forecast, by Application 2020 & 2033
- Table 38: United Kingdom HV&EHV Submarine Power Cables Volume (K) Forecast, by Application 2020 & 2033
- Table 39: Germany HV&EHV Submarine Power Cables Revenue (undefined) Forecast, by Application 2020 & 2033
- Table 40: Germany HV&EHV Submarine Power Cables Volume (K) Forecast, by Application 2020 & 2033
- Table 41: France HV&EHV Submarine Power Cables Revenue (undefined) Forecast, by Application 2020 & 2033
- Table 42: France HV&EHV Submarine Power Cables Volume (K) Forecast, by Application 2020 & 2033
- Table 43: Italy HV&EHV Submarine Power Cables Revenue (undefined) Forecast, by Application 2020 & 2033
- Table 44: Italy HV&EHV Submarine Power Cables Volume (K) Forecast, by Application 2020 & 2033
- Table 45: Spain HV&EHV Submarine Power Cables Revenue (undefined) Forecast, by Application 2020 & 2033
- Table 46: Spain HV&EHV Submarine Power Cables Volume (K) Forecast, by Application 2020 & 2033
- Table 47: Russia HV&EHV Submarine Power Cables Revenue (undefined) Forecast, by Application 2020 & 2033
- Table 48: Russia HV&EHV Submarine Power Cables Volume (K) Forecast, by Application 2020 & 2033
- Table 49: Benelux HV&EHV Submarine Power Cables Revenue (undefined) Forecast, by Application 2020 & 2033
- Table 50: Benelux HV&EHV Submarine Power Cables Volume (K) Forecast, by Application 2020 & 2033
- Table 51: Nordics HV&EHV Submarine Power Cables Revenue (undefined) Forecast, by Application 2020 & 2033
- Table 52: Nordics HV&EHV Submarine Power Cables Volume (K) Forecast, by Application 2020 & 2033
- Table 53: Rest of Europe HV&EHV Submarine Power Cables Revenue (undefined) Forecast, by Application 2020 & 2033
- Table 54: Rest of Europe HV&EHV Submarine Power Cables Volume (K) Forecast, by Application 2020 & 2033
- Table 55: Global HV&EHV Submarine Power Cables Revenue undefined Forecast, by Application 2020 & 2033
- Table 56: Global HV&EHV Submarine Power Cables Volume K Forecast, by Application 2020 & 2033
- Table 57: Global HV&EHV Submarine Power Cables Revenue undefined Forecast, by Types 2020 & 2033
- Table 58: Global HV&EHV Submarine Power Cables Volume K Forecast, by Types 2020 & 2033
- Table 59: Global HV&EHV Submarine Power Cables Revenue undefined Forecast, by Country 2020 & 2033
- Table 60: Global HV&EHV Submarine Power Cables Volume K Forecast, by Country 2020 & 2033
- Table 61: Turkey HV&EHV Submarine Power Cables Revenue (undefined) Forecast, by Application 2020 & 2033
- Table 62: Turkey HV&EHV Submarine Power Cables Volume (K) Forecast, by Application 2020 & 2033
- Table 63: Israel HV&EHV Submarine Power Cables Revenue (undefined) Forecast, by Application 2020 & 2033
- Table 64: Israel HV&EHV Submarine Power Cables Volume (K) Forecast, by Application 2020 & 2033
- Table 65: GCC HV&EHV Submarine Power Cables Revenue (undefined) Forecast, by Application 2020 & 2033
- Table 66: GCC HV&EHV Submarine Power Cables Volume (K) Forecast, by Application 2020 & 2033
- Table 67: North Africa HV&EHV Submarine Power Cables Revenue (undefined) Forecast, by Application 2020 & 2033
- Table 68: North Africa HV&EHV Submarine Power Cables Volume (K) Forecast, by Application 2020 & 2033
- Table 69: South Africa HV&EHV Submarine Power Cables Revenue (undefined) Forecast, by Application 2020 & 2033
- Table 70: South Africa HV&EHV Submarine Power Cables Volume (K) Forecast, by Application 2020 & 2033
- Table 71: Rest of Middle East & Africa HV&EHV Submarine Power Cables Revenue (undefined) Forecast, by Application 2020 & 2033
- Table 72: Rest of Middle East & Africa HV&EHV Submarine Power Cables Volume (K) Forecast, by Application 2020 & 2033
- Table 73: Global HV&EHV Submarine Power Cables Revenue undefined Forecast, by Application 2020 & 2033
- Table 74: Global HV&EHV Submarine Power Cables Volume K Forecast, by Application 2020 & 2033
- Table 75: Global HV&EHV Submarine Power Cables Revenue undefined Forecast, by Types 2020 & 2033
- Table 76: Global HV&EHV Submarine Power Cables Volume K Forecast, by Types 2020 & 2033
- Table 77: Global HV&EHV Submarine Power Cables Revenue undefined Forecast, by Country 2020 & 2033
- Table 78: Global HV&EHV Submarine Power Cables Volume K Forecast, by Country 2020 & 2033
- Table 79: China HV&EHV Submarine Power Cables Revenue (undefined) Forecast, by Application 2020 & 2033
- Table 80: China HV&EHV Submarine Power Cables Volume (K) Forecast, by Application 2020 & 2033
- Table 81: India HV&EHV Submarine Power Cables Revenue (undefined) Forecast, by Application 2020 & 2033
- Table 82: India HV&EHV Submarine Power Cables Volume (K) Forecast, by Application 2020 & 2033
- Table 83: Japan HV&EHV Submarine Power Cables Revenue (undefined) Forecast, by Application 2020 & 2033
- Table 84: Japan HV&EHV Submarine Power Cables Volume (K) Forecast, by Application 2020 & 2033
- Table 85: South Korea HV&EHV Submarine Power Cables Revenue (undefined) Forecast, by Application 2020 & 2033
- Table 86: South Korea HV&EHV Submarine Power Cables Volume (K) Forecast, by Application 2020 & 2033
- Table 87: ASEAN HV&EHV Submarine Power Cables Revenue (undefined) Forecast, by Application 2020 & 2033
- Table 88: ASEAN HV&EHV Submarine Power Cables Volume (K) Forecast, by Application 2020 & 2033
- Table 89: Oceania HV&EHV Submarine Power Cables Revenue (undefined) Forecast, by Application 2020 & 2033
- Table 90: Oceania HV&EHV Submarine Power Cables Volume (K) Forecast, by Application 2020 & 2033
- Table 91: Rest of Asia Pacific HV&EHV Submarine Power Cables Revenue (undefined) Forecast, by Application 2020 & 2033
- Table 92: Rest of Asia Pacific HV&EHV Submarine Power Cables Volume (K) Forecast, by Application 2020 & 2033
Frequently Asked Questions
1. What is the projected Compound Annual Growth Rate (CAGR) of the HV&EHV Submarine Power Cables?
The projected CAGR is approximately 11.4%.
2. Which companies are prominent players in the HV&EHV Submarine Power Cables?
Key companies in the market include Prysmian Group, Nexans, Sumitomo Electric Industries, NKT Cables, Caledonian Cables Ltd, Furukawa Electric, LS Cable&System, TELE-FONIKA Kable SA, ZTT, Orient Cable, Hengtong Optic Electric, Qingdao Hanhe Cable.
3. What are the main segments of the HV&EHV Submarine Power Cables?
The market segments include Application, Types.
4. Can you provide details about the market size?
The market size is estimated to be USD XXX N/A as of 2022.
5. What are some drivers contributing to market growth?
N/A
6. What are the notable trends driving market growth?
N/A
7. Are there any restraints impacting market growth?
N/A
8. Can you provide examples of recent developments in the market?
N/A
9. What pricing options are available for accessing the report?
Pricing options include single-user, multi-user, and enterprise licenses priced at USD 3350.00, USD 5025.00, and USD 6700.00 respectively.
10. Is the market size provided in terms of value or volume?
The market size is provided in terms of value, measured in N/A and volume, measured in K.
11. Are there any specific market keywords associated with the report?
Yes, the market keyword associated with the report is "HV&EHV Submarine Power Cables," which aids in identifying and referencing the specific market segment covered.
12. How do I determine which pricing option suits my needs best?
The pricing options vary based on user requirements and access needs. Individual users may opt for single-user licenses, while businesses requiring broader access may choose multi-user or enterprise licenses for cost-effective access to the report.
13. Are there any additional resources or data provided in the HV&EHV Submarine Power Cables report?
While the report offers comprehensive insights, it's advisable to review the specific contents or supplementary materials provided to ascertain if additional resources or data are available.
14. How can I stay updated on further developments or reports in the HV&EHV Submarine Power Cables?
To stay informed about further developments, trends, and reports in the HV&EHV Submarine Power Cables, consider subscribing to industry newsletters, following relevant companies and organizations, or regularly checking reputable industry news sources and publications.
Methodology
Step 1 - Identification of Relevant Samples Size from Population Database


Step 2 - Approaches for Defining Global Market Size (Value, Volume* & Price*)

Note*: In applicable scenarios
Step 3 - Data Sources
Primary Research
- Web Analytics
- Survey Reports
- Research Institute
- Latest Research Reports
- Opinion Leaders
Secondary Research
- Annual Reports
- White Paper
- Latest Press Release
- Industry Association
- Paid Database
- Investor Presentations

Step 4 - Data Triangulation
Involves using different sources of information in order to increase the validity of a study
These sources are likely to be stakeholders in a program - participants, other researchers, program staff, other community members, and so on.
Then we put all data in single framework & apply various statistical tools to find out the dynamic on the market.
During the analysis stage, feedback from the stakeholder groups would be compared to determine areas of agreement as well as areas of divergence