

Key Insights
The global Power-to-X (PtX) market, a critical component of energy decarbonization, is poised for substantial expansion. This includes Power-to-Hydrogen and Power-to-Methane technologies, which are projected to grow at a robust Compound Annual Growth Rate (CAGR) of 6.4%. The market is currently valued at 78.9 billion in the base year 2024. This significant growth is fueled by increasing demand for sustainable fuels and chemicals, alongside supportive government policies aimed at renewable energy integration and stringent carbon emission reduction targets. Technological advancements in electrolysis and methanation are enhancing the cost-competitiveness of PtX solutions. The market is segmented by technology (with Power-to-Hydrogen leading and Power-to-Methane gaining momentum), system capacity, and end-user sectors, including utilities, industrial, and commercial entities. While North America and Europe are leading adoption, Asia-Pacific is anticipated to witness rapid expansion, driven by substantial renewable energy investments in China and India.
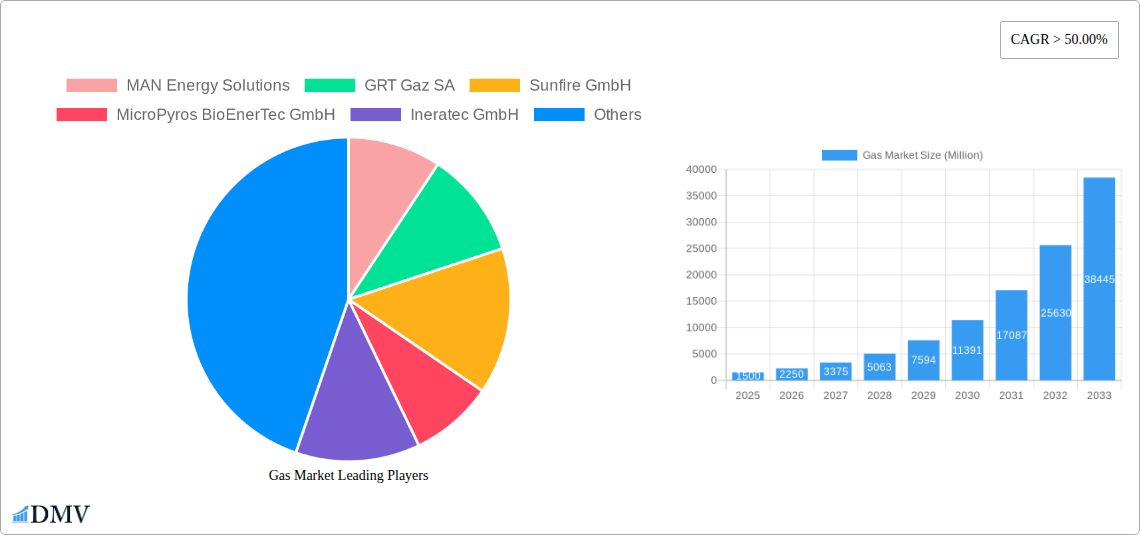
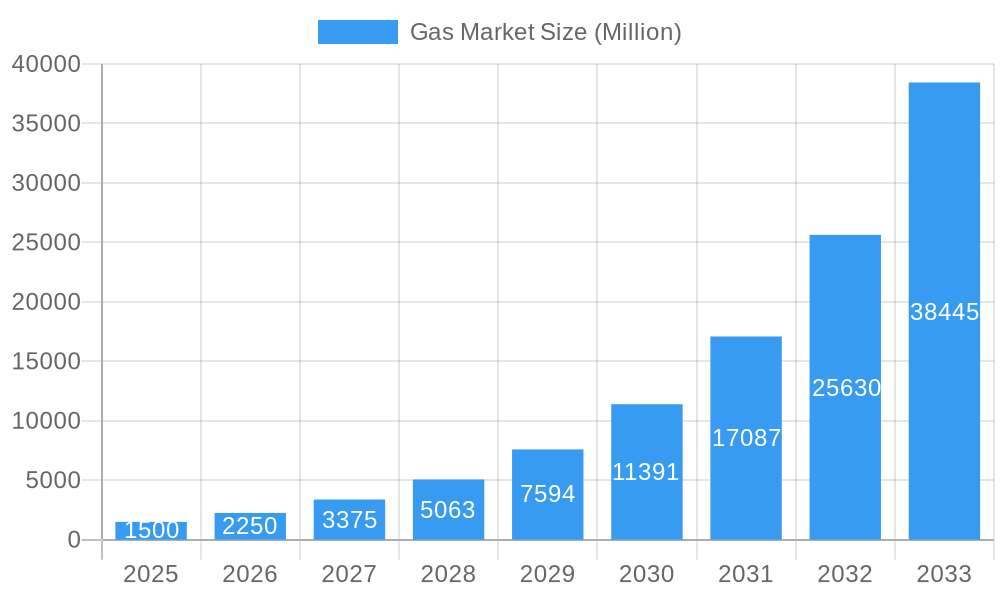
Gas Market Market Size (In Billion)
Key challenges that require strategic attention include the high upfront capital expenditure for PtX facilities, the imperative for accessible and affordable renewable energy sources, and the crucial development of infrastructure for hydrogen and methane storage and transportation. The market's trajectory indicates a steep upward curve, propelled by efficiency gains and cost reductions through ongoing technological innovation. Leading companies are actively investing in research and development to enhance the scale and efficiency of PtX systems. The increasing adoption by the commercial sector for on-site energy and fuel production, alongside broader industrial integration, is a significant growth driver. Long-term market success will depend on overcoming technological barriers, securing project financing, establishing clear regulatory frameworks, and fostering economically viable and environmentally sustainable PtX solutions supported by consistent governmental policies.
Gas Market Company Market Share
Gas Market: A Comprehensive Market Report (2019-2033)
This insightful report provides a detailed analysis of the Gas Market, encompassing market size, growth drivers, technological advancements, and competitive landscapes from 2019 to 2033. We delve into the intricacies of Power-to-Hydrogen and Power-to-Methane technologies, examining market segments by capacity (more than 1000 KW, 100 to 1000 KW, less than 100 KW) and end-user (Utilities, Industrial, Commercial). The report leverages extensive data analysis and forecasts to offer a comprehensive view for stakeholders. The base year for this report is 2025, with the forecast period extending to 2033. The historical period analyzed is 2019-2024. Expect detailed insights into key players including MAN Energy Solutions, GRT Gaz SA, Sunfire GmbH, MicroPyros BioEnerTec GmbH, Ineratec GmbH, AquahydreX Inc, Siemens Energy AG, Electrochaea GmbH, Hitachi Zosen Inova AG, Sempra Energy, and Nel ASA, amongst others. The report provides crucial information for investment decisions and strategic planning within this rapidly evolving market.
Gas Market Market Composition & Trends
This section provides a comprehensive overview of the Gas Market's composition and current trends. We analyze market concentration, revealing a moderately fragmented landscape with key players holding significant, but not dominant, market share. The total market size in 2025 is estimated at xx Million USD. Innovation is a key driver, with significant investments in Power-to-X technologies shaping the competitive landscape. Stringent environmental regulations, particularly concerning carbon emissions, are creating substantial opportunities for clean hydrogen and methane solutions. Substitute products, such as traditional fossil fuels, face increasing pressure due to rising environmental concerns and policy changes.
- Market Share Distribution (2025): The report provides detailed analysis of market share distribution across major players, with xx% attributed to the top 5 companies.
- M&A Activity: The report includes a detailed analysis of recent mergers and acquisitions (M&A) activities, detailing the value of major deals (totaling approximately xx Million USD in the past five years).
- Innovation Catalysts: Strong governmental support for clean energy initiatives and ongoing R&D efforts are driving innovation in the field.
- Regulatory Landscape: Varied and evolving regulatory landscapes across regions significantly influence market growth and investment decisions.
- End-User Profiles: Detailed analysis of end-user segments, including utilities, industrial, and commercial sectors, detailing specific needs and adoption rates.
Gas Market Industry Evolution
The Gas Market is experiencing dynamic growth, driven by increasing demand for cleaner energy sources and technological breakthroughs in hydrogen and methane production. From 2019 to 2024, the market witnessed a Compound Annual Growth Rate (CAGR) of xx%, primarily fueled by government incentives, corporate sustainability goals, and technological advancements leading to cost reductions in production. The forecast period (2025-2033) projects a continued growth trajectory, with a projected CAGR of xx%, potentially reaching xx Million USD by 2033. Technological advancements, particularly in electrolysis and methanation processes, are pivotal in accelerating market expansion. This evolution includes efficiency improvements, scalability enhancements, and cost reductions in Power-to-X technologies. Consumer demand shifts towards sustainable energy solutions, coupled with heightened environmental awareness, further accelerate market growth. Specific adoption metrics for Power-to-Hydrogen and Power-to-Methane technologies, including deployment rates and capacity additions, are analyzed in detail within the report.
Leading Regions, Countries, or Segments in Gas Market
This section identifies leading regions, countries, and market segments within the Gas Market. While a complete picture requires analysis within the full report, we can anticipate key regional leaders based on existing infrastructure and policy frameworks.
By Technology:
- Power-to-Hydrogen: This segment is expected to dominate due to its versatility and significant government support in several regions. Key drivers include the increasing availability of renewable energy and government incentives targeted specifically at hydrogen production.
- Power-to-Methane: While showing strong growth potential, this segment lags slightly behind Power-to-Hydrogen due to comparatively higher initial investment costs and a more nascent technological landscape.
By Capacity:
- More than 1000 KW: This segment is experiencing robust growth driven by large-scale industrial and utility applications.
- 100 to 1000 KW: Significant growth is expected in this segment, propelled by decentralized applications and increasing commercial adoption.
- Less than 100 KW: This segment is characterized by a high number of small-scale installations, predominantly in commercial and residential sectors; growth is projected to be steady.
By End-User:
- Utilities: The utilities sector is a major driver, leading investments in large-scale hydrogen and methane production facilities.
- Industrial: The industrial sector displays strong demand for clean energy to meet operational needs and environmental regulations.
- Commercial: This sector shows substantial growth potential, driven by increasingly stringent environmental standards and rising energy costs.
The detailed report provides in-depth analysis of factors driving the dominance of specific regions and segments, including investment trends, regulatory support, and technological advancements.
Gas Market Product Innovations
Recent years have seen significant advancements in electrolyzer technology, leading to increased efficiency, reduced costs, and improved scalability of Power-to-Hydrogen and Power-to-Methane systems. Innovations focus on modular designs, improved materials, and optimized process control for higher conversion rates. These innovations are translating into higher energy efficiency, lower operational costs, and a wider range of applications. Unique selling propositions include improved durability, smaller footprint, and enhanced safety features.
Propelling Factors for Gas Market Growth
Several key factors are accelerating the growth of the Gas Market. Technological advancements, especially in electrolyzer and methanation technologies, are drastically improving efficiency and reducing production costs. Governmental incentives and regulations, including carbon pricing mechanisms and subsidies for clean energy projects, are significantly driving market expansion. The increasing need for energy security and diversification, alongside the growing concerns about climate change and environmental sustainability, are further fueling the demand for cleaner energy sources.
Obstacles in the Gas Market Market
Despite the growth potential, several challenges impede the Gas Market's development. High capital expenditure for large-scale production facilities poses a significant barrier to entry for smaller players. Supply chain disruptions and the limited availability of specific components can cause delays and cost increases. Regulatory uncertainties and varying standards across different regions can create complexities for businesses operating internationally. Lastly, competition from traditional fossil fuels and other alternative energy technologies also presents a challenge.
Future Opportunities in Gas Market
Future opportunities lie in the development of integrated Power-to-X solutions combining energy storage and hydrogen or methane production. Further advancements in electrolyzer and methanation technologies will lead to enhanced efficiency and cost reduction, unlocking wider applications. Expanding into new markets with supportive regulatory frameworks and strong renewable energy potential presents significant opportunities for growth.
Major Players in the Gas Market Ecosystem
- MAN Energy Solutions
- GRT Gaz SA
- Sunfire GmbH
- MicroPyros BioEnerTec GmbH
- Ineratec GmbH
- AquahydreX Inc
- Siemens Energy AG
- Electrochaea GmbH
- Hitachi Zosen Inova AG
- Sempra Energy
- Nel ASA
Key Developments in Gas Market Industry
- June 2022: The United States Department of Energy announced a USD 504.4 Million investment in the Advanced Clean Energy Storage project in Delta, Utah, signifying a major commitment to clean hydrogen infrastructure.
- February 2022: Mitsubishi Power's contract with HydrogenPro for a large-scale electrolyzer system highlights the growing adoption of green hydrogen technologies.
Strategic Gas Market Market Forecast
The Gas Market is poised for robust growth in the coming years, driven by technological advancements, supportive government policies, and increasing demand for sustainable energy solutions. The market is expected to witness significant expansion across various segments, with Power-to-Hydrogen leading the way. Continued investment in research and development, along with strategic partnerships and collaborations, will further propel market growth, creating significant opportunities for businesses involved in this sector. The total market value is projected to reach xx Million USD by 2033.
Gas Market Segmentation
-
1. Technology
- 1.1. Power-to-Hydrogen
- 1.2. Power-to-Methane
-
2. Capacity (Qualitative Analysis Only)
- 2.1. More than 1000 KW
- 2.2. 100 to 1000 KW
- 2.3. Less than 100 KW
-
3. y End-User
- 3.1. Utilities
- 3.2. Industrial
- 3.3. Commercial
Gas Market Segmentation By Geography
- 1. North America
- 2. Europe
- 3. Asia Pacific
- 4. South America
- 5. Middle East and Africa
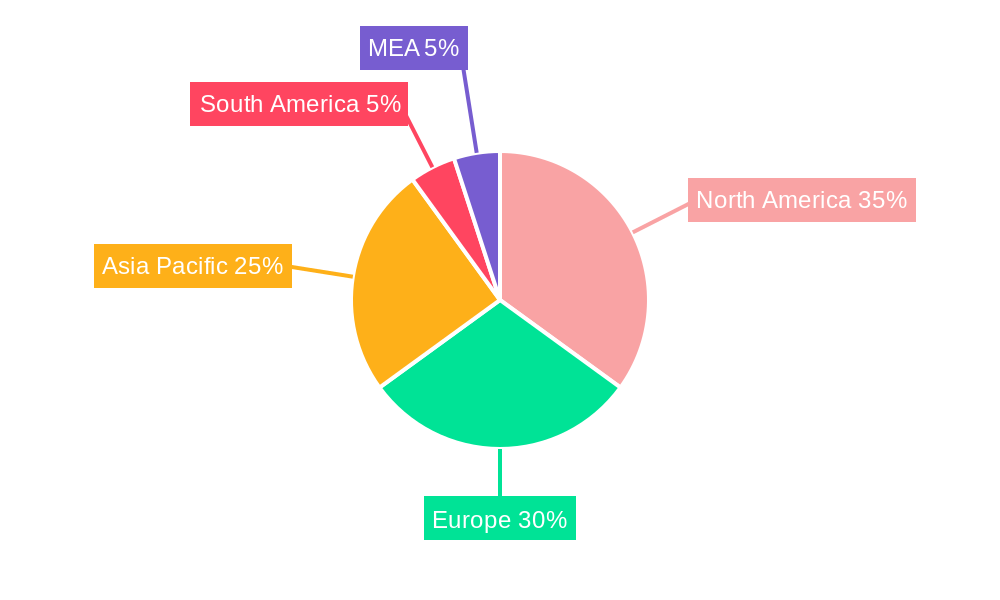
Gas Market Regional Market Share
Geographic Coverage of Gas Market
Gas Market REPORT HIGHLIGHTS
| Aspects | Details |
|---|---|
| Study Period | 2020-2034 |
| Base Year | 2025 |
| Estimated Year | 2026 |
| Forecast Period | 2026-2034 |
| Historical Period | 2020-2025 |
| Growth Rate | CAGR of 6.4% from 2020-2034 |
| Segmentation |
|
Table of Contents
- 1. Introduction
- 1.1. Research Scope
- 1.2. Market Segmentation
- 1.3. Research Objective
- 1.4. Definitions and Assumptions
- 2. Executive Summary
- 2.1. Market Snapshot
- 3. Market Dynamics
- 3.1. Market Drivers
- 3.2. Market Restrains
- 3.3. Market Trends
- 3.4. Market Opportunities
- 4. Market Factor Analysis
- 4.1. Porters Five Forces
- 4.1.1. Bargaining Power of Suppliers
- 4.1.2. Bargaining Power of Buyers
- 4.1.3. Threat of New Entrants
- 4.1.4. Threat of Substitutes
- 4.1.5. Competitive Rivalry
- 4.2. PESTEL analysis
- 4.3. BCG Analysis
- 4.3.1. Stars (High Growth, High Market Share)
- 4.3.2. Cash Cows (Low Growth, High Market Share)
- 4.3.3. Question Mark (High Growth, Low Market Share)
- 4.3.4. Dogs (Low Growth, Low Market Share)
- 4.4. Ansoff Matrix Analysis
- 4.5. Supply Chain Analysis
- 4.6. Regulatory Landscape
- 4.7. Current Market Potential and Opportunity Assessment (TAM–SAM–SOM Framework)
- 4.8. DMV Analyst Note
- 4.1. Porters Five Forces
- 5. Market Analysis, Insights and Forecast 2021-2033
- 5.1. Market Analysis, Insights and Forecast - by Technology
- 5.1.1. Power-to-Hydrogen
- 5.1.2. Power-to-Methane
- 5.2. Market Analysis, Insights and Forecast - by Capacity (Qualitative Analysis Only)
- 5.2.1. More than 1000 KW
- 5.2.2. 100 to 1000 KW
- 5.2.3. Less than 100 KW
- 5.3. Market Analysis, Insights and Forecast - by y End-User
- 5.3.1. Utilities
- 5.3.2. Industrial
- 5.3.3. Commercial
- 5.4. Market Analysis, Insights and Forecast - by Region
- 5.4.1. North America
- 5.4.2. Europe
- 5.4.3. Asia Pacific
- 5.4.4. South America
- 5.4.5. Middle East and Africa
- 5.1. Market Analysis, Insights and Forecast - by Technology
- 6. Global Gas Market Analysis, Insights and Forecast, 2021-2033
- 6.1. Market Analysis, Insights and Forecast - by Technology
- 6.1.1. Power-to-Hydrogen
- 6.1.2. Power-to-Methane
- 6.2. Market Analysis, Insights and Forecast - by Capacity (Qualitative Analysis Only)
- 6.2.1. More than 1000 KW
- 6.2.2. 100 to 1000 KW
- 6.2.3. Less than 100 KW
- 6.3. Market Analysis, Insights and Forecast - by y End-User
- 6.3.1. Utilities
- 6.3.2. Industrial
- 6.3.3. Commercial
- 6.1. Market Analysis, Insights and Forecast - by Technology
- 7. North America Gas Market Analysis, Insights and Forecast, 2020-2032
- 7.1. Market Analysis, Insights and Forecast - by Technology
- 7.1.1. Power-to-Hydrogen
- 7.1.2. Power-to-Methane
- 7.2. Market Analysis, Insights and Forecast - by Capacity (Qualitative Analysis Only)
- 7.2.1. More than 1000 KW
- 7.2.2. 100 to 1000 KW
- 7.2.3. Less than 100 KW
- 7.3. Market Analysis, Insights and Forecast - by y End-User
- 7.3.1. Utilities
- 7.3.2. Industrial
- 7.3.3. Commercial
- 7.1. Market Analysis, Insights and Forecast - by Technology
- 8. Europe Gas Market Analysis, Insights and Forecast, 2020-2032
- 8.1. Market Analysis, Insights and Forecast - by Technology
- 8.1.1. Power-to-Hydrogen
- 8.1.2. Power-to-Methane
- 8.2. Market Analysis, Insights and Forecast - by Capacity (Qualitative Analysis Only)
- 8.2.1. More than 1000 KW
- 8.2.2. 100 to 1000 KW
- 8.2.3. Less than 100 KW
- 8.3. Market Analysis, Insights and Forecast - by y End-User
- 8.3.1. Utilities
- 8.3.2. Industrial
- 8.3.3. Commercial
- 8.1. Market Analysis, Insights and Forecast - by Technology
- 9. Asia Pacific Gas Market Analysis, Insights and Forecast, 2020-2032
- 9.1. Market Analysis, Insights and Forecast - by Technology
- 9.1.1. Power-to-Hydrogen
- 9.1.2. Power-to-Methane
- 9.2. Market Analysis, Insights and Forecast - by Capacity (Qualitative Analysis Only)
- 9.2.1. More than 1000 KW
- 9.2.2. 100 to 1000 KW
- 9.2.3. Less than 100 KW
- 9.3. Market Analysis, Insights and Forecast - by y End-User
- 9.3.1. Utilities
- 9.3.2. Industrial
- 9.3.3. Commercial
- 9.1. Market Analysis, Insights and Forecast - by Technology
- 10. South America Gas Market Analysis, Insights and Forecast, 2020-2032
- 10.1. Market Analysis, Insights and Forecast - by Technology
- 10.1.1. Power-to-Hydrogen
- 10.1.2. Power-to-Methane
- 10.2. Market Analysis, Insights and Forecast - by Capacity (Qualitative Analysis Only)
- 10.2.1. More than 1000 KW
- 10.2.2. 100 to 1000 KW
- 10.2.3. Less than 100 KW
- 10.3. Market Analysis, Insights and Forecast - by y End-User
- 10.3.1. Utilities
- 10.3.2. Industrial
- 10.3.3. Commercial
- 10.1. Market Analysis, Insights and Forecast - by Technology
- 11. Middle East and Africa Gas Market Analysis, Insights and Forecast, 2020-2032
- 11.1. Market Analysis, Insights and Forecast - by Technology
- 11.1.1. Power-to-Hydrogen
- 11.1.2. Power-to-Methane
- 11.2. Market Analysis, Insights and Forecast - by Capacity (Qualitative Analysis Only)
- 11.2.1. More than 1000 KW
- 11.2.2. 100 to 1000 KW
- 11.2.3. Less than 100 KW
- 11.3. Market Analysis, Insights and Forecast - by y End-User
- 11.3.1. Utilities
- 11.3.2. Industrial
- 11.3.3. Commercial
- 11.1. Market Analysis, Insights and Forecast - by Technology
- 12. Competitive Analysis
- 12.1. Company Profiles
- 12.1.1 MAN Energy Solutions
- 12.1.1.1. Company Overview
- 12.1.1.2. Products
- 12.1.1.3. Company Financials
- 12.1.1.4. SWOT Analysis
- 12.1.2 GRT Gaz SA
- 12.1.2.1. Company Overview
- 12.1.2.2. Products
- 12.1.2.3. Company Financials
- 12.1.2.4. SWOT Analysis
- 12.1.3 Sunfire GmbH
- 12.1.3.1. Company Overview
- 12.1.3.2. Products
- 12.1.3.3. Company Financials
- 12.1.3.4. SWOT Analysis
- 12.1.4 MicroPyros BioEnerTec GmbH
- 12.1.4.1. Company Overview
- 12.1.4.2. Products
- 12.1.4.3. Company Financials
- 12.1.4.4. SWOT Analysis
- 12.1.5 Ineratec GmbH
- 12.1.5.1. Company Overview
- 12.1.5.2. Products
- 12.1.5.3. Company Financials
- 12.1.5.4. SWOT Analysis
- 12.1.6 AquahydreX Inc *List Not Exhaustive
- 12.1.6.1. Company Overview
- 12.1.6.2. Products
- 12.1.6.3. Company Financials
- 12.1.6.4. SWOT Analysis
- 12.1.7 Siemens Energy AG
- 12.1.7.1. Company Overview
- 12.1.7.2. Products
- 12.1.7.3. Company Financials
- 12.1.7.4. SWOT Analysis
- 12.1.8 Electrochaea GmbH
- 12.1.8.1. Company Overview
- 12.1.8.2. Products
- 12.1.8.3. Company Financials
- 12.1.8.4. SWOT Analysis
- 12.1.9 Hitachi Zosen Inova AG
- 12.1.9.1. Company Overview
- 12.1.9.2. Products
- 12.1.9.3. Company Financials
- 12.1.9.4. SWOT Analysis
- 12.1.10 Sempra Energy
- 12.1.10.1. Company Overview
- 12.1.10.2. Products
- 12.1.10.3. Company Financials
- 12.1.10.4. SWOT Analysis
- 12.1.11 Nel ASA
- 12.1.11.1. Company Overview
- 12.1.11.2. Products
- 12.1.11.3. Company Financials
- 12.1.11.4. SWOT Analysis
- 12.1.1 MAN Energy Solutions
- 12.2. Market Entropy
- 12.2.1 Company's Key Areas Served
- 12.2.2 Recent Developments
- 12.3. Company Market Share Analysis 2025
- 12.3.1 Top 5 Companies Market Share Analysis
- 12.3.2 Top 3 Companies Market Share Analysis
- 12.4. List of Potential Customers
- 13. Research Methodology
List of Figures
- Figure 1: Global Gas Market Revenue Breakdown (billion, %) by Region 2025 & 2033
- Figure 2: North America Gas Market Revenue (billion), by Technology 2025 & 2033
- Figure 3: North America Gas Market Revenue Share (%), by Technology 2025 & 2033
- Figure 4: North America Gas Market Revenue (billion), by Capacity (Qualitative Analysis Only) 2025 & 2033
- Figure 5: North America Gas Market Revenue Share (%), by Capacity (Qualitative Analysis Only) 2025 & 2033
- Figure 6: North America Gas Market Revenue (billion), by y End-User 2025 & 2033
- Figure 7: North America Gas Market Revenue Share (%), by y End-User 2025 & 2033
- Figure 8: North America Gas Market Revenue (billion), by Country 2025 & 2033
- Figure 9: North America Gas Market Revenue Share (%), by Country 2025 & 2033
- Figure 10: Europe Gas Market Revenue (billion), by Technology 2025 & 2033
- Figure 11: Europe Gas Market Revenue Share (%), by Technology 2025 & 2033
- Figure 12: Europe Gas Market Revenue (billion), by Capacity (Qualitative Analysis Only) 2025 & 2033
- Figure 13: Europe Gas Market Revenue Share (%), by Capacity (Qualitative Analysis Only) 2025 & 2033
- Figure 14: Europe Gas Market Revenue (billion), by y End-User 2025 & 2033
- Figure 15: Europe Gas Market Revenue Share (%), by y End-User 2025 & 2033
- Figure 16: Europe Gas Market Revenue (billion), by Country 2025 & 2033
- Figure 17: Europe Gas Market Revenue Share (%), by Country 2025 & 2033
- Figure 18: Asia Pacific Gas Market Revenue (billion), by Technology 2025 & 2033
- Figure 19: Asia Pacific Gas Market Revenue Share (%), by Technology 2025 & 2033
- Figure 20: Asia Pacific Gas Market Revenue (billion), by Capacity (Qualitative Analysis Only) 2025 & 2033
- Figure 21: Asia Pacific Gas Market Revenue Share (%), by Capacity (Qualitative Analysis Only) 2025 & 2033
- Figure 22: Asia Pacific Gas Market Revenue (billion), by y End-User 2025 & 2033
- Figure 23: Asia Pacific Gas Market Revenue Share (%), by y End-User 2025 & 2033
- Figure 24: Asia Pacific Gas Market Revenue (billion), by Country 2025 & 2033
- Figure 25: Asia Pacific Gas Market Revenue Share (%), by Country 2025 & 2033
- Figure 26: South America Gas Market Revenue (billion), by Technology 2025 & 2033
- Figure 27: South America Gas Market Revenue Share (%), by Technology 2025 & 2033
- Figure 28: South America Gas Market Revenue (billion), by Capacity (Qualitative Analysis Only) 2025 & 2033
- Figure 29: South America Gas Market Revenue Share (%), by Capacity (Qualitative Analysis Only) 2025 & 2033
- Figure 30: South America Gas Market Revenue (billion), by y End-User 2025 & 2033
- Figure 31: South America Gas Market Revenue Share (%), by y End-User 2025 & 2033
- Figure 32: South America Gas Market Revenue (billion), by Country 2025 & 2033
- Figure 33: South America Gas Market Revenue Share (%), by Country 2025 & 2033
- Figure 34: Middle East and Africa Gas Market Revenue (billion), by Technology 2025 & 2033
- Figure 35: Middle East and Africa Gas Market Revenue Share (%), by Technology 2025 & 2033
- Figure 36: Middle East and Africa Gas Market Revenue (billion), by Capacity (Qualitative Analysis Only) 2025 & 2033
- Figure 37: Middle East and Africa Gas Market Revenue Share (%), by Capacity (Qualitative Analysis Only) 2025 & 2033
- Figure 38: Middle East and Africa Gas Market Revenue (billion), by y End-User 2025 & 2033
- Figure 39: Middle East and Africa Gas Market Revenue Share (%), by y End-User 2025 & 2033
- Figure 40: Middle East and Africa Gas Market Revenue (billion), by Country 2025 & 2033
- Figure 41: Middle East and Africa Gas Market Revenue Share (%), by Country 2025 & 2033
List of Tables
- Table 1: Global Gas Market Revenue billion Forecast, by Technology 2020 & 2033
- Table 2: Global Gas Market Revenue billion Forecast, by Capacity (Qualitative Analysis Only) 2020 & 2033
- Table 3: Global Gas Market Revenue billion Forecast, by y End-User 2020 & 2033
- Table 4: Global Gas Market Revenue billion Forecast, by Region 2020 & 2033
- Table 5: Global Gas Market Revenue billion Forecast, by Technology 2020 & 2033
- Table 6: Global Gas Market Revenue billion Forecast, by Capacity (Qualitative Analysis Only) 2020 & 2033
- Table 7: Global Gas Market Revenue billion Forecast, by y End-User 2020 & 2033
- Table 8: Global Gas Market Revenue billion Forecast, by Country 2020 & 2033
- Table 9: Global Gas Market Revenue billion Forecast, by Technology 2020 & 2033
- Table 10: Global Gas Market Revenue billion Forecast, by Capacity (Qualitative Analysis Only) 2020 & 2033
- Table 11: Global Gas Market Revenue billion Forecast, by y End-User 2020 & 2033
- Table 12: Global Gas Market Revenue billion Forecast, by Country 2020 & 2033
- Table 13: Global Gas Market Revenue billion Forecast, by Technology 2020 & 2033
- Table 14: Global Gas Market Revenue billion Forecast, by Capacity (Qualitative Analysis Only) 2020 & 2033
- Table 15: Global Gas Market Revenue billion Forecast, by y End-User 2020 & 2033
- Table 16: Global Gas Market Revenue billion Forecast, by Country 2020 & 2033
- Table 17: Global Gas Market Revenue billion Forecast, by Technology 2020 & 2033
- Table 18: Global Gas Market Revenue billion Forecast, by Capacity (Qualitative Analysis Only) 2020 & 2033
- Table 19: Global Gas Market Revenue billion Forecast, by y End-User 2020 & 2033
- Table 20: Global Gas Market Revenue billion Forecast, by Country 2020 & 2033
- Table 21: Global Gas Market Revenue billion Forecast, by Technology 2020 & 2033
- Table 22: Global Gas Market Revenue billion Forecast, by Capacity (Qualitative Analysis Only) 2020 & 2033
- Table 23: Global Gas Market Revenue billion Forecast, by y End-User 2020 & 2033
- Table 24: Global Gas Market Revenue billion Forecast, by Country 2020 & 2033
Frequently Asked Questions
1. What is the projected Compound Annual Growth Rate (CAGR) of the Gas Market?
The projected CAGR is approximately 6.4%.
2. Which companies are prominent players in the Gas Market?
Key companies in the market include MAN Energy Solutions, GRT Gaz SA, Sunfire GmbH, MicroPyros BioEnerTec GmbH, Ineratec GmbH, AquahydreX Inc *List Not Exhaustive, Siemens Energy AG, Electrochaea GmbH, Hitachi Zosen Inova AG, Sempra Energy, Nel ASA.
3. What are the main segments of the Gas Market?
The market segments include Technology, Capacity (Qualitative Analysis Only), y End-User.
4. Can you provide details about the market size?
The market size is estimated to be USD 78.9 billion as of 2022.
5. What are some drivers contributing to market growth?
4.; Growing Demand to Develop the Natural Gas Infrastructure4.; Increase in Offshore Oil and Gas Exploration and Production (E&P) Activities.
6. What are the notable trends driving market growth?
Power-to-hydrogen to be the Fastest-growing Segment.
7. Are there any restraints impacting market growth?
4.; High Volatility of Oil and Gas Prices.
8. Can you provide examples of recent developments in the market?
June 2022- The United States Department of Energy announced a USD 504.4 million investment to finance Advanced Clean Energy Storage, a clean hydrogen and energy storage facility capable of providing long-term energy storage. Located in Delta, Utah, the facility will combine 220 megawatts of alkaline electrolysis with two 4.5-million-barrel salt caverns to store clean hydrogen. When operational, the projects will capture excess renewable energy, store it as hydrogen, and deploy it as fuel for the Intermountain Power Agency's (IPA) Renewed Project-a hydrogen-capable gas turbine combined cycle power plant that intends to be fueled by 100% clean hydrogen by 2045 incrementally.
9. What pricing options are available for accessing the report?
Pricing options include single-user, multi-user, and enterprise licenses priced at USD 4750, USD 5250, and USD 8750 respectively.
10. Is the market size provided in terms of value or volume?
The market size is provided in terms of value, measured in billion.
11. Are there any specific market keywords associated with the report?
Yes, the market keyword associated with the report is "Gas Market," which aids in identifying and referencing the specific market segment covered.
12. How do I determine which pricing option suits my needs best?
The pricing options vary based on user requirements and access needs. Individual users may opt for single-user licenses, while businesses requiring broader access may choose multi-user or enterprise licenses for cost-effective access to the report.
13. Are there any additional resources or data provided in the Gas Market report?
While the report offers comprehensive insights, it's advisable to review the specific contents or supplementary materials provided to ascertain if additional resources or data are available.
14. How can I stay updated on further developments or reports in the Gas Market?
To stay informed about further developments, trends, and reports in the Gas Market, consider subscribing to industry newsletters, following relevant companies and organizations, or regularly checking reputable industry news sources and publications.
Methodology
Step 1 - Identification of Relevant Samples Size from Population Database


Step 2 - Approaches for Defining Global Market Size (Value, Volume* & Price*)

Note*: In applicable scenarios
Step 3 - Data Sources
Primary Research
- Web Analytics
- Survey Reports
- Research Institute
- Latest Research Reports
- Opinion Leaders
Secondary Research
- Annual Reports
- White Paper
- Latest Press Release
- Industry Association
- Paid Database
- Investor Presentations

Step 4 - Data Triangulation
Involves using different sources of information in order to increase the validity of a study
These sources are likely to be stakeholders in a program - participants, other researchers, program staff, other community members, and so on.
Then we put all data in single framework & apply various statistical tools to find out the dynamic on the market.
During the analysis stage, feedback from the stakeholder groups would be compared to determine areas of agreement as well as areas of divergence