

Key Insights
The global gas generator market, valued at approximately $28.5 billion in 2025, is projected for robust expansion, with a Compound Annual Growth Rate (CAGR) of 4.1% from 2025 to 2033. Key growth drivers include increasing industrialization and urbanization in emerging economies, alongside rising demand for reliable power backup in commercial and residential sectors, particularly in regions with unstable grid infrastructure. Stringent emission regulations are also fostering the adoption of cleaner, more efficient gas generator technologies. The industrial segment is expected to lead end-user demand, followed by commercial and residential sectors. Within power ratings, the 75-375 kVA segment is anticipated for significant growth due to its versatility. Challenges include fluctuating gas prices, greenhouse gas emissions, and competition from renewable energy sources. Key players like Caterpillar, Cummins, and Generac are innovating to meet evolving demands. North America and Europe currently lead, with Asia Pacific poised for substantial regional growth.
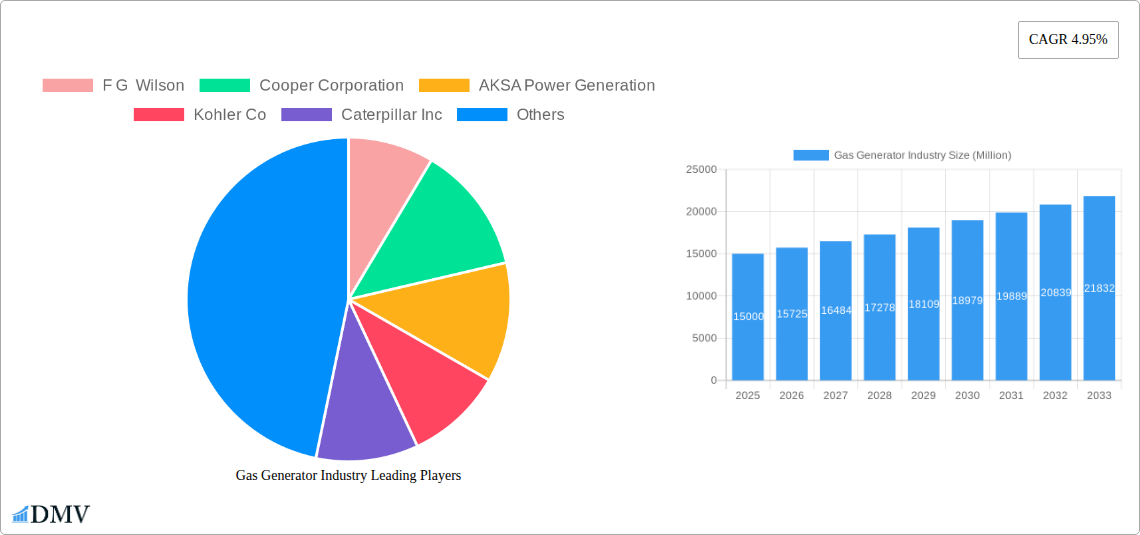
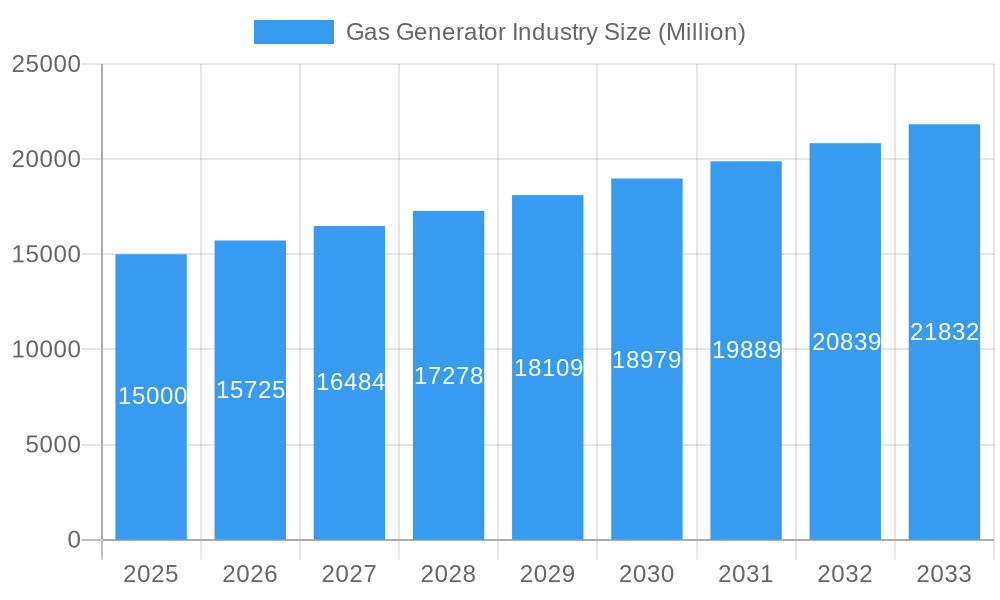
Gas Generator Industry Market Size (In Billion)
The forecast period (2025-2033) indicates a sustained increase in gas generator demand, driven by infrastructure development, growing energy needs in developing nations, and the adoption of distributed generation. While regulatory and economic uncertainties may present temporary challenges, the long-term outlook is positive. A shift towards advanced, efficient, and low-emission gas generator technologies is evident, driving premium pricing and profitability. The Asia Pacific region is expected to exhibit significant growth, surpassing mature markets, due to infrastructure development and urbanization. Continuous monitoring of global energy policies and economic indicators is vital for accurate forecasting.
Gas Generator Industry Company Market Share
Gas Generator Industry Market Report: 2019-2033
This comprehensive report provides a detailed analysis of the global gas generator industry, covering market size, growth trends, key players, and future prospects. The report utilizes a robust methodology, incorporating historical data (2019-2024), a base year (2025), and a forecast period (2025-2033) to deliver insightful projections and actionable strategies. The market is valued at xx Million in 2025 and is projected to reach xx Million by 2033, exhibiting a CAGR of xx%.
Gas Generator Industry Market Composition & Trends
The global gas generator market is moderately fragmented, with several major players competing for market share. Key companies include F G Wilson, Cooper Corporation, AKSA Power Generation, Kohler Co, Caterpillar Inc, Cummins Inc, General Electric Company, Generac Holdings Inc, MTU America Inc, Mitsubishi Heavy Industries Ltd, and many others. Market share distribution among these players is dynamic, with Cummins and Caterpillar holding significant positions in specific segments. Innovation is primarily driven by increasing demand for efficient and environmentally friendly power solutions, prompting the development of advanced gas generator technologies with improved emissions control and fuel efficiency. Regulatory landscapes, varying across regions, significantly impact the market with stringent emission norms influencing technological advancements and market entry strategies. Substitute products such as solar and wind power present competitive challenges, especially in certain end-user segments. The market has also witnessed several mergers and acquisitions (M&A) activities, primarily focused on expanding market reach and technological capabilities. The total M&A deal value in the last five years is estimated at xx Million. End-user profiles demonstrate strong demand across industrial, commercial, and residential sectors, with the industrial sector holding the largest market share.
- Market Concentration: Moderately fragmented.
- Innovation Catalysts: Demand for efficient and eco-friendly solutions, stringent emission norms.
- Regulatory Landscape: Varies significantly across regions.
- Substitute Products: Solar, wind power.
- End-User Profiles: Industrial, Commercial, Residential.
- M&A Activities: Significant, driven by expansion and technological acquisition. Estimated deal value (2019-2024): xx Million.
Gas Generator Industry Evolution
The gas generator industry has witnessed consistent growth over the historical period (2019-2024), driven by rising energy demands, expanding infrastructure development across various sectors, and increasing concerns over power outages. Technological advancements, including the integration of advanced control systems, improved fuel efficiency, and enhanced emissions reduction technologies have been pivotal. Consumer demands are shifting towards more reliable, efficient, and environmentally friendly solutions, favoring advanced gas generators with lower emissions and higher fuel efficiency. The growth rate has been estimated at xx% annually from 2019 to 2024. Adoption of natural gas generators in mission-critical applications is increasing significantly due to their consistent performance, high reliability, and rapid response capabilities. The forecast period (2025-2033) projects continued growth, driven by factors such as increasing urbanization, industrialization, and investments in renewable energy integration. Specific adoption metrics suggest increased penetration in remote areas and regions with unreliable grid infrastructure.
Leading Regions, Countries, or Segments in Gas Generator Industry
The North American region currently dominates the gas generator market, followed by Asia-Pacific and Europe. Within these regions, specific countries such as the United States, China, and Germany exhibit high market penetration, fueled by industrial expansion, robust infrastructure investments, and a growing need for backup power.
Dominant End-User Segment: Industrial. Key drivers include the critical role of uninterrupted power supply in manufacturing and processing.
Dominant Power Rating Segment: 75-375 kVA. This range caters to the needs of a wider range of commercial and industrial applications.
Key Drivers:
- Robust industrial growth in key regions.
- Increasing investments in infrastructure development.
- High demand for reliable backup power.
- Favorable regulatory environment in some regions.
The dominance of specific segments and regions are attributed to factors like government support for infrastructure projects, high industrial activity, and the presence of well-established distribution networks. The continuous growth in these regions is further strengthened by the increasing adoption of gas generators in both on-grid and off-grid applications, driven by stringent power reliability requirements and advancements in generator technology.
Gas Generator Industry Product Innovations
Recent innovations focus on enhancing efficiency, reducing emissions, and improving overall performance. Advanced control systems allow for optimized fuel consumption and load management. The integration of digital technologies enables remote monitoring and predictive maintenance, minimizing downtime. New designs emphasize compact footprints and quiet operation, making them suitable for diverse applications. These innovations cater to the rising demand for reliable, efficient, and environmentally responsible power solutions.
Propelling Factors for Gas Generator Industry Growth
Several factors are driving the expansion of the gas generator industry. Technological advancements, such as improved fuel efficiency and emission reduction technologies, are key enablers. Economic growth, especially in developing economies, fuels the demand for reliable power across various sectors. Favorable government policies and regulations promoting energy diversification and grid stability contribute significantly to market growth. For example, tax incentives and subsidies for the adoption of efficient gas generators in certain countries are boosting market penetration.
Obstacles in the Gas Generator Industry Market
The gas generator market faces several challenges, including volatile fuel prices that directly impact operational costs. Stringent environmental regulations require continuous technological advancements to meet emission standards, incurring additional investment costs. Supply chain disruptions, particularly in the sourcing of critical components, can impact production and delivery timelines. Intense competition among established manufacturers and new entrants puts pressure on pricing and profitability.
Future Opportunities in Gas Generator Industry
The future of the gas generator industry presents significant growth opportunities, particularly in emerging markets with expanding infrastructure needs. The integration of renewable energy sources with gas generators creates hybrid systems that offer enhanced reliability and sustainability. Advances in digital technologies, such as AI-powered predictive maintenance, improve operational efficiency and reduce downtime. The adoption of fuel cell technology, combined with natural gas, promises to further enhance efficiency and reduce emissions.
Major Players in the Gas Generator Industry Ecosystem
- F G Wilson
- Cooper Corporation
- AKSA Power Generation
- Kohler Co
- Caterpillar Inc
- Cummins Inc
- General Electric Company
- Generac Holdings Inc
- MTU America Inc
- Mitsubishi Heavy Industries Ltd
Key Developments in Gas Generator Industry
- February 2023: Cummins Inc. launched 175kW and 200kW natural gas generator sets, highlighting its commitment to sustainable technologies.
- July 2022: Sterling Generators partnered with Moteurs Baudouin, expanding its product portfolio and market reach.
- January 2022: Caterpillar Inc. unveiled the Cat G3516 Fast Reaction generator set, enhancing its natural gas power solutions.
Strategic Gas Generator Industry Market Forecast
The gas generator market is poised for sustained growth, driven by continuous technological advancements, increasing demand for reliable power solutions, and the growing adoption of sustainable energy practices. The focus on improving fuel efficiency, reducing emissions, and enhancing the integration of renewable sources will shape the market's trajectory. The ongoing development of more efficient and environmentally friendly gas generators, combined with favorable government policies, will continue to propel the market's expansion in the coming years.
Gas Generator Industry Segmentation
-
1. Power Rating
- 1.1. Less than 75 kVA
- 1.2. 75-375 kVA
- 1.3. Above 375 kVA
-
2. End-User
- 2.1. Industrial
- 2.2. Commercial
- 2.3. Residential
Gas Generator Industry Segmentation By Geography
-
1. North America
- 1.1. United States
- 1.2. Canada
- 1.3. Rest of North America
-
2. Europe
- 2.1. Germany
- 2.2. France
- 2.3. United Kingdom
- 2.4. Rest of Europe
-
3. Asia Pacific
- 3.1. China
- 3.2. India
- 3.3. Japan
- 3.4. South Korea
- 3.5. Rest of Asia Pacific
-
4. South America
- 4.1. Brazil
- 4.2. Argentina
- 4.3. Rest of South America
-
5. Middle East and Africa
- 5.1. Saudi Arabia
- 5.2. United Arab Emirates
- 5.3. South Africa
- 5.4. Rest of Middle East and Africa
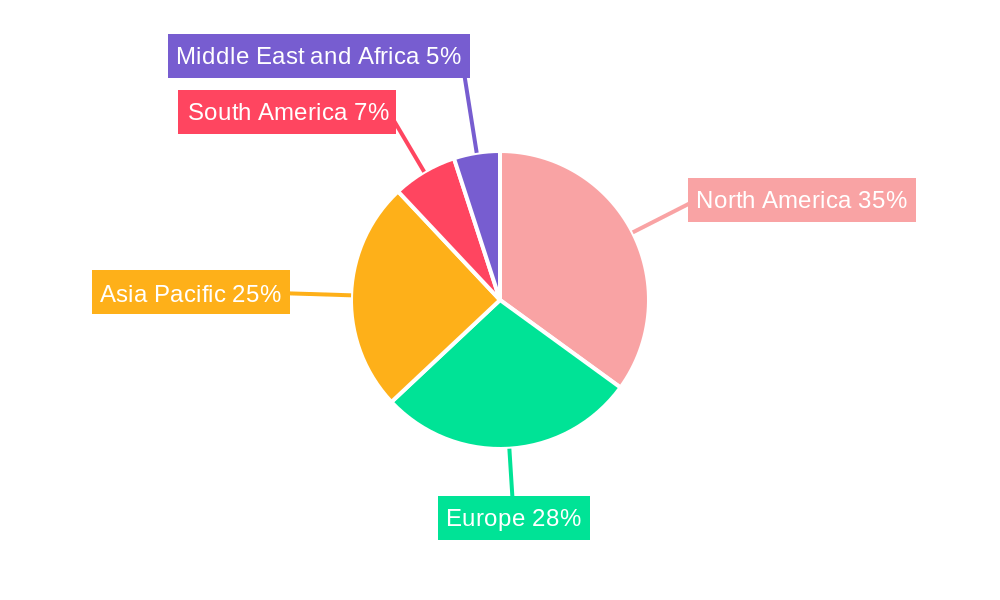
Gas Generator Industry Regional Market Share
Geographic Coverage of Gas Generator Industry
Gas Generator Industry REPORT HIGHLIGHTS
| Aspects | Details |
|---|---|
| Study Period | 2020-2034 |
| Base Year | 2025 |
| Estimated Year | 2026 |
| Forecast Period | 2026-2034 |
| Historical Period | 2020-2025 |
| Growth Rate | CAGR of 4.1% from 2020-2034 |
| Segmentation |
|
Table of Contents
- 1. Introduction
- 1.1. Research Scope
- 1.2. Market Segmentation
- 1.3. Research Objective
- 1.4. Definitions and Assumptions
- 2. Executive Summary
- 2.1. Market Snapshot
- 3. Market Dynamics
- 3.1. Market Drivers
- 3.2. Market Restrains
- 3.3. Market Trends
- 3.4. Market Opportunities
- 4. Market Factor Analysis
- 4.1. Porters Five Forces
- 4.1.1. Bargaining Power of Suppliers
- 4.1.2. Bargaining Power of Buyers
- 4.1.3. Threat of New Entrants
- 4.1.4. Threat of Substitutes
- 4.1.5. Competitive Rivalry
- 4.2. PESTEL analysis
- 4.3. BCG Analysis
- 4.3.1. Stars (High Growth, High Market Share)
- 4.3.2. Cash Cows (Low Growth, High Market Share)
- 4.3.3. Question Mark (High Growth, Low Market Share)
- 4.3.4. Dogs (Low Growth, Low Market Share)
- 4.4. Ansoff Matrix Analysis
- 4.5. Supply Chain Analysis
- 4.6. Regulatory Landscape
- 4.7. Current Market Potential and Opportunity Assessment (TAM–SAM–SOM Framework)
- 4.8. DMV Analyst Note
- 4.1. Porters Five Forces
- 5. Market Analysis, Insights and Forecast 2021-2033
- 5.1. Market Analysis, Insights and Forecast - by Power Rating
- 5.1.1. Less than 75 kVA
- 5.1.2. 75-375 kVA
- 5.1.3. Above 375 kVA
- 5.2. Market Analysis, Insights and Forecast - by End-User
- 5.2.1. Industrial
- 5.2.2. Commercial
- 5.2.3. Residential
- 5.3. Market Analysis, Insights and Forecast - by Region
- 5.3.1. North America
- 5.3.2. Europe
- 5.3.3. Asia Pacific
- 5.3.4. South America
- 5.3.5. Middle East and Africa
- 5.1. Market Analysis, Insights and Forecast - by Power Rating
- 6. Global Gas Generator Industry Analysis, Insights and Forecast, 2021-2033
- 6.1. Market Analysis, Insights and Forecast - by Power Rating
- 6.1.1. Less than 75 kVA
- 6.1.2. 75-375 kVA
- 6.1.3. Above 375 kVA
- 6.2. Market Analysis, Insights and Forecast - by End-User
- 6.2.1. Industrial
- 6.2.2. Commercial
- 6.2.3. Residential
- 6.1. Market Analysis, Insights and Forecast - by Power Rating
- 7. North America Gas Generator Industry Analysis, Insights and Forecast, 2020-2032
- 7.1. Market Analysis, Insights and Forecast - by Power Rating
- 7.1.1. Less than 75 kVA
- 7.1.2. 75-375 kVA
- 7.1.3. Above 375 kVA
- 7.2. Market Analysis, Insights and Forecast - by End-User
- 7.2.1. Industrial
- 7.2.2. Commercial
- 7.2.3. Residential
- 7.1. Market Analysis, Insights and Forecast - by Power Rating
- 8. Europe Gas Generator Industry Analysis, Insights and Forecast, 2020-2032
- 8.1. Market Analysis, Insights and Forecast - by Power Rating
- 8.1.1. Less than 75 kVA
- 8.1.2. 75-375 kVA
- 8.1.3. Above 375 kVA
- 8.2. Market Analysis, Insights and Forecast - by End-User
- 8.2.1. Industrial
- 8.2.2. Commercial
- 8.2.3. Residential
- 8.1. Market Analysis, Insights and Forecast - by Power Rating
- 9. Asia Pacific Gas Generator Industry Analysis, Insights and Forecast, 2020-2032
- 9.1. Market Analysis, Insights and Forecast - by Power Rating
- 9.1.1. Less than 75 kVA
- 9.1.2. 75-375 kVA
- 9.1.3. Above 375 kVA
- 9.2. Market Analysis, Insights and Forecast - by End-User
- 9.2.1. Industrial
- 9.2.2. Commercial
- 9.2.3. Residential
- 9.1. Market Analysis, Insights and Forecast - by Power Rating
- 10. South America Gas Generator Industry Analysis, Insights and Forecast, 2020-2032
- 10.1. Market Analysis, Insights and Forecast - by Power Rating
- 10.1.1. Less than 75 kVA
- 10.1.2. 75-375 kVA
- 10.1.3. Above 375 kVA
- 10.2. Market Analysis, Insights and Forecast - by End-User
- 10.2.1. Industrial
- 10.2.2. Commercial
- 10.2.3. Residential
- 10.1. Market Analysis, Insights and Forecast - by Power Rating
- 11. Middle East and Africa Gas Generator Industry Analysis, Insights and Forecast, 2020-2032
- 11.1. Market Analysis, Insights and Forecast - by Power Rating
- 11.1.1. Less than 75 kVA
- 11.1.2. 75-375 kVA
- 11.1.3. Above 375 kVA
- 11.2. Market Analysis, Insights and Forecast - by End-User
- 11.2.1. Industrial
- 11.2.2. Commercial
- 11.2.3. Residential
- 11.1. Market Analysis, Insights and Forecast - by Power Rating
- 12. Competitive Analysis
- 12.1. Company Profiles
- 12.1.1 F G Wilson
- 12.1.1.1. Company Overview
- 12.1.1.2. Products
- 12.1.1.3. Company Financials
- 12.1.1.4. SWOT Analysis
- 12.1.2 Cooper Corporation
- 12.1.2.1. Company Overview
- 12.1.2.2. Products
- 12.1.2.3. Company Financials
- 12.1.2.4. SWOT Analysis
- 12.1.3 AKSA Power Generation
- 12.1.3.1. Company Overview
- 12.1.3.2. Products
- 12.1.3.3. Company Financials
- 12.1.3.4. SWOT Analysis
- 12.1.4 Kohler Co
- 12.1.4.1. Company Overview
- 12.1.4.2. Products
- 12.1.4.3. Company Financials
- 12.1.4.4. SWOT Analysis
- 12.1.5 Caterpillar Inc
- 12.1.5.1. Company Overview
- 12.1.5.2. Products
- 12.1.5.3. Company Financials
- 12.1.5.4. SWOT Analysis
- 12.1.6 Cummins Inc
- 12.1.6.1. Company Overview
- 12.1.6.2. Products
- 12.1.6.3. Company Financials
- 12.1.6.4. SWOT Analysis
- 12.1.7 General Electric Company
- 12.1.7.1. Company Overview
- 12.1.7.2. Products
- 12.1.7.3. Company Financials
- 12.1.7.4. SWOT Analysis
- 12.1.8 Generac Holdings Inc
- 12.1.8.1. Company Overview
- 12.1.8.2. Products
- 12.1.8.3. Company Financials
- 12.1.8.4. SWOT Analysis
- 12.1.9 MTU America Inc *List Not Exhaustive
- 12.1.9.1. Company Overview
- 12.1.9.2. Products
- 12.1.9.3. Company Financials
- 12.1.9.4. SWOT Analysis
- 12.1.10 Mitsubishi Heavy Industries Ltd
- 12.1.10.1. Company Overview
- 12.1.10.2. Products
- 12.1.10.3. Company Financials
- 12.1.10.4. SWOT Analysis
- 12.1.1 F G Wilson
- 12.2. Market Entropy
- 12.2.1 Company's Key Areas Served
- 12.2.2 Recent Developments
- 12.3. Company Market Share Analysis 2025
- 12.3.1 Top 5 Companies Market Share Analysis
- 12.3.2 Top 3 Companies Market Share Analysis
- 12.4. List of Potential Customers
- 13. Research Methodology
List of Figures
- Figure 1: Global Gas Generator Industry Revenue Breakdown (billion, %) by Region 2025 & 2033
- Figure 2: Global Gas Generator Industry Volume Breakdown (K Unit, %) by Region 2025 & 2033
- Figure 3: North America Gas Generator Industry Revenue (billion), by Power Rating 2025 & 2033
- Figure 4: North America Gas Generator Industry Volume (K Unit), by Power Rating 2025 & 2033
- Figure 5: North America Gas Generator Industry Revenue Share (%), by Power Rating 2025 & 2033
- Figure 6: North America Gas Generator Industry Volume Share (%), by Power Rating 2025 & 2033
- Figure 7: North America Gas Generator Industry Revenue (billion), by End-User 2025 & 2033
- Figure 8: North America Gas Generator Industry Volume (K Unit), by End-User 2025 & 2033
- Figure 9: North America Gas Generator Industry Revenue Share (%), by End-User 2025 & 2033
- Figure 10: North America Gas Generator Industry Volume Share (%), by End-User 2025 & 2033
- Figure 11: North America Gas Generator Industry Revenue (billion), by Country 2025 & 2033
- Figure 12: North America Gas Generator Industry Volume (K Unit), by Country 2025 & 2033
- Figure 13: North America Gas Generator Industry Revenue Share (%), by Country 2025 & 2033
- Figure 14: North America Gas Generator Industry Volume Share (%), by Country 2025 & 2033
- Figure 15: Europe Gas Generator Industry Revenue (billion), by Power Rating 2025 & 2033
- Figure 16: Europe Gas Generator Industry Volume (K Unit), by Power Rating 2025 & 2033
- Figure 17: Europe Gas Generator Industry Revenue Share (%), by Power Rating 2025 & 2033
- Figure 18: Europe Gas Generator Industry Volume Share (%), by Power Rating 2025 & 2033
- Figure 19: Europe Gas Generator Industry Revenue (billion), by End-User 2025 & 2033
- Figure 20: Europe Gas Generator Industry Volume (K Unit), by End-User 2025 & 2033
- Figure 21: Europe Gas Generator Industry Revenue Share (%), by End-User 2025 & 2033
- Figure 22: Europe Gas Generator Industry Volume Share (%), by End-User 2025 & 2033
- Figure 23: Europe Gas Generator Industry Revenue (billion), by Country 2025 & 2033
- Figure 24: Europe Gas Generator Industry Volume (K Unit), by Country 2025 & 2033
- Figure 25: Europe Gas Generator Industry Revenue Share (%), by Country 2025 & 2033
- Figure 26: Europe Gas Generator Industry Volume Share (%), by Country 2025 & 2033
- Figure 27: Asia Pacific Gas Generator Industry Revenue (billion), by Power Rating 2025 & 2033
- Figure 28: Asia Pacific Gas Generator Industry Volume (K Unit), by Power Rating 2025 & 2033
- Figure 29: Asia Pacific Gas Generator Industry Revenue Share (%), by Power Rating 2025 & 2033
- Figure 30: Asia Pacific Gas Generator Industry Volume Share (%), by Power Rating 2025 & 2033
- Figure 31: Asia Pacific Gas Generator Industry Revenue (billion), by End-User 2025 & 2033
- Figure 32: Asia Pacific Gas Generator Industry Volume (K Unit), by End-User 2025 & 2033
- Figure 33: Asia Pacific Gas Generator Industry Revenue Share (%), by End-User 2025 & 2033
- Figure 34: Asia Pacific Gas Generator Industry Volume Share (%), by End-User 2025 & 2033
- Figure 35: Asia Pacific Gas Generator Industry Revenue (billion), by Country 2025 & 2033
- Figure 36: Asia Pacific Gas Generator Industry Volume (K Unit), by Country 2025 & 2033
- Figure 37: Asia Pacific Gas Generator Industry Revenue Share (%), by Country 2025 & 2033
- Figure 38: Asia Pacific Gas Generator Industry Volume Share (%), by Country 2025 & 2033
- Figure 39: South America Gas Generator Industry Revenue (billion), by Power Rating 2025 & 2033
- Figure 40: South America Gas Generator Industry Volume (K Unit), by Power Rating 2025 & 2033
- Figure 41: South America Gas Generator Industry Revenue Share (%), by Power Rating 2025 & 2033
- Figure 42: South America Gas Generator Industry Volume Share (%), by Power Rating 2025 & 2033
- Figure 43: South America Gas Generator Industry Revenue (billion), by End-User 2025 & 2033
- Figure 44: South America Gas Generator Industry Volume (K Unit), by End-User 2025 & 2033
- Figure 45: South America Gas Generator Industry Revenue Share (%), by End-User 2025 & 2033
- Figure 46: South America Gas Generator Industry Volume Share (%), by End-User 2025 & 2033
- Figure 47: South America Gas Generator Industry Revenue (billion), by Country 2025 & 2033
- Figure 48: South America Gas Generator Industry Volume (K Unit), by Country 2025 & 2033
- Figure 49: South America Gas Generator Industry Revenue Share (%), by Country 2025 & 2033
- Figure 50: South America Gas Generator Industry Volume Share (%), by Country 2025 & 2033
- Figure 51: Middle East and Africa Gas Generator Industry Revenue (billion), by Power Rating 2025 & 2033
- Figure 52: Middle East and Africa Gas Generator Industry Volume (K Unit), by Power Rating 2025 & 2033
- Figure 53: Middle East and Africa Gas Generator Industry Revenue Share (%), by Power Rating 2025 & 2033
- Figure 54: Middle East and Africa Gas Generator Industry Volume Share (%), by Power Rating 2025 & 2033
- Figure 55: Middle East and Africa Gas Generator Industry Revenue (billion), by End-User 2025 & 2033
- Figure 56: Middle East and Africa Gas Generator Industry Volume (K Unit), by End-User 2025 & 2033
- Figure 57: Middle East and Africa Gas Generator Industry Revenue Share (%), by End-User 2025 & 2033
- Figure 58: Middle East and Africa Gas Generator Industry Volume Share (%), by End-User 2025 & 2033
- Figure 59: Middle East and Africa Gas Generator Industry Revenue (billion), by Country 2025 & 2033
- Figure 60: Middle East and Africa Gas Generator Industry Volume (K Unit), by Country 2025 & 2033
- Figure 61: Middle East and Africa Gas Generator Industry Revenue Share (%), by Country 2025 & 2033
- Figure 62: Middle East and Africa Gas Generator Industry Volume Share (%), by Country 2025 & 2033
List of Tables
- Table 1: Global Gas Generator Industry Revenue billion Forecast, by Power Rating 2020 & 2033
- Table 2: Global Gas Generator Industry Volume K Unit Forecast, by Power Rating 2020 & 2033
- Table 3: Global Gas Generator Industry Revenue billion Forecast, by End-User 2020 & 2033
- Table 4: Global Gas Generator Industry Volume K Unit Forecast, by End-User 2020 & 2033
- Table 5: Global Gas Generator Industry Revenue billion Forecast, by Region 2020 & 2033
- Table 6: Global Gas Generator Industry Volume K Unit Forecast, by Region 2020 & 2033
- Table 7: Global Gas Generator Industry Revenue billion Forecast, by Power Rating 2020 & 2033
- Table 8: Global Gas Generator Industry Volume K Unit Forecast, by Power Rating 2020 & 2033
- Table 9: Global Gas Generator Industry Revenue billion Forecast, by End-User 2020 & 2033
- Table 10: Global Gas Generator Industry Volume K Unit Forecast, by End-User 2020 & 2033
- Table 11: Global Gas Generator Industry Revenue billion Forecast, by Country 2020 & 2033
- Table 12: Global Gas Generator Industry Volume K Unit Forecast, by Country 2020 & 2033
- Table 13: United States Gas Generator Industry Revenue (billion) Forecast, by Application 2020 & 2033
- Table 14: United States Gas Generator Industry Volume (K Unit) Forecast, by Application 2020 & 2033
- Table 15: Canada Gas Generator Industry Revenue (billion) Forecast, by Application 2020 & 2033
- Table 16: Canada Gas Generator Industry Volume (K Unit) Forecast, by Application 2020 & 2033
- Table 17: Rest of North America Gas Generator Industry Revenue (billion) Forecast, by Application 2020 & 2033
- Table 18: Rest of North America Gas Generator Industry Volume (K Unit) Forecast, by Application 2020 & 2033
- Table 19: Global Gas Generator Industry Revenue billion Forecast, by Power Rating 2020 & 2033
- Table 20: Global Gas Generator Industry Volume K Unit Forecast, by Power Rating 2020 & 2033
- Table 21: Global Gas Generator Industry Revenue billion Forecast, by End-User 2020 & 2033
- Table 22: Global Gas Generator Industry Volume K Unit Forecast, by End-User 2020 & 2033
- Table 23: Global Gas Generator Industry Revenue billion Forecast, by Country 2020 & 2033
- Table 24: Global Gas Generator Industry Volume K Unit Forecast, by Country 2020 & 2033
- Table 25: Germany Gas Generator Industry Revenue (billion) Forecast, by Application 2020 & 2033
- Table 26: Germany Gas Generator Industry Volume (K Unit) Forecast, by Application 2020 & 2033
- Table 27: France Gas Generator Industry Revenue (billion) Forecast, by Application 2020 & 2033
- Table 28: France Gas Generator Industry Volume (K Unit) Forecast, by Application 2020 & 2033
- Table 29: United Kingdom Gas Generator Industry Revenue (billion) Forecast, by Application 2020 & 2033
- Table 30: United Kingdom Gas Generator Industry Volume (K Unit) Forecast, by Application 2020 & 2033
- Table 31: Rest of Europe Gas Generator Industry Revenue (billion) Forecast, by Application 2020 & 2033
- Table 32: Rest of Europe Gas Generator Industry Volume (K Unit) Forecast, by Application 2020 & 2033
- Table 33: Global Gas Generator Industry Revenue billion Forecast, by Power Rating 2020 & 2033
- Table 34: Global Gas Generator Industry Volume K Unit Forecast, by Power Rating 2020 & 2033
- Table 35: Global Gas Generator Industry Revenue billion Forecast, by End-User 2020 & 2033
- Table 36: Global Gas Generator Industry Volume K Unit Forecast, by End-User 2020 & 2033
- Table 37: Global Gas Generator Industry Revenue billion Forecast, by Country 2020 & 2033
- Table 38: Global Gas Generator Industry Volume K Unit Forecast, by Country 2020 & 2033
- Table 39: China Gas Generator Industry Revenue (billion) Forecast, by Application 2020 & 2033
- Table 40: China Gas Generator Industry Volume (K Unit) Forecast, by Application 2020 & 2033
- Table 41: India Gas Generator Industry Revenue (billion) Forecast, by Application 2020 & 2033
- Table 42: India Gas Generator Industry Volume (K Unit) Forecast, by Application 2020 & 2033
- Table 43: Japan Gas Generator Industry Revenue (billion) Forecast, by Application 2020 & 2033
- Table 44: Japan Gas Generator Industry Volume (K Unit) Forecast, by Application 2020 & 2033
- Table 45: South Korea Gas Generator Industry Revenue (billion) Forecast, by Application 2020 & 2033
- Table 46: South Korea Gas Generator Industry Volume (K Unit) Forecast, by Application 2020 & 2033
- Table 47: Rest of Asia Pacific Gas Generator Industry Revenue (billion) Forecast, by Application 2020 & 2033
- Table 48: Rest of Asia Pacific Gas Generator Industry Volume (K Unit) Forecast, by Application 2020 & 2033
- Table 49: Global Gas Generator Industry Revenue billion Forecast, by Power Rating 2020 & 2033
- Table 50: Global Gas Generator Industry Volume K Unit Forecast, by Power Rating 2020 & 2033
- Table 51: Global Gas Generator Industry Revenue billion Forecast, by End-User 2020 & 2033
- Table 52: Global Gas Generator Industry Volume K Unit Forecast, by End-User 2020 & 2033
- Table 53: Global Gas Generator Industry Revenue billion Forecast, by Country 2020 & 2033
- Table 54: Global Gas Generator Industry Volume K Unit Forecast, by Country 2020 & 2033
- Table 55: Brazil Gas Generator Industry Revenue (billion) Forecast, by Application 2020 & 2033
- Table 56: Brazil Gas Generator Industry Volume (K Unit) Forecast, by Application 2020 & 2033
- Table 57: Argentina Gas Generator Industry Revenue (billion) Forecast, by Application 2020 & 2033
- Table 58: Argentina Gas Generator Industry Volume (K Unit) Forecast, by Application 2020 & 2033
- Table 59: Rest of South America Gas Generator Industry Revenue (billion) Forecast, by Application 2020 & 2033
- Table 60: Rest of South America Gas Generator Industry Volume (K Unit) Forecast, by Application 2020 & 2033
- Table 61: Global Gas Generator Industry Revenue billion Forecast, by Power Rating 2020 & 2033
- Table 62: Global Gas Generator Industry Volume K Unit Forecast, by Power Rating 2020 & 2033
- Table 63: Global Gas Generator Industry Revenue billion Forecast, by End-User 2020 & 2033
- Table 64: Global Gas Generator Industry Volume K Unit Forecast, by End-User 2020 & 2033
- Table 65: Global Gas Generator Industry Revenue billion Forecast, by Country 2020 & 2033
- Table 66: Global Gas Generator Industry Volume K Unit Forecast, by Country 2020 & 2033
- Table 67: Saudi Arabia Gas Generator Industry Revenue (billion) Forecast, by Application 2020 & 2033
- Table 68: Saudi Arabia Gas Generator Industry Volume (K Unit) Forecast, by Application 2020 & 2033
- Table 69: United Arab Emirates Gas Generator Industry Revenue (billion) Forecast, by Application 2020 & 2033
- Table 70: United Arab Emirates Gas Generator Industry Volume (K Unit) Forecast, by Application 2020 & 2033
- Table 71: South Africa Gas Generator Industry Revenue (billion) Forecast, by Application 2020 & 2033
- Table 72: South Africa Gas Generator Industry Volume (K Unit) Forecast, by Application 2020 & 2033
- Table 73: Rest of Middle East and Africa Gas Generator Industry Revenue (billion) Forecast, by Application 2020 & 2033
- Table 74: Rest of Middle East and Africa Gas Generator Industry Volume (K Unit) Forecast, by Application 2020 & 2033
Frequently Asked Questions
1. What is the projected Compound Annual Growth Rate (CAGR) of the Gas Generator Industry?
The projected CAGR is approximately 4.1%.
2. Which companies are prominent players in the Gas Generator Industry?
Key companies in the market include F G Wilson, Cooper Corporation, AKSA Power Generation, Kohler Co, Caterpillar Inc, Cummins Inc, General Electric Company, Generac Holdings Inc, MTU America Inc *List Not Exhaustive, Mitsubishi Heavy Industries Ltd.
3. What are the main segments of the Gas Generator Industry?
The market segments include Power Rating, End-User.
4. Can you provide details about the market size?
The market size is estimated to be USD 28.5 billion as of 2022.
5. What are some drivers contributing to market growth?
Increasing Awareness Regarding Natural Gas as a Clean and Reliable Fuel4.; Increasing Concerns Over Diesel Maintenance and Refueling Issues.
6. What are the notable trends driving market growth?
Below 75 kVA Capacity Rating to Dominate the Market.
7. Are there any restraints impacting market growth?
Lack of Gas Grid Connectivity Via Pipeline. Resulting in Hindered Fuel Supply.
8. Can you provide examples of recent developments in the market?
February 2023: Cummins Inc. announced adding 175kW and 200kW natural gas standby generator sets for North American customers. These two new generator sets are a part of Cummins's continual investment in new and sustainable technologies as part of Destination Zero, the company's strategy to reach zero emissions across its products. The new 175kW and 200kW natural gas generator sets offer customers industry-leading power density and are engineered to provide exceptional performance and consistent reliability to meet customers' power requirements.
9. What pricing options are available for accessing the report?
Pricing options include single-user, multi-user, and enterprise licenses priced at USD 4750, USD 5250, and USD 8750 respectively.
10. Is the market size provided in terms of value or volume?
The market size is provided in terms of value, measured in billion and volume, measured in K Unit.
11. Are there any specific market keywords associated with the report?
Yes, the market keyword associated with the report is "Gas Generator Industry," which aids in identifying and referencing the specific market segment covered.
12. How do I determine which pricing option suits my needs best?
The pricing options vary based on user requirements and access needs. Individual users may opt for single-user licenses, while businesses requiring broader access may choose multi-user or enterprise licenses for cost-effective access to the report.
13. Are there any additional resources or data provided in the Gas Generator Industry report?
While the report offers comprehensive insights, it's advisable to review the specific contents or supplementary materials provided to ascertain if additional resources or data are available.
14. How can I stay updated on further developments or reports in the Gas Generator Industry?
To stay informed about further developments, trends, and reports in the Gas Generator Industry, consider subscribing to industry newsletters, following relevant companies and organizations, or regularly checking reputable industry news sources and publications.
Methodology
Step 1 - Identification of Relevant Samples Size from Population Database


Step 2 - Approaches for Defining Global Market Size (Value, Volume* & Price*)

Note*: In applicable scenarios
Step 3 - Data Sources
Primary Research
- Web Analytics
- Survey Reports
- Research Institute
- Latest Research Reports
- Opinion Leaders
Secondary Research
- Annual Reports
- White Paper
- Latest Press Release
- Industry Association
- Paid Database
- Investor Presentations

Step 4 - Data Triangulation
Involves using different sources of information in order to increase the validity of a study
These sources are likely to be stakeholders in a program - participants, other researchers, program staff, other community members, and so on.
Then we put all data in single framework & apply various statistical tools to find out the dynamic on the market.
During the analysis stage, feedback from the stakeholder groups would be compared to determine areas of agreement as well as areas of divergence