

Key Insights
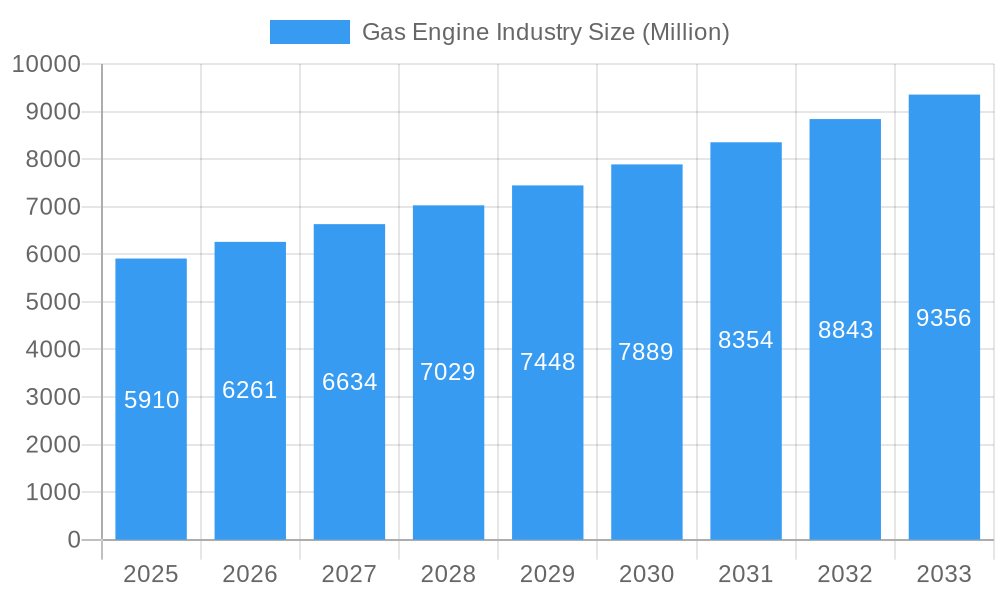
The global gas engine market, valued at $5.91 billion in 2025, is projected to experience robust growth, driven by increasing energy demands and the ongoing transition towards cleaner energy sources. A Compound Annual Growth Rate (CAGR) of 5.74% is anticipated from 2025 to 2033, indicating a significant market expansion. Key drivers include the rising adoption of gas engines in power generation, particularly in regions with abundant natural gas reserves, and the growing demand for reliable and efficient power solutions in the automotive and industrial sectors. The increasing focus on reducing carbon emissions is also fostering the development of hydrogen-fueled gas engines, presenting a significant growth opportunity. However, the market faces some restraints including fluctuating natural gas prices and stringent emission regulations, necessitating continuous technological advancements to maintain market competitiveness. Market segmentation reveals a significant share held by the power utilities end-user segment, followed by automotive and industrial applications. Natural gas remains the dominant fuel type, although the market share of hydrogen is expected to grow considerably in the forecast period due to environmental concerns and technological advancements. Leading players like Rolls-Royce, Siemens, and Caterpillar are investing heavily in research and development to enhance engine efficiency and reduce emissions, further contributing to market growth. Geographical analysis suggests strong growth in Asia-Pacific, driven by rapid industrialization and infrastructure development in countries like China and India. North America and Europe also present significant market opportunities due to established industrial bases and supportive government policies.
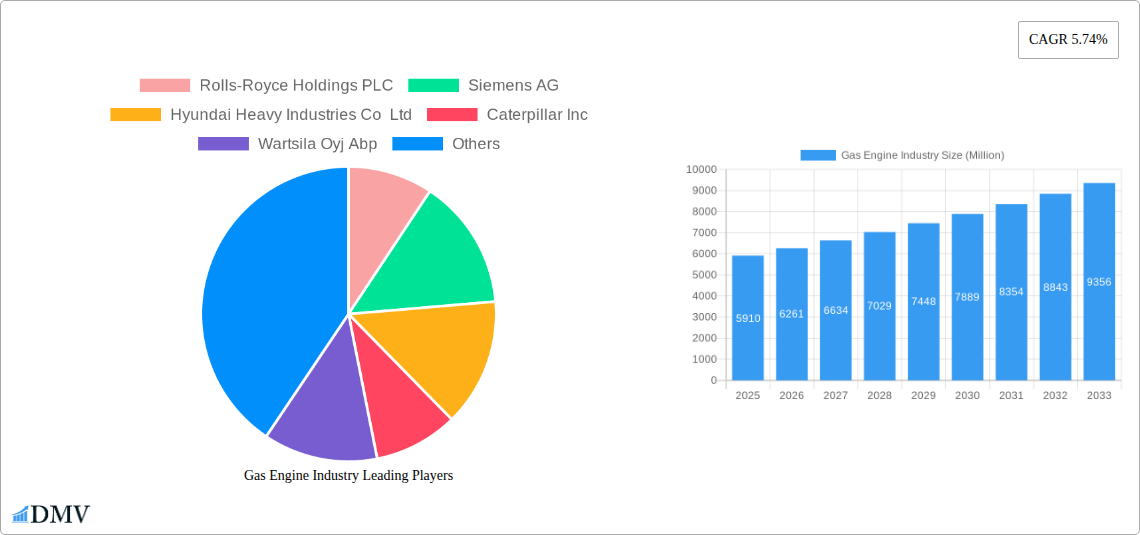
Gas Engine Industry Market Size (In Billion)
The competitive landscape is marked by both established players and emerging companies vying for market share. The ongoing technological advancements in gas engine technology, including improved fuel efficiency, reduced emissions, and enhanced durability, are crucial factors influencing market dynamics. Future growth will depend on factors such as government regulations, fuel price fluctuations, technological breakthroughs, and the global energy transition. The increasing adoption of digital technologies and smart grids further presents opportunities for integration and optimization within the gas engine sector, leading to enhanced operational efficiency and reduced costs. The market is likely to see increased mergers and acquisitions, strategic partnerships, and technological collaborations as companies seek to expand their market reach and develop innovative products. Furthermore, the growing demand for distributed generation and microgrids is also expected to positively influence the growth of the gas engine market.
Gas Engine Industry Company Market Share
Gas Engine Industry Market Report: 2019-2033
This comprehensive report provides a detailed analysis of the global gas engine industry, offering invaluable insights for stakeholders seeking to navigate this dynamic market. With a study period spanning 2019-2033, a base year of 2025, and a forecast period extending to 2033, this report delivers a holistic view of past performance, present conditions, and future projections. The report's value extends to understanding market composition, technological advancements, leading players, and future opportunities, all crucial for informed decision-making. The total market size is projected to reach xx Million by 2033.
Gas Engine Industry Market Composition & Trends
This section delves into the competitive landscape of the gas engine industry, examining market concentration, innovation drivers, regulatory frameworks, substitute product threats, and key end-user segments. We analyze mergers and acquisitions (M&A) activities, including deal values, to understand industry consolidation and strategic shifts. The global gas engine market exhibits a moderately concentrated structure, with key players commanding significant market shares.
- Market Share Distribution (2024): Rolls-Royce Holdings PLC (xx%), Caterpillar Inc. (xx%), Wärtsilä Oyj Abp (xx%), Siemens AG (xx%), and others.
- Innovation Catalysts: Stringent emission regulations, the rising demand for efficient power generation, and the exploration of alternative fuels like hydrogen are driving innovation.
- Regulatory Landscape: Government policies promoting renewable energy and stricter emission standards are shaping the industry's trajectory.
- Substitute Products: Renewable energy sources such as solar and wind power pose a competitive threat, particularly in specific applications.
- End-User Profiles: Power utilities, marine, industrial, and automotive segments are the primary end-users, with varying growth prospects.
- M&A Activity (2019-2024): Total M&A deal value estimated at xx Million, indicating a significant level of consolidation in the industry.
Gas Engine Industry Evolution
This section traces the evolution of the gas engine industry, analyzing market growth trajectories, technological progress, and evolving consumer demands. The industry has witnessed substantial growth over the past five years, driven by increasing energy demand and technological advancements.
The historical period (2019-2024) showcased an average annual growth rate (AAGR) of xx%, primarily fueled by the strong performance of the power generation segment. Technological advancements, such as the development of high-efficiency engines and the integration of digital technologies, have enhanced the competitiveness of gas engines. The transition towards cleaner fuels, particularly natural gas and hydrogen, is reshaping the industry's dynamics. The forecast period (2025-2033) projects a sustained growth trajectory, with an anticipated AAGR of xx%, mainly driven by the growing adoption of gas engines in emerging economies. The increasing demand for reliable and efficient power generation in various sectors, coupled with ongoing technological innovations, will continue to propel market expansion.
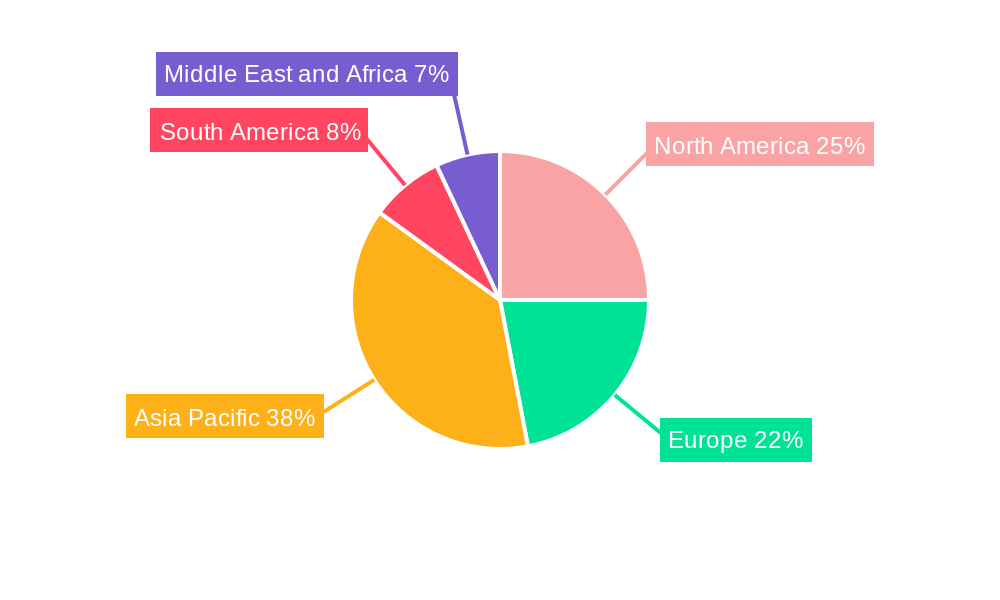
Leading Regions, Countries, or Segments in Gas Engine Industry
This section identifies the dominant regions, countries, and segments within the gas engine market.
- Dominant Region: North America is expected to remain the leading region due to robust industrial activities and supportive government policies.
- Dominant Fuel Type: Natural gas currently dominates the fuel type segment due to its relative abundance and established infrastructure.
- Dominant End-User: The power utilities segment holds the largest market share, driven by the increasing demand for electricity generation.
Key Drivers:
- Power Utilities: Significant investments in power infrastructure and the need for reliable baseload power generation are driving the growth.
- Marine: Stringent emission regulations and the rising demand for efficient propulsion systems fuel the marine segment's growth.
- Industrial: The industrial sector's reliance on reliable power sources and the rising adoption of cogeneration systems contribute to market expansion.
- Natural Gas: Its abundant availability and relatively lower cost compared to other fuels drive its dominance.
- Hydrogen: Government incentives and growing environmental concerns are accelerating the adoption of hydrogen-fueled gas engines, albeit from a smaller base.
The dominance of specific regions and segments is a result of factors such as robust economic growth, favorable government policies, and existing infrastructure. North America and Europe benefit from a well-established gas infrastructure and substantial investment in energy infrastructure, supporting the strong performance of the power utilities segment.
Gas Engine Industry Product Innovations
Recent innovations focus on enhancing engine efficiency, reducing emissions, and expanding fuel flexibility. High-efficiency turbocharging, advanced combustion systems, and the incorporation of digital technologies for predictive maintenance are key advancements. Engines capable of utilizing both natural gas and hydrogen are emerging, catering to the growing demand for cleaner energy sources. These innovations improve fuel efficiency, reduce operational costs, and enhance overall engine performance, leading to a greater market appeal and acceptance.
Propelling Factors for Gas Engine Industry Growth
Technological advancements, economic factors, and supportive regulatory frameworks are key drivers. Improved engine efficiency, reduced emissions, and the development of dual-fuel engines are technological boosts. Government incentives for renewable energy and stricter emission regulations are key regulatory influences. The growing industrialization in developing economies is a significant economic factor.
Obstacles in the Gas Engine Industry Market
The gas engine industry faces challenges including volatile fuel prices, stringent environmental regulations, and increasing competition from renewable energy sources. Supply chain disruptions further contribute to cost fluctuations and potential production delays. These factors can impact profitability and market growth. The industry's carbon footprint also poses a significant long-term threat.
Future Opportunities in Gas Engine Industry
Emerging opportunities include the development of hydrogen-fueled engines, advancements in digital technologies for predictive maintenance, and expansion into new markets such as developing economies. The transition towards cleaner fuels presents a significant opportunity for growth, especially as the industry strives to meet environmental regulations and consumer demand.
Major Players in the Gas Engine Industry Ecosystem
- Rolls-Royce Holdings PLC
- Siemens AG
- Hyundai Heavy Industries Co Ltd
- Caterpillar Inc
- Wartsila Oyj Abp
- Liebherr Group
- Cummins Inc
- General Electric Company
- Kawasaki Heavy Industries Ltd
- JFE Engineering Corporation
- Man SE
- Mitsubishi Heavy Industries Ltd
Key Developments in Gas Engine Industry
- November 2022: Weichai Group launches a commercial natural gas engine with 54.16% base engine thermal efficiency, incorporating advanced technologies.
- March 2023: ITP Aero leads a consortium to develop a hydrogen-fueled commercial aircraft engine, a USD 13 Million project co-funded by the European Union.
These developments showcase advancements in engine efficiency and the exploration of alternative fuels, shaping the future of the gas engine industry.
Strategic Gas Engine Industry Market Forecast
The global gas engine market is poised for continued growth, driven by rising energy demands, technological innovations, and supportive government policies. While challenges exist, the adoption of cleaner fuels and improved engine technologies will create significant opportunities for market expansion in the coming years. The projected growth signifies substantial potential for market players who can adapt to the evolving industry dynamics and cater to the shifting consumer preferences for sustainable energy solutions.
Gas Engine Industry Segmentation
-
1. End-User
- 1.1. Power Utilities
- 1.2. Automotive
- 1.3. Marine
- 1.4. Industrial
- 1.5. Others
-
2. Fuel Type
- 2.1. Natural Gas
- 2.2. Hydrogen
- 2.3. Other Fuel Types
Gas Engine Industry Segmentation By Geography
-
1. North America
- 1.1. United States
- 1.2. Canada
- 1.3. Rest of North America
-
2. Europe
- 2.1. Germany
- 2.2. France
- 2.3. United Kingdom
- 2.4. Rest of Europe
-
3. Asia Pacific
- 3.1. China
- 3.2. India
- 3.3. Japan
- 3.4. South Korea
- 3.5. Rest of Asia Pacific
-
4. South America
- 4.1. Brazil
- 4.2. Argentina
- 4.3. Rest of South America
-
5. Middle East and Africa
- 5.1. Saudi Arabia
- 5.2. United Arab Emirates
- 5.3. South Africa
- 5.4. Rest of Middle East and Africa
Gas Engine Industry Regional Market Share
Geographic Coverage of Gas Engine Industry
Gas Engine Industry REPORT HIGHLIGHTS
| Aspects | Details |
|---|---|
| Study Period | 2020-2034 |
| Base Year | 2025 |
| Estimated Year | 2026 |
| Forecast Period | 2026-2034 |
| Historical Period | 2020-2025 |
| Growth Rate | CAGR of 5.74% from 2020-2034 |
| Segmentation |
|
Table of Contents
- 1. Introduction
- 1.1. Research Scope
- 1.2. Market Segmentation
- 1.3. Research Objective
- 1.4. Definitions and Assumptions
- 2. Executive Summary
- 2.1. Market Snapshot
- 3. Market Dynamics
- 3.1. Market Drivers
- 3.2. Market Restrains
- 3.3. Market Trends
- 3.4. Market Opportunities
- 4. Market Factor Analysis
- 4.1. Porters Five Forces
- 4.1.1. Bargaining Power of Suppliers
- 4.1.2. Bargaining Power of Buyers
- 4.1.3. Threat of New Entrants
- 4.1.4. Threat of Substitutes
- 4.1.5. Competitive Rivalry
- 4.2. PESTEL analysis
- 4.3. BCG Analysis
- 4.3.1. Stars (High Growth, High Market Share)
- 4.3.2. Cash Cows (Low Growth, High Market Share)
- 4.3.3. Question Mark (High Growth, Low Market Share)
- 4.3.4. Dogs (Low Growth, Low Market Share)
- 4.4. Ansoff Matrix Analysis
- 4.5. Supply Chain Analysis
- 4.6. Regulatory Landscape
- 4.7. Current Market Potential and Opportunity Assessment (TAM–SAM–SOM Framework)
- 4.8. DMV Analyst Note
- 4.1. Porters Five Forces
- 5. Market Analysis, Insights and Forecast 2021-2033
- 5.1. Market Analysis, Insights and Forecast - by End-User
- 5.1.1. Power Utilities
- 5.1.2. Automotive
- 5.1.3. Marine
- 5.1.4. Industrial
- 5.1.5. Others
- 5.2. Market Analysis, Insights and Forecast - by Fuel Type
- 5.2.1. Natural Gas
- 5.2.2. Hydrogen
- 5.2.3. Other Fuel Types
- 5.3. Market Analysis, Insights and Forecast - by Region
- 5.3.1. North America
- 5.3.2. Europe
- 5.3.3. Asia Pacific
- 5.3.4. South America
- 5.3.5. Middle East and Africa
- 5.1. Market Analysis, Insights and Forecast - by End-User
- 6. Global Gas Engine Industry Analysis, Insights and Forecast, 2021-2033
- 6.1. Market Analysis, Insights and Forecast - by End-User
- 6.1.1. Power Utilities
- 6.1.2. Automotive
- 6.1.3. Marine
- 6.1.4. Industrial
- 6.1.5. Others
- 6.2. Market Analysis, Insights and Forecast - by Fuel Type
- 6.2.1. Natural Gas
- 6.2.2. Hydrogen
- 6.2.3. Other Fuel Types
- 6.1. Market Analysis, Insights and Forecast - by End-User
- 7. North America Gas Engine Industry Analysis, Insights and Forecast, 2020-2032
- 7.1. Market Analysis, Insights and Forecast - by End-User
- 7.1.1. Power Utilities
- 7.1.2. Automotive
- 7.1.3. Marine
- 7.1.4. Industrial
- 7.1.5. Others
- 7.2. Market Analysis, Insights and Forecast - by Fuel Type
- 7.2.1. Natural Gas
- 7.2.2. Hydrogen
- 7.2.3. Other Fuel Types
- 7.1. Market Analysis, Insights and Forecast - by End-User
- 8. Europe Gas Engine Industry Analysis, Insights and Forecast, 2020-2032
- 8.1. Market Analysis, Insights and Forecast - by End-User
- 8.1.1. Power Utilities
- 8.1.2. Automotive
- 8.1.3. Marine
- 8.1.4. Industrial
- 8.1.5. Others
- 8.2. Market Analysis, Insights and Forecast - by Fuel Type
- 8.2.1. Natural Gas
- 8.2.2. Hydrogen
- 8.2.3. Other Fuel Types
- 8.1. Market Analysis, Insights and Forecast - by End-User
- 9. Asia Pacific Gas Engine Industry Analysis, Insights and Forecast, 2020-2032
- 9.1. Market Analysis, Insights and Forecast - by End-User
- 9.1.1. Power Utilities
- 9.1.2. Automotive
- 9.1.3. Marine
- 9.1.4. Industrial
- 9.1.5. Others
- 9.2. Market Analysis, Insights and Forecast - by Fuel Type
- 9.2.1. Natural Gas
- 9.2.2. Hydrogen
- 9.2.3. Other Fuel Types
- 9.1. Market Analysis, Insights and Forecast - by End-User
- 10. South America Gas Engine Industry Analysis, Insights and Forecast, 2020-2032
- 10.1. Market Analysis, Insights and Forecast - by End-User
- 10.1.1. Power Utilities
- 10.1.2. Automotive
- 10.1.3. Marine
- 10.1.4. Industrial
- 10.1.5. Others
- 10.2. Market Analysis, Insights and Forecast - by Fuel Type
- 10.2.1. Natural Gas
- 10.2.2. Hydrogen
- 10.2.3. Other Fuel Types
- 10.1. Market Analysis, Insights and Forecast - by End-User
- 11. Middle East and Africa Gas Engine Industry Analysis, Insights and Forecast, 2020-2032
- 11.1. Market Analysis, Insights and Forecast - by End-User
- 11.1.1. Power Utilities
- 11.1.2. Automotive
- 11.1.3. Marine
- 11.1.4. Industrial
- 11.1.5. Others
- 11.2. Market Analysis, Insights and Forecast - by Fuel Type
- 11.2.1. Natural Gas
- 11.2.2. Hydrogen
- 11.2.3. Other Fuel Types
- 11.1. Market Analysis, Insights and Forecast - by End-User
- 12. Competitive Analysis
- 12.1. Company Profiles
- 12.1.1 Rolls-Royce Holdings PLC
- 12.1.1.1. Company Overview
- 12.1.1.2. Products
- 12.1.1.3. Company Financials
- 12.1.1.4. SWOT Analysis
- 12.1.2 Siemens AG
- 12.1.2.1. Company Overview
- 12.1.2.2. Products
- 12.1.2.3. Company Financials
- 12.1.2.4. SWOT Analysis
- 12.1.3 Hyundai Heavy Industries Co Ltd
- 12.1.3.1. Company Overview
- 12.1.3.2. Products
- 12.1.3.3. Company Financials
- 12.1.3.4. SWOT Analysis
- 12.1.4 Caterpillar Inc
- 12.1.4.1. Company Overview
- 12.1.4.2. Products
- 12.1.4.3. Company Financials
- 12.1.4.4. SWOT Analysis
- 12.1.5 Wartsila Oyj Abp
- 12.1.5.1. Company Overview
- 12.1.5.2. Products
- 12.1.5.3. Company Financials
- 12.1.5.4. SWOT Analysis
- 12.1.6 Liebherr Group*List Not Exhaustive
- 12.1.6.1. Company Overview
- 12.1.6.2. Products
- 12.1.6.3. Company Financials
- 12.1.6.4. SWOT Analysis
- 12.1.7 Cummins Inc
- 12.1.7.1. Company Overview
- 12.1.7.2. Products
- 12.1.7.3. Company Financials
- 12.1.7.4. SWOT Analysis
- 12.1.8 General Electric Company
- 12.1.8.1. Company Overview
- 12.1.8.2. Products
- 12.1.8.3. Company Financials
- 12.1.8.4. SWOT Analysis
- 12.1.9 Kawasaki Heavy Industries Ltd
- 12.1.9.1. Company Overview
- 12.1.9.2. Products
- 12.1.9.3. Company Financials
- 12.1.9.4. SWOT Analysis
- 12.1.10 JFE Engineering Corporation
- 12.1.10.1. Company Overview
- 12.1.10.2. Products
- 12.1.10.3. Company Financials
- 12.1.10.4. SWOT Analysis
- 12.1.11 Man SE
- 12.1.11.1. Company Overview
- 12.1.11.2. Products
- 12.1.11.3. Company Financials
- 12.1.11.4. SWOT Analysis
- 12.1.12 Mitsubishi Heavy Industries Ltd
- 12.1.12.1. Company Overview
- 12.1.12.2. Products
- 12.1.12.3. Company Financials
- 12.1.12.4. SWOT Analysis
- 12.1.1 Rolls-Royce Holdings PLC
- 12.2. Market Entropy
- 12.2.1 Company's Key Areas Served
- 12.2.2 Recent Developments
- 12.3. Company Market Share Analysis 2025
- 12.3.1 Top 5 Companies Market Share Analysis
- 12.3.2 Top 3 Companies Market Share Analysis
- 12.4. List of Potential Customers
- 13. Research Methodology
List of Figures
- Figure 1: Global Gas Engine Industry Revenue Breakdown (Million, %) by Region 2025 & 2033
- Figure 2: Global Gas Engine Industry Volume Breakdown (K Unit, %) by Region 2025 & 2033
- Figure 3: North America Gas Engine Industry Revenue (Million), by End-User 2025 & 2033
- Figure 4: North America Gas Engine Industry Volume (K Unit), by End-User 2025 & 2033
- Figure 5: North America Gas Engine Industry Revenue Share (%), by End-User 2025 & 2033
- Figure 6: North America Gas Engine Industry Volume Share (%), by End-User 2025 & 2033
- Figure 7: North America Gas Engine Industry Revenue (Million), by Fuel Type 2025 & 2033
- Figure 8: North America Gas Engine Industry Volume (K Unit), by Fuel Type 2025 & 2033
- Figure 9: North America Gas Engine Industry Revenue Share (%), by Fuel Type 2025 & 2033
- Figure 10: North America Gas Engine Industry Volume Share (%), by Fuel Type 2025 & 2033
- Figure 11: North America Gas Engine Industry Revenue (Million), by Country 2025 & 2033
- Figure 12: North America Gas Engine Industry Volume (K Unit), by Country 2025 & 2033
- Figure 13: North America Gas Engine Industry Revenue Share (%), by Country 2025 & 2033
- Figure 14: North America Gas Engine Industry Volume Share (%), by Country 2025 & 2033
- Figure 15: Europe Gas Engine Industry Revenue (Million), by End-User 2025 & 2033
- Figure 16: Europe Gas Engine Industry Volume (K Unit), by End-User 2025 & 2033
- Figure 17: Europe Gas Engine Industry Revenue Share (%), by End-User 2025 & 2033
- Figure 18: Europe Gas Engine Industry Volume Share (%), by End-User 2025 & 2033
- Figure 19: Europe Gas Engine Industry Revenue (Million), by Fuel Type 2025 & 2033
- Figure 20: Europe Gas Engine Industry Volume (K Unit), by Fuel Type 2025 & 2033
- Figure 21: Europe Gas Engine Industry Revenue Share (%), by Fuel Type 2025 & 2033
- Figure 22: Europe Gas Engine Industry Volume Share (%), by Fuel Type 2025 & 2033
- Figure 23: Europe Gas Engine Industry Revenue (Million), by Country 2025 & 2033
- Figure 24: Europe Gas Engine Industry Volume (K Unit), by Country 2025 & 2033
- Figure 25: Europe Gas Engine Industry Revenue Share (%), by Country 2025 & 2033
- Figure 26: Europe Gas Engine Industry Volume Share (%), by Country 2025 & 2033
- Figure 27: Asia Pacific Gas Engine Industry Revenue (Million), by End-User 2025 & 2033
- Figure 28: Asia Pacific Gas Engine Industry Volume (K Unit), by End-User 2025 & 2033
- Figure 29: Asia Pacific Gas Engine Industry Revenue Share (%), by End-User 2025 & 2033
- Figure 30: Asia Pacific Gas Engine Industry Volume Share (%), by End-User 2025 & 2033
- Figure 31: Asia Pacific Gas Engine Industry Revenue (Million), by Fuel Type 2025 & 2033
- Figure 32: Asia Pacific Gas Engine Industry Volume (K Unit), by Fuel Type 2025 & 2033
- Figure 33: Asia Pacific Gas Engine Industry Revenue Share (%), by Fuel Type 2025 & 2033
- Figure 34: Asia Pacific Gas Engine Industry Volume Share (%), by Fuel Type 2025 & 2033
- Figure 35: Asia Pacific Gas Engine Industry Revenue (Million), by Country 2025 & 2033
- Figure 36: Asia Pacific Gas Engine Industry Volume (K Unit), by Country 2025 & 2033
- Figure 37: Asia Pacific Gas Engine Industry Revenue Share (%), by Country 2025 & 2033
- Figure 38: Asia Pacific Gas Engine Industry Volume Share (%), by Country 2025 & 2033
- Figure 39: South America Gas Engine Industry Revenue (Million), by End-User 2025 & 2033
- Figure 40: South America Gas Engine Industry Volume (K Unit), by End-User 2025 & 2033
- Figure 41: South America Gas Engine Industry Revenue Share (%), by End-User 2025 & 2033
- Figure 42: South America Gas Engine Industry Volume Share (%), by End-User 2025 & 2033
- Figure 43: South America Gas Engine Industry Revenue (Million), by Fuel Type 2025 & 2033
- Figure 44: South America Gas Engine Industry Volume (K Unit), by Fuel Type 2025 & 2033
- Figure 45: South America Gas Engine Industry Revenue Share (%), by Fuel Type 2025 & 2033
- Figure 46: South America Gas Engine Industry Volume Share (%), by Fuel Type 2025 & 2033
- Figure 47: South America Gas Engine Industry Revenue (Million), by Country 2025 & 2033
- Figure 48: South America Gas Engine Industry Volume (K Unit), by Country 2025 & 2033
- Figure 49: South America Gas Engine Industry Revenue Share (%), by Country 2025 & 2033
- Figure 50: South America Gas Engine Industry Volume Share (%), by Country 2025 & 2033
- Figure 51: Middle East and Africa Gas Engine Industry Revenue (Million), by End-User 2025 & 2033
- Figure 52: Middle East and Africa Gas Engine Industry Volume (K Unit), by End-User 2025 & 2033
- Figure 53: Middle East and Africa Gas Engine Industry Revenue Share (%), by End-User 2025 & 2033
- Figure 54: Middle East and Africa Gas Engine Industry Volume Share (%), by End-User 2025 & 2033
- Figure 55: Middle East and Africa Gas Engine Industry Revenue (Million), by Fuel Type 2025 & 2033
- Figure 56: Middle East and Africa Gas Engine Industry Volume (K Unit), by Fuel Type 2025 & 2033
- Figure 57: Middle East and Africa Gas Engine Industry Revenue Share (%), by Fuel Type 2025 & 2033
- Figure 58: Middle East and Africa Gas Engine Industry Volume Share (%), by Fuel Type 2025 & 2033
- Figure 59: Middle East and Africa Gas Engine Industry Revenue (Million), by Country 2025 & 2033
- Figure 60: Middle East and Africa Gas Engine Industry Volume (K Unit), by Country 2025 & 2033
- Figure 61: Middle East and Africa Gas Engine Industry Revenue Share (%), by Country 2025 & 2033
- Figure 62: Middle East and Africa Gas Engine Industry Volume Share (%), by Country 2025 & 2033
List of Tables
- Table 1: Global Gas Engine Industry Revenue Million Forecast, by End-User 2020 & 2033
- Table 2: Global Gas Engine Industry Volume K Unit Forecast, by End-User 2020 & 2033
- Table 3: Global Gas Engine Industry Revenue Million Forecast, by Fuel Type 2020 & 2033
- Table 4: Global Gas Engine Industry Volume K Unit Forecast, by Fuel Type 2020 & 2033
- Table 5: Global Gas Engine Industry Revenue Million Forecast, by Region 2020 & 2033
- Table 6: Global Gas Engine Industry Volume K Unit Forecast, by Region 2020 & 2033
- Table 7: Global Gas Engine Industry Revenue Million Forecast, by End-User 2020 & 2033
- Table 8: Global Gas Engine Industry Volume K Unit Forecast, by End-User 2020 & 2033
- Table 9: Global Gas Engine Industry Revenue Million Forecast, by Fuel Type 2020 & 2033
- Table 10: Global Gas Engine Industry Volume K Unit Forecast, by Fuel Type 2020 & 2033
- Table 11: Global Gas Engine Industry Revenue Million Forecast, by Country 2020 & 2033
- Table 12: Global Gas Engine Industry Volume K Unit Forecast, by Country 2020 & 2033
- Table 13: United States Gas Engine Industry Revenue (Million) Forecast, by Application 2020 & 2033
- Table 14: United States Gas Engine Industry Volume (K Unit) Forecast, by Application 2020 & 2033
- Table 15: Canada Gas Engine Industry Revenue (Million) Forecast, by Application 2020 & 2033
- Table 16: Canada Gas Engine Industry Volume (K Unit) Forecast, by Application 2020 & 2033
- Table 17: Rest of North America Gas Engine Industry Revenue (Million) Forecast, by Application 2020 & 2033
- Table 18: Rest of North America Gas Engine Industry Volume (K Unit) Forecast, by Application 2020 & 2033
- Table 19: Global Gas Engine Industry Revenue Million Forecast, by End-User 2020 & 2033
- Table 20: Global Gas Engine Industry Volume K Unit Forecast, by End-User 2020 & 2033
- Table 21: Global Gas Engine Industry Revenue Million Forecast, by Fuel Type 2020 & 2033
- Table 22: Global Gas Engine Industry Volume K Unit Forecast, by Fuel Type 2020 & 2033
- Table 23: Global Gas Engine Industry Revenue Million Forecast, by Country 2020 & 2033
- Table 24: Global Gas Engine Industry Volume K Unit Forecast, by Country 2020 & 2033
- Table 25: Germany Gas Engine Industry Revenue (Million) Forecast, by Application 2020 & 2033
- Table 26: Germany Gas Engine Industry Volume (K Unit) Forecast, by Application 2020 & 2033
- Table 27: France Gas Engine Industry Revenue (Million) Forecast, by Application 2020 & 2033
- Table 28: France Gas Engine Industry Volume (K Unit) Forecast, by Application 2020 & 2033
- Table 29: United Kingdom Gas Engine Industry Revenue (Million) Forecast, by Application 2020 & 2033
- Table 30: United Kingdom Gas Engine Industry Volume (K Unit) Forecast, by Application 2020 & 2033
- Table 31: Rest of Europe Gas Engine Industry Revenue (Million) Forecast, by Application 2020 & 2033
- Table 32: Rest of Europe Gas Engine Industry Volume (K Unit) Forecast, by Application 2020 & 2033
- Table 33: Global Gas Engine Industry Revenue Million Forecast, by End-User 2020 & 2033
- Table 34: Global Gas Engine Industry Volume K Unit Forecast, by End-User 2020 & 2033
- Table 35: Global Gas Engine Industry Revenue Million Forecast, by Fuel Type 2020 & 2033
- Table 36: Global Gas Engine Industry Volume K Unit Forecast, by Fuel Type 2020 & 2033
- Table 37: Global Gas Engine Industry Revenue Million Forecast, by Country 2020 & 2033
- Table 38: Global Gas Engine Industry Volume K Unit Forecast, by Country 2020 & 2033
- Table 39: China Gas Engine Industry Revenue (Million) Forecast, by Application 2020 & 2033
- Table 40: China Gas Engine Industry Volume (K Unit) Forecast, by Application 2020 & 2033
- Table 41: India Gas Engine Industry Revenue (Million) Forecast, by Application 2020 & 2033
- Table 42: India Gas Engine Industry Volume (K Unit) Forecast, by Application 2020 & 2033
- Table 43: Japan Gas Engine Industry Revenue (Million) Forecast, by Application 2020 & 2033
- Table 44: Japan Gas Engine Industry Volume (K Unit) Forecast, by Application 2020 & 2033
- Table 45: South Korea Gas Engine Industry Revenue (Million) Forecast, by Application 2020 & 2033
- Table 46: South Korea Gas Engine Industry Volume (K Unit) Forecast, by Application 2020 & 2033
- Table 47: Rest of Asia Pacific Gas Engine Industry Revenue (Million) Forecast, by Application 2020 & 2033
- Table 48: Rest of Asia Pacific Gas Engine Industry Volume (K Unit) Forecast, by Application 2020 & 2033
- Table 49: Global Gas Engine Industry Revenue Million Forecast, by End-User 2020 & 2033
- Table 50: Global Gas Engine Industry Volume K Unit Forecast, by End-User 2020 & 2033
- Table 51: Global Gas Engine Industry Revenue Million Forecast, by Fuel Type 2020 & 2033
- Table 52: Global Gas Engine Industry Volume K Unit Forecast, by Fuel Type 2020 & 2033
- Table 53: Global Gas Engine Industry Revenue Million Forecast, by Country 2020 & 2033
- Table 54: Global Gas Engine Industry Volume K Unit Forecast, by Country 2020 & 2033
- Table 55: Brazil Gas Engine Industry Revenue (Million) Forecast, by Application 2020 & 2033
- Table 56: Brazil Gas Engine Industry Volume (K Unit) Forecast, by Application 2020 & 2033
- Table 57: Argentina Gas Engine Industry Revenue (Million) Forecast, by Application 2020 & 2033
- Table 58: Argentina Gas Engine Industry Volume (K Unit) Forecast, by Application 2020 & 2033
- Table 59: Rest of South America Gas Engine Industry Revenue (Million) Forecast, by Application 2020 & 2033
- Table 60: Rest of South America Gas Engine Industry Volume (K Unit) Forecast, by Application 2020 & 2033
- Table 61: Global Gas Engine Industry Revenue Million Forecast, by End-User 2020 & 2033
- Table 62: Global Gas Engine Industry Volume K Unit Forecast, by End-User 2020 & 2033
- Table 63: Global Gas Engine Industry Revenue Million Forecast, by Fuel Type 2020 & 2033
- Table 64: Global Gas Engine Industry Volume K Unit Forecast, by Fuel Type 2020 & 2033
- Table 65: Global Gas Engine Industry Revenue Million Forecast, by Country 2020 & 2033
- Table 66: Global Gas Engine Industry Volume K Unit Forecast, by Country 2020 & 2033
- Table 67: Saudi Arabia Gas Engine Industry Revenue (Million) Forecast, by Application 2020 & 2033
- Table 68: Saudi Arabia Gas Engine Industry Volume (K Unit) Forecast, by Application 2020 & 2033
- Table 69: United Arab Emirates Gas Engine Industry Revenue (Million) Forecast, by Application 2020 & 2033
- Table 70: United Arab Emirates Gas Engine Industry Volume (K Unit) Forecast, by Application 2020 & 2033
- Table 71: South Africa Gas Engine Industry Revenue (Million) Forecast, by Application 2020 & 2033
- Table 72: South Africa Gas Engine Industry Volume (K Unit) Forecast, by Application 2020 & 2033
- Table 73: Rest of Middle East and Africa Gas Engine Industry Revenue (Million) Forecast, by Application 2020 & 2033
- Table 74: Rest of Middle East and Africa Gas Engine Industry Volume (K Unit) Forecast, by Application 2020 & 2033
Frequently Asked Questions
1. What is the projected Compound Annual Growth Rate (CAGR) of the Gas Engine Industry?
The projected CAGR is approximately 5.74%.
2. Which companies are prominent players in the Gas Engine Industry?
Key companies in the market include Rolls-Royce Holdings PLC, Siemens AG, Hyundai Heavy Industries Co Ltd, Caterpillar Inc, Wartsila Oyj Abp, Liebherr Group*List Not Exhaustive, Cummins Inc, General Electric Company, Kawasaki Heavy Industries Ltd, JFE Engineering Corporation, Man SE, Mitsubishi Heavy Industries Ltd.
3. What are the main segments of the Gas Engine Industry?
The market segments include End-User, Fuel Type.
4. Can you provide details about the market size?
The market size is estimated to be USD 5.91 Million as of 2022.
5. What are some drivers contributing to market growth?
4.; Increasing Supply and Consumption of Gas-based Systems in Various End-user Industry4.; Implementation of stricter emission regulations worldwide.
6. What are the notable trends driving market growth?
Power Utilities Expected to Witness Significant Growth.
7. Are there any restraints impacting market growth?
4.; Growing Inclination towards Renewable Sources.
8. Can you provide examples of recent developments in the market?
In March 2023, ITP Aero, a Spanish aircraft engine company, has announced that it is leading a national consortium to test and develop the first hydrogen-fueled commercial aircraft engine developed locally. As part of the Spanish Ministry of Science agency's Aeronautical Technology Plan, managed by CDTI, the Spanish Center for Technological Development and Innovation, the USD 13 million Cryogenics, Fuel Cells and Hydrogen Combustion in Air Transport project is co-funded by European Union Next Gen strategic investment funding.
9. What pricing options are available for accessing the report?
Pricing options include single-user, multi-user, and enterprise licenses priced at USD 4750, USD 5250, and USD 8750 respectively.
10. Is the market size provided in terms of value or volume?
The market size is provided in terms of value, measured in Million and volume, measured in K Unit.
11. Are there any specific market keywords associated with the report?
Yes, the market keyword associated with the report is "Gas Engine Industry," which aids in identifying and referencing the specific market segment covered.
12. How do I determine which pricing option suits my needs best?
The pricing options vary based on user requirements and access needs. Individual users may opt for single-user licenses, while businesses requiring broader access may choose multi-user or enterprise licenses for cost-effective access to the report.
13. Are there any additional resources or data provided in the Gas Engine Industry report?
While the report offers comprehensive insights, it's advisable to review the specific contents or supplementary materials provided to ascertain if additional resources or data are available.
14. How can I stay updated on further developments or reports in the Gas Engine Industry?
To stay informed about further developments, trends, and reports in the Gas Engine Industry, consider subscribing to industry newsletters, following relevant companies and organizations, or regularly checking reputable industry news sources and publications.
Methodology
Step 1 - Identification of Relevant Samples Size from Population Database


Step 2 - Approaches for Defining Global Market Size (Value, Volume* & Price*)

Note*: In applicable scenarios
Step 3 - Data Sources
Primary Research
- Web Analytics
- Survey Reports
- Research Institute
- Latest Research Reports
- Opinion Leaders
Secondary Research
- Annual Reports
- White Paper
- Latest Press Release
- Industry Association
- Paid Database
- Investor Presentations

Step 4 - Data Triangulation
Involves using different sources of information in order to increase the validity of a study
These sources are likely to be stakeholders in a program - participants, other researchers, program staff, other community members, and so on.
Then we put all data in single framework & apply various statistical tools to find out the dynamic on the market.
During the analysis stage, feedback from the stakeholder groups would be compared to determine areas of agreement as well as areas of divergence