

Key Insights
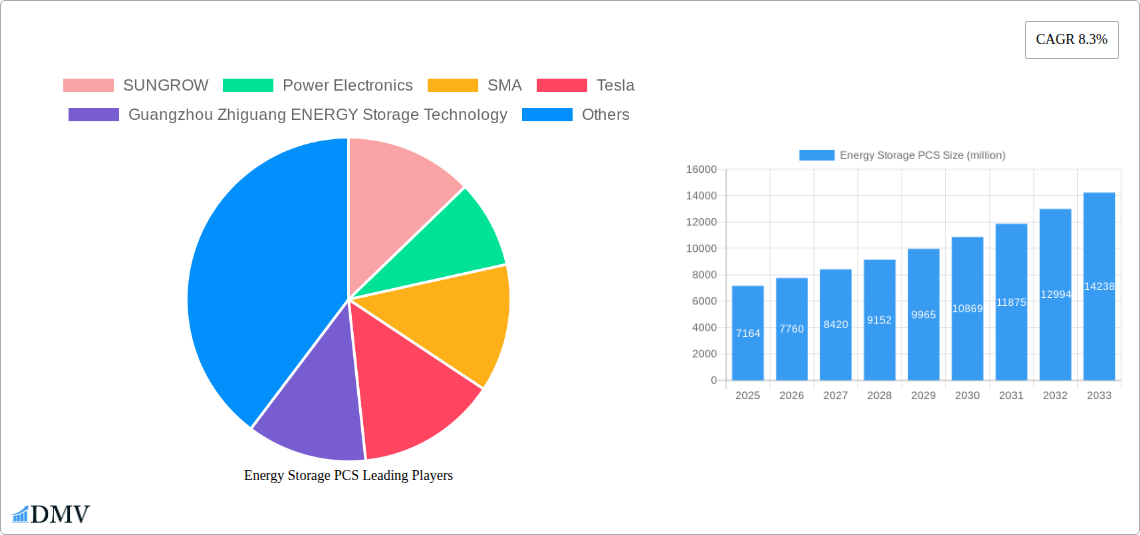
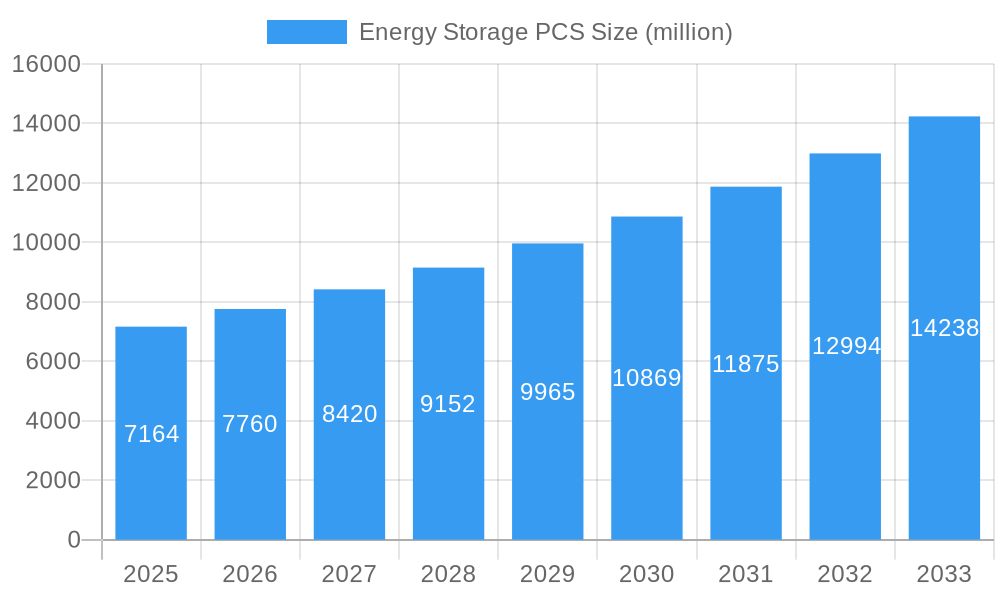
The global Energy Storage Power Conversion System (PCS) market, valued at $7,164 million in 2025, is projected to experience robust growth, driven by the increasing adoption of renewable energy sources like solar and wind power. The need for grid stabilization and improved energy efficiency, coupled with supportive government policies promoting energy storage deployment, are key catalysts for market expansion. A compound annual growth rate (CAGR) of 8.3% from 2025 to 2033 suggests a significant market expansion, with the market size expected to exceed $14,000 million by 2033. This growth is fueled by technological advancements leading to higher energy density, improved efficiency, and reduced costs for energy storage PCS units. Stringent emission regulations and rising electricity prices are further encouraging the adoption of energy storage solutions across various sectors, including residential, commercial, and utility-scale applications. Competition among established players like Sungrow, SMA, and Tesla, alongside emerging companies, is fostering innovation and driving down prices, making energy storage PCS more accessible.
Energy Storage PCS Market Size (In Billion)
Market segmentation, while not explicitly detailed, likely includes variations based on power rating (e.g., residential, commercial, utility-scale), technology (e.g., inverter topology, battery chemistry compatibility), and geographical location. The competitive landscape showcases a mix of global giants and regional players, indicating opportunities for both established businesses and emerging companies. Despite the strong growth trajectory, potential restraints could include the upfront capital investment required for energy storage systems, the need for reliable and robust grid infrastructure to integrate these systems effectively, and the potential for regulatory hurdles in certain markets. However, ongoing technological advancements and decreasing battery costs are mitigating these challenges, paving the way for sustained and significant market expansion in the coming years.
Energy Storage PCS Company Market Share
Energy Storage PCS Market Report: 2019-2033
This comprehensive report provides an in-depth analysis of the global Energy Storage PCS market, projecting a multi-billion dollar valuation by 2033. The study covers the historical period (2019-2024), the base year (2025), and forecasts the market's trajectory until 2033. Key players like SUNGROW, Tesla, and HUAWEI are analyzed, alongside emerging companies, revealing market dynamics and future opportunities. This report is essential for stakeholders seeking strategic insights into this rapidly evolving sector.
Energy Storage PCS Market Composition & Trends
This section meticulously dissects the competitive landscape of the Energy Storage PCS market, encompassing market concentration, innovation drivers, regulatory frameworks, substitute products, end-user profiles, and mergers & acquisitions (M&A) activity. The analysis uses data from 2019-2024 to paint a complete picture of market evolution.
Market Concentration & Share Distribution: The global Energy Storage PCS market shows a moderately concentrated structure, with the top 5 players holding an estimated xx% market share in 2025. This is expected to slightly consolidate further by 2033, with the top players capturing xx% of the total market value.
Innovation Catalysts: Technological advancements, particularly in battery technologies (Lithium-ion, etc.) and power electronics, are key drivers. The push for higher efficiency, lower costs, and improved grid integration is fueling innovation.
Regulatory Landscape & Government Policies: Government incentives like tax credits, feed-in tariffs, and renewable energy mandates significantly influence market growth. Stringent emission regulations are further driving adoption.
Substitute Products & Competitive Dynamics: While currently limited, alternative technologies like flywheels and pumped hydro are potential substitutes, although they often face limitations regarding scalability or location suitability. Intense competition among leading players is driving price reductions and innovation.
End-User Profiles: The primary end-users are utility companies, industrial facilities, commercial businesses (e.g., data centers), and increasingly, residential customers adopting home energy storage solutions.
M&A Activity: The Energy Storage PCS sector has witnessed significant M&A activity in recent years, with a total deal value of approximately $xx million between 2019 and 2024. This trend is expected to continue, driven by companies seeking to expand their market share and technological capabilities. Notable examples include [Insert Specific M&A examples with values if available].
Energy Storage PCS Industry Evolution
This section analyzes the growth trajectories, technological advancements, and evolving consumer demands in the Energy Storage PCS market. The analysis covers the period from 2019 to 2033, offering insights into market trends and future prospects.
The Energy Storage PCS market experienced a Compound Annual Growth Rate (CAGR) of xx% during the period 2019-2024, reaching a market value of approximately $xx million in 2024. This robust growth is attributed to several factors. Firstly, the increasing penetration of renewable energy sources like solar and wind power necessitates efficient energy storage solutions to address intermittency issues. Secondly, technological advancements, particularly in battery chemistry and power electronics, have driven down costs and improved performance, making Energy Storage PCS solutions more economically viable.
Consumer demand is shifting towards higher capacity, longer lifespan, and more intelligent energy storage systems with advanced features like grid services participation and smart home integration. Furthermore, government policies promoting renewable energy and energy efficiency are significantly accelerating market adoption. The forecast period (2025-2033) projects continued growth, with a projected CAGR of xx%, reaching a market value of approximately $xx million by 2033. This growth will be fueled by increasing demand from residential, commercial, and utility-scale applications.
Leading Regions, Countries, or Segments in Energy Storage PCS
This section identifies the dominant regions, countries, and segments within the Energy Storage PCS market. The analysis focuses on factors driving the dominance of these key areas.
Dominant Region: [Specify dominant region, e.g., North America] leads the global Energy Storage PCS market due to:
- Strong government support for renewable energy integration.
- Significant investments in grid modernization projects.
- High adoption rates of residential and commercial energy storage systems.
Dominant Countries: [List top 3-5 countries and their key drivers – e.g., China, US, Germany. Explain drivers for each country individually in paragraph form, using examples like specific policy details or infrastructure developments]
Dominant Segment: [Identify the dominant segment, e.g., utility-scale, residential, industrial and explain the reasons behind its dominance using paragraphs.]
Energy Storage PCS Product Innovations
Recent innovations in Energy Storage PCS include advancements in power conversion efficiency, improved thermal management, enhanced safety features, and the integration of smart grid technologies. These innovations have led to smaller, lighter, more reliable, and cost-effective systems. The incorporation of advanced control algorithms optimizes energy storage and grid interaction, enhancing overall system performance and efficiency. The rise of modular designs simplifies installation and maintenance, further boosting market appeal.
Propelling Factors for Energy Storage PCS Growth
Several factors contribute to the robust growth of the Energy Storage PCS market. Technological advancements, particularly in battery technologies and power electronics, are driving down costs and improving system performance. Favorable government policies, including tax incentives and renewable energy mandates, are incentivizing adoption. The increasing integration of renewable energy sources necessitates efficient energy storage solutions to address intermittency challenges. Furthermore, the growing demand for improved grid stability and resilience fuels market expansion.
Obstacles in the Energy Storage PCS Market
Despite the significant growth potential, the Energy Storage PCS market faces several challenges. High initial investment costs can be a barrier to entry for some consumers. Supply chain disruptions, especially concerning raw materials for battery production, can impact production and availability. Stringent safety regulations and grid integration standards can increase complexity and costs. Finally, intense competition among established and emerging players creates pressure on pricing and profitability.
Future Opportunities in Energy Storage PCS
Future opportunities in the Energy Storage PCS market include expanding into new geographical regions with high growth potential, particularly in developing economies. The emergence of new battery chemistries, such as solid-state batteries, presents significant growth prospects. Integrating advanced energy management systems and artificial intelligence to optimize energy storage and grid services is another key area of growth. Finally, the increasing adoption of electric vehicles opens up new market opportunities for vehicle-to-grid (V2G) technologies.
Major Players in the Energy Storage PCS Ecosystem
- SUNGROW
- Power Electronics
- SMA
- Tesla
- Guangzhou Zhiguang ENERGY Storage Technology
- SolarEdge
- Ingeteam
- Beijing Soaring Electric Technology
- Shenzhen Sinexcel Electric
- NR Engineering
- SHENZHEN HOPEWIND ELECTRIC
- Kehua
- XJ ELECTRIC
- GoodWe
- HUAWEI
- Dynapower
- Zhuzhou CRRC Times Electric
- Beijing In-Power Electric
- Nidec
- EPC Power
- Shenzhen Inovance Technology
- Growatt
- GE
- Shenzhen Sofarsolar
- Shenzhen Kstar Science and Technology
- TMEIC
- Sineng Electric
- eks Energy
- WSTECH
Key Developments in Energy Storage PCS Industry
- [Year/Month]: [Company Name] launches a new high-efficiency Energy Storage PCS with improved thermal management capabilities.
- [Year/Month]: [Company Name] announces a strategic partnership to expand its market reach in [Region].
- [Year/Month]: Significant government policy changes in [Country] incentivize Energy Storage PCS adoption.
- [Year/Month]: [Company A] acquires [Company B], expanding its product portfolio and market share. [Add more bullet points as needed, ensuring year/month precision]
Strategic Energy Storage PCS Market Forecast
The Energy Storage PCS market is poised for sustained growth driven by increasing renewable energy adoption, stringent environmental regulations, and technological advancements. The forecast period (2025-2033) anticipates robust expansion, fueled by expanding applications in residential, commercial, and utility-scale sectors. The continued innovation in battery technologies and cost reductions will unlock new market segments and accelerate growth. Strategic partnerships and mergers & acquisitions will further shape the market landscape. The market's potential is substantial, with a projected value of $xx million by 2033.
Energy Storage PCS Segmentation
-
1. Application
- 1.1. Large-Scale Energy Storage
- 1.2. Industrial And Commercial Energy Storage
-
2. Types
- 2.1. Below 10 KW
- 2.2. 10 - 250 KW
- 2.3. 250 - 1000 KW
- 2.4. Above 1000 KW
Energy Storage PCS Segmentation By Geography
-
1. North America
- 1.1. United States
- 1.2. Canada
- 1.3. Mexico
-
2. South America
- 2.1. Brazil
- 2.2. Argentina
- 2.3. Rest of South America
-
3. Europe
- 3.1. United Kingdom
- 3.2. Germany
- 3.3. France
- 3.4. Italy
- 3.5. Spain
- 3.6. Russia
- 3.7. Benelux
- 3.8. Nordics
- 3.9. Rest of Europe
-
4. Middle East & Africa
- 4.1. Turkey
- 4.2. Israel
- 4.3. GCC
- 4.4. North Africa
- 4.5. South Africa
- 4.6. Rest of Middle East & Africa
-
5. Asia Pacific
- 5.1. China
- 5.2. India
- 5.3. Japan
- 5.4. South Korea
- 5.5. ASEAN
- 5.6. Oceania
- 5.7. Rest of Asia Pacific
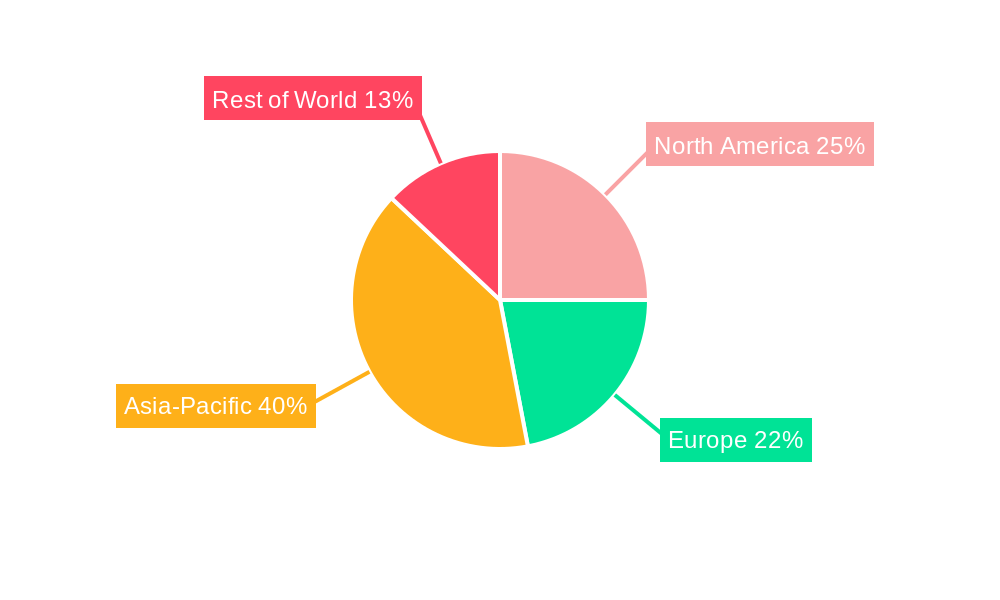
Energy Storage PCS Regional Market Share
Geographic Coverage of Energy Storage PCS
Energy Storage PCS REPORT HIGHLIGHTS
| Aspects | Details |
|---|---|
| Study Period | 2020-2034 |
| Base Year | 2025 |
| Estimated Year | 2026 |
| Forecast Period | 2026-2034 |
| Historical Period | 2020-2025 |
| Growth Rate | CAGR of 8.3% from 2020-2034 |
| Segmentation |
|
Table of Contents
- 1. Introduction
- 1.1. Research Scope
- 1.2. Market Segmentation
- 1.3. Research Methodology
- 1.4. Definitions and Assumptions
- 2. Executive Summary
- 2.1. Introduction
- 3. Market Dynamics
- 3.1. Introduction
- 3.2. Market Drivers
- 3.3. Market Restrains
- 3.4. Market Trends
- 4. Market Factor Analysis
- 4.1. Porters Five Forces
- 4.2. Supply/Value Chain
- 4.3. PESTEL analysis
- 4.4. Market Entropy
- 4.5. Patent/Trademark Analysis
- 5. Global Energy Storage PCS Analysis, Insights and Forecast, 2020-2032
- 5.1. Market Analysis, Insights and Forecast - by Application
- 5.1.1. Large-Scale Energy Storage
- 5.1.2. Industrial And Commercial Energy Storage
- 5.2. Market Analysis, Insights and Forecast - by Types
- 5.2.1. Below 10 KW
- 5.2.2. 10 - 250 KW
- 5.2.3. 250 - 1000 KW
- 5.2.4. Above 1000 KW
- 5.3. Market Analysis, Insights and Forecast - by Region
- 5.3.1. North America
- 5.3.2. South America
- 5.3.3. Europe
- 5.3.4. Middle East & Africa
- 5.3.5. Asia Pacific
- 5.1. Market Analysis, Insights and Forecast - by Application
- 6. North America Energy Storage PCS Analysis, Insights and Forecast, 2020-2032
- 6.1. Market Analysis, Insights and Forecast - by Application
- 6.1.1. Large-Scale Energy Storage
- 6.1.2. Industrial And Commercial Energy Storage
- 6.2. Market Analysis, Insights and Forecast - by Types
- 6.2.1. Below 10 KW
- 6.2.2. 10 - 250 KW
- 6.2.3. 250 - 1000 KW
- 6.2.4. Above 1000 KW
- 6.1. Market Analysis, Insights and Forecast - by Application
- 7. South America Energy Storage PCS Analysis, Insights and Forecast, 2020-2032
- 7.1. Market Analysis, Insights and Forecast - by Application
- 7.1.1. Large-Scale Energy Storage
- 7.1.2. Industrial And Commercial Energy Storage
- 7.2. Market Analysis, Insights and Forecast - by Types
- 7.2.1. Below 10 KW
- 7.2.2. 10 - 250 KW
- 7.2.3. 250 - 1000 KW
- 7.2.4. Above 1000 KW
- 7.1. Market Analysis, Insights and Forecast - by Application
- 8. Europe Energy Storage PCS Analysis, Insights and Forecast, 2020-2032
- 8.1. Market Analysis, Insights and Forecast - by Application
- 8.1.1. Large-Scale Energy Storage
- 8.1.2. Industrial And Commercial Energy Storage
- 8.2. Market Analysis, Insights and Forecast - by Types
- 8.2.1. Below 10 KW
- 8.2.2. 10 - 250 KW
- 8.2.3. 250 - 1000 KW
- 8.2.4. Above 1000 KW
- 8.1. Market Analysis, Insights and Forecast - by Application
- 9. Middle East & Africa Energy Storage PCS Analysis, Insights and Forecast, 2020-2032
- 9.1. Market Analysis, Insights and Forecast - by Application
- 9.1.1. Large-Scale Energy Storage
- 9.1.2. Industrial And Commercial Energy Storage
- 9.2. Market Analysis, Insights and Forecast - by Types
- 9.2.1. Below 10 KW
- 9.2.2. 10 - 250 KW
- 9.2.3. 250 - 1000 KW
- 9.2.4. Above 1000 KW
- 9.1. Market Analysis, Insights and Forecast - by Application
- 10. Asia Pacific Energy Storage PCS Analysis, Insights and Forecast, 2020-2032
- 10.1. Market Analysis, Insights and Forecast - by Application
- 10.1.1. Large-Scale Energy Storage
- 10.1.2. Industrial And Commercial Energy Storage
- 10.2. Market Analysis, Insights and Forecast - by Types
- 10.2.1. Below 10 KW
- 10.2.2. 10 - 250 KW
- 10.2.3. 250 - 1000 KW
- 10.2.4. Above 1000 KW
- 10.1. Market Analysis, Insights and Forecast - by Application
- 11. Competitive Analysis
- 11.1. Global Market Share Analysis 2025
- 11.2. Company Profiles
- 11.2.1 SUNGROW
- 11.2.1.1. Overview
- 11.2.1.2. Products
- 11.2.1.3. SWOT Analysis
- 11.2.1.4. Recent Developments
- 11.2.1.5. Financials (Based on Availability)
- 11.2.2 Power Electronics
- 11.2.2.1. Overview
- 11.2.2.2. Products
- 11.2.2.3. SWOT Analysis
- 11.2.2.4. Recent Developments
- 11.2.2.5. Financials (Based on Availability)
- 11.2.3 SMA
- 11.2.3.1. Overview
- 11.2.3.2. Products
- 11.2.3.3. SWOT Analysis
- 11.2.3.4. Recent Developments
- 11.2.3.5. Financials (Based on Availability)
- 11.2.4 Tesla
- 11.2.4.1. Overview
- 11.2.4.2. Products
- 11.2.4.3. SWOT Analysis
- 11.2.4.4. Recent Developments
- 11.2.4.5. Financials (Based on Availability)
- 11.2.5 Guangzhou Zhiguang ENERGY Storage Technology
- 11.2.5.1. Overview
- 11.2.5.2. Products
- 11.2.5.3. SWOT Analysis
- 11.2.5.4. Recent Developments
- 11.2.5.5. Financials (Based on Availability)
- 11.2.6 SolarEdge
- 11.2.6.1. Overview
- 11.2.6.2. Products
- 11.2.6.3. SWOT Analysis
- 11.2.6.4. Recent Developments
- 11.2.6.5. Financials (Based on Availability)
- 11.2.7 Ingeteam
- 11.2.7.1. Overview
- 11.2.7.2. Products
- 11.2.7.3. SWOT Analysis
- 11.2.7.4. Recent Developments
- 11.2.7.5. Financials (Based on Availability)
- 11.2.8 Beijing Soaring Electric Technology
- 11.2.8.1. Overview
- 11.2.8.2. Products
- 11.2.8.3. SWOT Analysis
- 11.2.8.4. Recent Developments
- 11.2.8.5. Financials (Based on Availability)
- 11.2.9 Shenzhen Sinexcel Electric
- 11.2.9.1. Overview
- 11.2.9.2. Products
- 11.2.9.3. SWOT Analysis
- 11.2.9.4. Recent Developments
- 11.2.9.5. Financials (Based on Availability)
- 11.2.10 NR Engineering
- 11.2.10.1. Overview
- 11.2.10.2. Products
- 11.2.10.3. SWOT Analysis
- 11.2.10.4. Recent Developments
- 11.2.10.5. Financials (Based on Availability)
- 11.2.11 SHENZHEN HOPEWIND ELECTRIC
- 11.2.11.1. Overview
- 11.2.11.2. Products
- 11.2.11.3. SWOT Analysis
- 11.2.11.4. Recent Developments
- 11.2.11.5. Financials (Based on Availability)
- 11.2.12 Kehua
- 11.2.12.1. Overview
- 11.2.12.2. Products
- 11.2.12.3. SWOT Analysis
- 11.2.12.4. Recent Developments
- 11.2.12.5. Financials (Based on Availability)
- 11.2.13 XJ ELECTRIC
- 11.2.13.1. Overview
- 11.2.13.2. Products
- 11.2.13.3. SWOT Analysis
- 11.2.13.4. Recent Developments
- 11.2.13.5. Financials (Based on Availability)
- 11.2.14 GoodWe
- 11.2.14.1. Overview
- 11.2.14.2. Products
- 11.2.14.3. SWOT Analysis
- 11.2.14.4. Recent Developments
- 11.2.14.5. Financials (Based on Availability)
- 11.2.15 HUAWEI
- 11.2.15.1. Overview
- 11.2.15.2. Products
- 11.2.15.3. SWOT Analysis
- 11.2.15.4. Recent Developments
- 11.2.15.5. Financials (Based on Availability)
- 11.2.16 Dynapower
- 11.2.16.1. Overview
- 11.2.16.2. Products
- 11.2.16.3. SWOT Analysis
- 11.2.16.4. Recent Developments
- 11.2.16.5. Financials (Based on Availability)
- 11.2.17 Zhuzhou CRRC Times Electric
- 11.2.17.1. Overview
- 11.2.17.2. Products
- 11.2.17.3. SWOT Analysis
- 11.2.17.4. Recent Developments
- 11.2.17.5. Financials (Based on Availability)
- 11.2.18 Beijing In-Power Electric
- 11.2.18.1. Overview
- 11.2.18.2. Products
- 11.2.18.3. SWOT Analysis
- 11.2.18.4. Recent Developments
- 11.2.18.5. Financials (Based on Availability)
- 11.2.19 Nidec
- 11.2.19.1. Overview
- 11.2.19.2. Products
- 11.2.19.3. SWOT Analysis
- 11.2.19.4. Recent Developments
- 11.2.19.5. Financials (Based on Availability)
- 11.2.20 EPC Power
- 11.2.20.1. Overview
- 11.2.20.2. Products
- 11.2.20.3. SWOT Analysis
- 11.2.20.4. Recent Developments
- 11.2.20.5. Financials (Based on Availability)
- 11.2.21 Shenzhen Inovance Technology
- 11.2.21.1. Overview
- 11.2.21.2. Products
- 11.2.21.3. SWOT Analysis
- 11.2.21.4. Recent Developments
- 11.2.21.5. Financials (Based on Availability)
- 11.2.22 Growatt
- 11.2.22.1. Overview
- 11.2.22.2. Products
- 11.2.22.3. SWOT Analysis
- 11.2.22.4. Recent Developments
- 11.2.22.5. Financials (Based on Availability)
- 11.2.23 GE
- 11.2.23.1. Overview
- 11.2.23.2. Products
- 11.2.23.3. SWOT Analysis
- 11.2.23.4. Recent Developments
- 11.2.23.5. Financials (Based on Availability)
- 11.2.24 Shenzhen Sofarsolar
- 11.2.24.1. Overview
- 11.2.24.2. Products
- 11.2.24.3. SWOT Analysis
- 11.2.24.4. Recent Developments
- 11.2.24.5. Financials (Based on Availability)
- 11.2.25 Shenzhen Kstar Science and Technology
- 11.2.25.1. Overview
- 11.2.25.2. Products
- 11.2.25.3. SWOT Analysis
- 11.2.25.4. Recent Developments
- 11.2.25.5. Financials (Based on Availability)
- 11.2.26 TMEIC
- 11.2.26.1. Overview
- 11.2.26.2. Products
- 11.2.26.3. SWOT Analysis
- 11.2.26.4. Recent Developments
- 11.2.26.5. Financials (Based on Availability)
- 11.2.27 Sineng Electric
- 11.2.27.1. Overview
- 11.2.27.2. Products
- 11.2.27.3. SWOT Analysis
- 11.2.27.4. Recent Developments
- 11.2.27.5. Financials (Based on Availability)
- 11.2.28 eks Energy
- 11.2.28.1. Overview
- 11.2.28.2. Products
- 11.2.28.3. SWOT Analysis
- 11.2.28.4. Recent Developments
- 11.2.28.5. Financials (Based on Availability)
- 11.2.29 WSTECH
- 11.2.29.1. Overview
- 11.2.29.2. Products
- 11.2.29.3. SWOT Analysis
- 11.2.29.4. Recent Developments
- 11.2.29.5. Financials (Based on Availability)
- 11.2.1 SUNGROW
List of Figures
- Figure 1: Global Energy Storage PCS Revenue Breakdown (million, %) by Region 2025 & 2033
- Figure 2: North America Energy Storage PCS Revenue (million), by Application 2025 & 2033
- Figure 3: North America Energy Storage PCS Revenue Share (%), by Application 2025 & 2033
- Figure 4: North America Energy Storage PCS Revenue (million), by Types 2025 & 2033
- Figure 5: North America Energy Storage PCS Revenue Share (%), by Types 2025 & 2033
- Figure 6: North America Energy Storage PCS Revenue (million), by Country 2025 & 2033
- Figure 7: North America Energy Storage PCS Revenue Share (%), by Country 2025 & 2033
- Figure 8: South America Energy Storage PCS Revenue (million), by Application 2025 & 2033
- Figure 9: South America Energy Storage PCS Revenue Share (%), by Application 2025 & 2033
- Figure 10: South America Energy Storage PCS Revenue (million), by Types 2025 & 2033
- Figure 11: South America Energy Storage PCS Revenue Share (%), by Types 2025 & 2033
- Figure 12: South America Energy Storage PCS Revenue (million), by Country 2025 & 2033
- Figure 13: South America Energy Storage PCS Revenue Share (%), by Country 2025 & 2033
- Figure 14: Europe Energy Storage PCS Revenue (million), by Application 2025 & 2033
- Figure 15: Europe Energy Storage PCS Revenue Share (%), by Application 2025 & 2033
- Figure 16: Europe Energy Storage PCS Revenue (million), by Types 2025 & 2033
- Figure 17: Europe Energy Storage PCS Revenue Share (%), by Types 2025 & 2033
- Figure 18: Europe Energy Storage PCS Revenue (million), by Country 2025 & 2033
- Figure 19: Europe Energy Storage PCS Revenue Share (%), by Country 2025 & 2033
- Figure 20: Middle East & Africa Energy Storage PCS Revenue (million), by Application 2025 & 2033
- Figure 21: Middle East & Africa Energy Storage PCS Revenue Share (%), by Application 2025 & 2033
- Figure 22: Middle East & Africa Energy Storage PCS Revenue (million), by Types 2025 & 2033
- Figure 23: Middle East & Africa Energy Storage PCS Revenue Share (%), by Types 2025 & 2033
- Figure 24: Middle East & Africa Energy Storage PCS Revenue (million), by Country 2025 & 2033
- Figure 25: Middle East & Africa Energy Storage PCS Revenue Share (%), by Country 2025 & 2033
- Figure 26: Asia Pacific Energy Storage PCS Revenue (million), by Application 2025 & 2033
- Figure 27: Asia Pacific Energy Storage PCS Revenue Share (%), by Application 2025 & 2033
- Figure 28: Asia Pacific Energy Storage PCS Revenue (million), by Types 2025 & 2033
- Figure 29: Asia Pacific Energy Storage PCS Revenue Share (%), by Types 2025 & 2033
- Figure 30: Asia Pacific Energy Storage PCS Revenue (million), by Country 2025 & 2033
- Figure 31: Asia Pacific Energy Storage PCS Revenue Share (%), by Country 2025 & 2033
List of Tables
- Table 1: Global Energy Storage PCS Revenue million Forecast, by Application 2020 & 2033
- Table 2: Global Energy Storage PCS Revenue million Forecast, by Types 2020 & 2033
- Table 3: Global Energy Storage PCS Revenue million Forecast, by Region 2020 & 2033
- Table 4: Global Energy Storage PCS Revenue million Forecast, by Application 2020 & 2033
- Table 5: Global Energy Storage PCS Revenue million Forecast, by Types 2020 & 2033
- Table 6: Global Energy Storage PCS Revenue million Forecast, by Country 2020 & 2033
- Table 7: United States Energy Storage PCS Revenue (million) Forecast, by Application 2020 & 2033
- Table 8: Canada Energy Storage PCS Revenue (million) Forecast, by Application 2020 & 2033
- Table 9: Mexico Energy Storage PCS Revenue (million) Forecast, by Application 2020 & 2033
- Table 10: Global Energy Storage PCS Revenue million Forecast, by Application 2020 & 2033
- Table 11: Global Energy Storage PCS Revenue million Forecast, by Types 2020 & 2033
- Table 12: Global Energy Storage PCS Revenue million Forecast, by Country 2020 & 2033
- Table 13: Brazil Energy Storage PCS Revenue (million) Forecast, by Application 2020 & 2033
- Table 14: Argentina Energy Storage PCS Revenue (million) Forecast, by Application 2020 & 2033
- Table 15: Rest of South America Energy Storage PCS Revenue (million) Forecast, by Application 2020 & 2033
- Table 16: Global Energy Storage PCS Revenue million Forecast, by Application 2020 & 2033
- Table 17: Global Energy Storage PCS Revenue million Forecast, by Types 2020 & 2033
- Table 18: Global Energy Storage PCS Revenue million Forecast, by Country 2020 & 2033
- Table 19: United Kingdom Energy Storage PCS Revenue (million) Forecast, by Application 2020 & 2033
- Table 20: Germany Energy Storage PCS Revenue (million) Forecast, by Application 2020 & 2033
- Table 21: France Energy Storage PCS Revenue (million) Forecast, by Application 2020 & 2033
- Table 22: Italy Energy Storage PCS Revenue (million) Forecast, by Application 2020 & 2033
- Table 23: Spain Energy Storage PCS Revenue (million) Forecast, by Application 2020 & 2033
- Table 24: Russia Energy Storage PCS Revenue (million) Forecast, by Application 2020 & 2033
- Table 25: Benelux Energy Storage PCS Revenue (million) Forecast, by Application 2020 & 2033
- Table 26: Nordics Energy Storage PCS Revenue (million) Forecast, by Application 2020 & 2033
- Table 27: Rest of Europe Energy Storage PCS Revenue (million) Forecast, by Application 2020 & 2033
- Table 28: Global Energy Storage PCS Revenue million Forecast, by Application 2020 & 2033
- Table 29: Global Energy Storage PCS Revenue million Forecast, by Types 2020 & 2033
- Table 30: Global Energy Storage PCS Revenue million Forecast, by Country 2020 & 2033
- Table 31: Turkey Energy Storage PCS Revenue (million) Forecast, by Application 2020 & 2033
- Table 32: Israel Energy Storage PCS Revenue (million) Forecast, by Application 2020 & 2033
- Table 33: GCC Energy Storage PCS Revenue (million) Forecast, by Application 2020 & 2033
- Table 34: North Africa Energy Storage PCS Revenue (million) Forecast, by Application 2020 & 2033
- Table 35: South Africa Energy Storage PCS Revenue (million) Forecast, by Application 2020 & 2033
- Table 36: Rest of Middle East & Africa Energy Storage PCS Revenue (million) Forecast, by Application 2020 & 2033
- Table 37: Global Energy Storage PCS Revenue million Forecast, by Application 2020 & 2033
- Table 38: Global Energy Storage PCS Revenue million Forecast, by Types 2020 & 2033
- Table 39: Global Energy Storage PCS Revenue million Forecast, by Country 2020 & 2033
- Table 40: China Energy Storage PCS Revenue (million) Forecast, by Application 2020 & 2033
- Table 41: India Energy Storage PCS Revenue (million) Forecast, by Application 2020 & 2033
- Table 42: Japan Energy Storage PCS Revenue (million) Forecast, by Application 2020 & 2033
- Table 43: South Korea Energy Storage PCS Revenue (million) Forecast, by Application 2020 & 2033
- Table 44: ASEAN Energy Storage PCS Revenue (million) Forecast, by Application 2020 & 2033
- Table 45: Oceania Energy Storage PCS Revenue (million) Forecast, by Application 2020 & 2033
- Table 46: Rest of Asia Pacific Energy Storage PCS Revenue (million) Forecast, by Application 2020 & 2033
Frequently Asked Questions
1. What is the projected Compound Annual Growth Rate (CAGR) of the Energy Storage PCS?
The projected CAGR is approximately 8.3%.
2. Which companies are prominent players in the Energy Storage PCS?
Key companies in the market include SUNGROW, Power Electronics, SMA, Tesla, Guangzhou Zhiguang ENERGY Storage Technology, SolarEdge, Ingeteam, Beijing Soaring Electric Technology, Shenzhen Sinexcel Electric, NR Engineering, SHENZHEN HOPEWIND ELECTRIC, Kehua, XJ ELECTRIC, GoodWe, HUAWEI, Dynapower, Zhuzhou CRRC Times Electric, Beijing In-Power Electric, Nidec, EPC Power, Shenzhen Inovance Technology, Growatt, GE, Shenzhen Sofarsolar, Shenzhen Kstar Science and Technology, TMEIC, Sineng Electric, eks Energy, WSTECH.
3. What are the main segments of the Energy Storage PCS?
The market segments include Application, Types.
4. Can you provide details about the market size?
The market size is estimated to be USD 7164 million as of 2022.
5. What are some drivers contributing to market growth?
N/A
6. What are the notable trends driving market growth?
N/A
7. Are there any restraints impacting market growth?
N/A
8. Can you provide examples of recent developments in the market?
N/A
9. What pricing options are available for accessing the report?
Pricing options include single-user, multi-user, and enterprise licenses priced at USD 4900.00, USD 7350.00, and USD 9800.00 respectively.
10. Is the market size provided in terms of value or volume?
The market size is provided in terms of value, measured in million.
11. Are there any specific market keywords associated with the report?
Yes, the market keyword associated with the report is "Energy Storage PCS," which aids in identifying and referencing the specific market segment covered.
12. How do I determine which pricing option suits my needs best?
The pricing options vary based on user requirements and access needs. Individual users may opt for single-user licenses, while businesses requiring broader access may choose multi-user or enterprise licenses for cost-effective access to the report.
13. Are there any additional resources or data provided in the Energy Storage PCS report?
While the report offers comprehensive insights, it's advisable to review the specific contents or supplementary materials provided to ascertain if additional resources or data are available.
14. How can I stay updated on further developments or reports in the Energy Storage PCS?
To stay informed about further developments, trends, and reports in the Energy Storage PCS, consider subscribing to industry newsletters, following relevant companies and organizations, or regularly checking reputable industry news sources and publications.
Methodology
Step 1 - Identification of Relevant Samples Size from Population Database


Step 2 - Approaches for Defining Global Market Size (Value, Volume* & Price*)

Note*: In applicable scenarios
Step 3 - Data Sources
Primary Research
- Web Analytics
- Survey Reports
- Research Institute
- Latest Research Reports
- Opinion Leaders
Secondary Research
- Annual Reports
- White Paper
- Latest Press Release
- Industry Association
- Paid Database
- Investor Presentations

Step 4 - Data Triangulation
Involves using different sources of information in order to increase the validity of a study
These sources are likely to be stakeholders in a program - participants, other researchers, program staff, other community members, and so on.
Then we put all data in single framework & apply various statistical tools to find out the dynamic on the market.
During the analysis stage, feedback from the stakeholder groups would be compared to determine areas of agreement as well as areas of divergence