

Key Insights
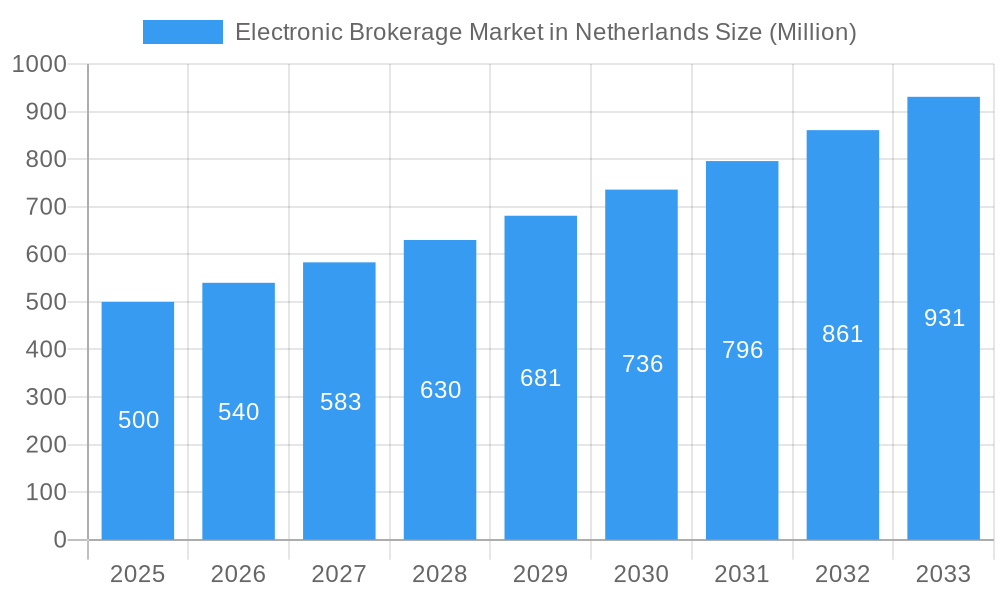
The Netherlands' electronic brokerage market is experiencing robust expansion, driven by increasing digital adoption and the proliferation of advanced online trading platforms. The market size is projected to reach €1.12 billion by 2024, with a Compound Annual Growth Rate (CAGR) of 7.3%. Factors such as high smartphone penetration, enhanced internet infrastructure, and a growing base of digitally-native investors are fueling this upward trend. The inherent convenience and cost-effectiveness of electronic brokerage services further contribute to this positive momentum. Additionally, regulatory advancements focused on market transparency and investor protection are bolstering confidence and participation.
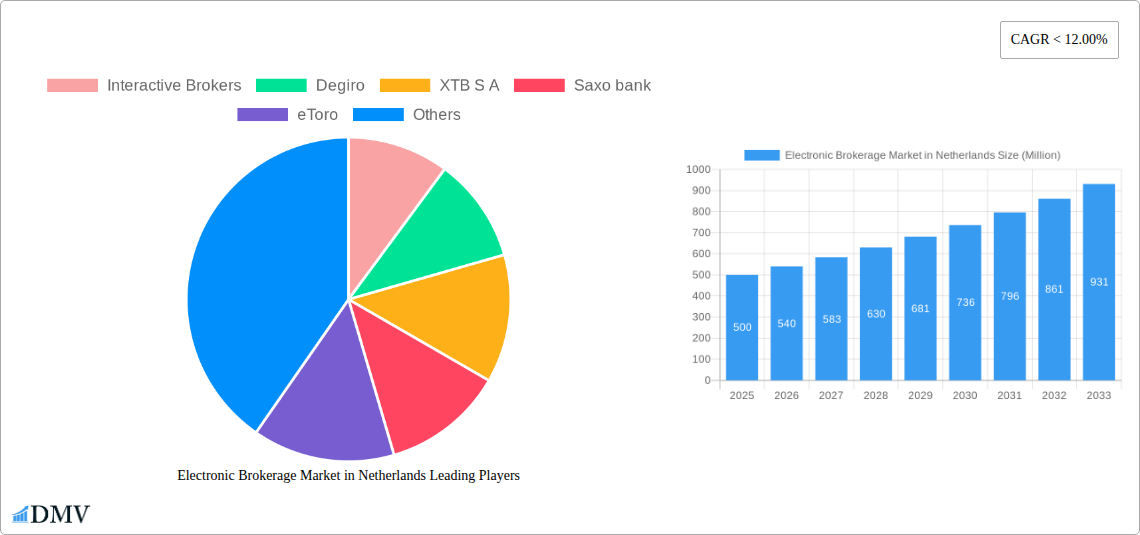
Electronic Brokerage Market in Netherlands Market Size (In Billion)
The forecast period (2025-2033) anticipates sustained growth, largely influenced by technological innovations like robo-advisors and AI-powered investment tools. Increased competition among brokerage firms is expected to yield more competitive pricing and superior service offerings for consumers. Nevertheless, addressing cybersecurity threats and maintaining investor trust are critical for ensuring the market's long-term viability and expansion. Future success will depend on the continuous innovation and adaptability of brokerage firms to meet the evolving demands of the digitally-savvy Dutch investor.
Electronic Brokerage Market in Netherlands Company Market Share
Netherlands Electronic Brokerage Market Analysis: 2019-2033
This comprehensive report analyzes the electronic brokerage market in the Netherlands, providing insights into market dynamics, competitive strategies, and future growth potential. The study encompasses the period from 2019 to 2033, with 2024 serving as the base year and the forecast period extending from 2025 to 2033. It examines key market segments, leading participants, and pivotal industry developments, offering actionable intelligence for strategic planning.
Electronic Brokerage Market in Netherlands Market Composition & Trends
This section evaluates the market concentration, innovation drivers, regulatory environment, substitute products, end-user profiles, and mergers & acquisitions (M&A) activities within the Dutch electronic brokerage market. The analysis incorporates market share distribution and M&A deal values to provide a clear picture of the competitive dynamics.
Market Concentration: The Dutch electronic brokerage market exhibits a moderately concentrated structure, with a few major players holding significant market share. The exact distribution is under analysis, but preliminary findings suggest a top 5 market share of approximately xx%.
Innovation Catalysts: Technological advancements, such as AI-powered trading platforms and mobile-first trading apps, are driving innovation. The increasing demand for personalized investment solutions and fractional trading is also fueling innovation within the market.
Regulatory Landscape: The regulatory framework in the Netherlands influences the operational environment and requires compliance with AML (Anti-Money Laundering) and KYC (Know Your Customer) regulations. These regulatory requirements impact operational costs and strategic decisions.
Substitute Products: Traditional brokerage services and direct investment in assets present alternative options to electronic brokerage. The competitive threat from these substitutes is moderate but requires consideration within the market analysis.
End-User Profiles: The market caters to a diverse range of end-users, including individual investors, institutional investors, and high-net-worth individuals. The growth in retail investor participation, particularly among younger demographics, is notable.
M&A Activities: Significant M&A activity has shaped the market landscape. For instance, the acquisition of a majority stake in DEGIRO by Flatex in 2020 involved a total transaction value exceeding EUR 36.4 Million. Further, this deal significantly altered the competitive dynamics and market consolidation.
Electronic Brokerage Market in Netherlands Industry Evolution
This section meticulously examines the evolution of the Dutch electronic brokerage market, analyzing growth trajectories, technological progress, and shifting consumer preferences over the study period (2019-2024). Specific data points, including growth rates and adoption metrics, are presented.
The market has experienced consistent growth fueled by increasing internet and smartphone penetration. The adoption of online trading platforms has accelerated, driven by convenience and accessibility. From 2019 to 2024, the market is estimated to have grown at a CAGR of xx%. Technological advancements such as mobile trading apps, algorithmic trading, and robo-advisors have significantly influenced market expansion. Changes in consumer behavior, including a preference for low-cost trading and diversified investment options, have also contributed to this growth. The increasing adoption of ETFs and cryptocurrencies among retail investors adds further dynamism to the market. The period from 2025 to 2033 is predicted to reflect a continuing but potentially moderating CAGR of xx%, owing to increased market maturity and a possible slowing of the tech adoption rate. Competition from established players and new entrants will play a pivotal role in influencing the growth trajectory.
Leading Regions, Countries, or Segments in Electronic Brokerage Market in Netherlands
This section identifies the dominant regions, countries, or segments within the Netherlands electronic brokerage market.
- Key Drivers:
- High internet and smartphone penetration: Facilitates widespread access to online trading platforms.
- Growing retail investor participation: Fueled by awareness and ease of access.
- Favorable regulatory environment: Encourages innovation and market growth.
- Technological advancements: Providing efficient and convenient trading solutions.
The Netherlands' centralized financial market and its strong regulatory infrastructure attract significant investment, resulting in a robust electronic brokerage ecosystem. The major urban centers exhibit the highest concentration of brokerage activities, benefiting from the high concentration of high-net-worth individuals and sophisticated investors. However, the market is witnessing significant growth in less urbanized areas, driven by improved internet access and the rising popularity of online trading. The retail segment is experiencing the most rapid growth, driven by the increasing accessibility and affordability of online trading platforms. Further growth depends on effective financial literacy campaigns and the increasing use of mobile trading apps.
Electronic Brokerage Market in Netherlands Product Innovations
The Dutch electronic brokerage market witnesses continuous product innovation, emphasizing user-friendly interfaces, advanced trading tools, and personalized investment solutions. Platforms are incorporating AI-driven features for portfolio optimization and risk management, enhancing the overall trading experience. The integration of cryptocurrency trading capabilities and fractional share trading further broadens product offerings and caters to evolving investor preferences. These advancements are central to attracting and retaining customers and remain key differentiators.
Propelling Factors for Electronic Brokerage Market in Netherlands Growth
The growth of the Netherlands electronic brokerage market is fueled by several factors:
Technological Advancements: Mobile trading apps, advanced charting tools, and AI-powered trading assistance significantly enhance user experience and attract a wider range of investors.
Economic Factors: The relatively strong and stable Dutch economy encourages investment activity, directly impacting brokerage service demand.
Regulatory Support: A clear and supportive regulatory environment fosters trust and attracts both domestic and international investors.
Obstacles in the Electronic Brokerage Market in Netherlands Market
Several challenges hinder market growth:
Regulatory Compliance: Meeting stringent AML and KYC regulations adds operational complexity and increases costs for brokers.
Cybersecurity Threats: The increasing reliance on digital platforms necessitates robust security measures to mitigate cyber threats and protect investor data.
Competition: Intense competition from established and emerging players leads to price wars and pressures on profit margins.
Future Opportunities in Electronic Brokerage Market in Netherlands
Future growth hinges on:
Expansion into underserved markets: Targeting niche segments and geographically dispersed investors will unlock further growth.
Technological advancements: Exploring new technologies, like blockchain, for improved transparency and efficiency.
Growth of fintech: Strategic partnerships with fintech companies to enhance service offerings and reach a larger audience.
Major Players in the Electronic Brokerage Market in Netherlands Ecosystem
- Interactive Brokers
- Degiro
- XTB S A
- Saxo bank
- eToro
- Euronext Group
- LYNX
- IC Markets
- RoboForex
- FP Markets
List Not Exhaustive
Key Developments in Electronic Brokerage Market in Netherlands Industry
- September 2022: Scalable Capital expands into the Netherlands, offering trading and saving plans.
- 2020: Flatex acquires 100% of DEGIRO B.V. for a total transaction value exceeding EUR 60 Million.
Strategic Electronic Brokerage Market in Netherlands Market Forecast
The Netherlands electronic brokerage market is poised for continued growth driven by technological innovation, increasing retail investor participation, and a favorable regulatory environment. The market is expected to witness expansion in both the number of users and the transaction volume. The forecast period (2025-2033) is projected to demonstrate consistent growth, although potentially at a moderated pace due to market saturation and increased competition. The continued adoption of mobile trading and AI-driven investment tools will be key drivers of growth during the forecast period.
Electronic Brokerage Market in Netherlands Segmentation
-
1. Investor Type
- 1.1. Retail
- 1.2. Institutional
-
2. Services Provided
- 2.1. Full Time Brokers
- 2.2. Discount Brokers
-
3. Operation
- 3.1. Domestic
- 3.2. International
Electronic Brokerage Market in Netherlands Segmentation By Geography
-
1. North America
- 1.1. United States
- 1.2. Canada
- 1.3. Mexico
-
2. South America
- 2.1. Brazil
- 2.2. Argentina
- 2.3. Rest of South America
-
3. Europe
- 3.1. United Kingdom
- 3.2. Germany
- 3.3. France
- 3.4. Italy
- 3.5. Spain
- 3.6. Russia
- 3.7. Benelux
- 3.8. Nordics
- 3.9. Rest of Europe
-
4. Middle East & Africa
- 4.1. Turkey
- 4.2. Israel
- 4.3. GCC
- 4.4. North Africa
- 4.5. South Africa
- 4.6. Rest of Middle East & Africa
-
5. Asia Pacific
- 5.1. China
- 5.2. India
- 5.3. Japan
- 5.4. South Korea
- 5.5. ASEAN
- 5.6. Oceania
- 5.7. Rest of Asia Pacific
Electronic Brokerage Market in Netherlands Regional Market Share
Geographic Coverage of Electronic Brokerage Market in Netherlands
Electronic Brokerage Market in Netherlands REPORT HIGHLIGHTS
| Aspects | Details |
|---|---|
| Study Period | 2020-2034 |
| Base Year | 2025 |
| Estimated Year | 2026 |
| Forecast Period | 2026-2034 |
| Historical Period | 2020-2025 |
| Growth Rate | CAGR of 7.3% from 2020-2034 |
| Segmentation |
|
Table of Contents
- 1. Introduction
- 1.1. Research Scope
- 1.2. Market Segmentation
- 1.3. Research Objective
- 1.4. Definitions and Assumptions
- 2. Executive Summary
- 2.1. Market Snapshot
- 3. Market Dynamics
- 3.1. Market Drivers
- 3.2. Market Restrains
- 3.3. Market Trends
- 3.4. Market Opportunities
- 4. Market Factor Analysis
- 4.1. Porters Five Forces
- 4.1.1. Bargaining Power of Suppliers
- 4.1.2. Bargaining Power of Buyers
- 4.1.3. Threat of New Entrants
- 4.1.4. Threat of Substitutes
- 4.1.5. Competitive Rivalry
- 4.2. PESTEL analysis
- 4.3. BCG Analysis
- 4.3.1. Stars (High Growth, High Market Share)
- 4.3.2. Cash Cows (Low Growth, High Market Share)
- 4.3.3. Question Mark (High Growth, Low Market Share)
- 4.3.4. Dogs (Low Growth, Low Market Share)
- 4.4. Ansoff Matrix Analysis
- 4.5. Supply Chain Analysis
- 4.6. Regulatory Landscape
- 4.7. Current Market Potential and Opportunity Assessment (TAM–SAM–SOM Framework)
- 4.8. DMV Analyst Note
- 4.1. Porters Five Forces
- 5. Market Analysis, Insights and Forecast 2021-2033
- 5.1. Market Analysis, Insights and Forecast - by Investor Type
- 5.1.1. Retail
- 5.1.2. Institutional
- 5.2. Market Analysis, Insights and Forecast - by Services Provided
- 5.2.1. Full Time Brokers
- 5.2.2. Discount Brokers
- 5.3. Market Analysis, Insights and Forecast - by Operation
- 5.3.1. Domestic
- 5.3.2. International
- 5.4. Market Analysis, Insights and Forecast - by Region
- 5.4.1. North America
- 5.4.2. South America
- 5.4.3. Europe
- 5.4.4. Middle East & Africa
- 5.4.5. Asia Pacific
- 5.1. Market Analysis, Insights and Forecast - by Investor Type
- 6. Global Electronic Brokerage Market in Netherlands Analysis, Insights and Forecast, 2021-2033
- 6.1. Market Analysis, Insights and Forecast - by Investor Type
- 6.1.1. Retail
- 6.1.2. Institutional
- 6.2. Market Analysis, Insights and Forecast - by Services Provided
- 6.2.1. Full Time Brokers
- 6.2.2. Discount Brokers
- 6.3. Market Analysis, Insights and Forecast - by Operation
- 6.3.1. Domestic
- 6.3.2. International
- 6.1. Market Analysis, Insights and Forecast - by Investor Type
- 7. North America Electronic Brokerage Market in Netherlands Analysis, Insights and Forecast, 2020-2032
- 7.1. Market Analysis, Insights and Forecast - by Investor Type
- 7.1.1. Retail
- 7.1.2. Institutional
- 7.2. Market Analysis, Insights and Forecast - by Services Provided
- 7.2.1. Full Time Brokers
- 7.2.2. Discount Brokers
- 7.3. Market Analysis, Insights and Forecast - by Operation
- 7.3.1. Domestic
- 7.3.2. International
- 7.1. Market Analysis, Insights and Forecast - by Investor Type
- 8. South America Electronic Brokerage Market in Netherlands Analysis, Insights and Forecast, 2020-2032
- 8.1. Market Analysis, Insights and Forecast - by Investor Type
- 8.1.1. Retail
- 8.1.2. Institutional
- 8.2. Market Analysis, Insights and Forecast - by Services Provided
- 8.2.1. Full Time Brokers
- 8.2.2. Discount Brokers
- 8.3. Market Analysis, Insights and Forecast - by Operation
- 8.3.1. Domestic
- 8.3.2. International
- 8.1. Market Analysis, Insights and Forecast - by Investor Type
- 9. Europe Electronic Brokerage Market in Netherlands Analysis, Insights and Forecast, 2020-2032
- 9.1. Market Analysis, Insights and Forecast - by Investor Type
- 9.1.1. Retail
- 9.1.2. Institutional
- 9.2. Market Analysis, Insights and Forecast - by Services Provided
- 9.2.1. Full Time Brokers
- 9.2.2. Discount Brokers
- 9.3. Market Analysis, Insights and Forecast - by Operation
- 9.3.1. Domestic
- 9.3.2. International
- 9.1. Market Analysis, Insights and Forecast - by Investor Type
- 10. Middle East & Africa Electronic Brokerage Market in Netherlands Analysis, Insights and Forecast, 2020-2032
- 10.1. Market Analysis, Insights and Forecast - by Investor Type
- 10.1.1. Retail
- 10.1.2. Institutional
- 10.2. Market Analysis, Insights and Forecast - by Services Provided
- 10.2.1. Full Time Brokers
- 10.2.2. Discount Brokers
- 10.3. Market Analysis, Insights and Forecast - by Operation
- 10.3.1. Domestic
- 10.3.2. International
- 10.1. Market Analysis, Insights and Forecast - by Investor Type
- 11. Asia Pacific Electronic Brokerage Market in Netherlands Analysis, Insights and Forecast, 2020-2032
- 11.1. Market Analysis, Insights and Forecast - by Investor Type
- 11.1.1. Retail
- 11.1.2. Institutional
- 11.2. Market Analysis, Insights and Forecast - by Services Provided
- 11.2.1. Full Time Brokers
- 11.2.2. Discount Brokers
- 11.3. Market Analysis, Insights and Forecast - by Operation
- 11.3.1. Domestic
- 11.3.2. International
- 11.1. Market Analysis, Insights and Forecast - by Investor Type
- 12. Competitive Analysis
- 12.1. Company Profiles
- 12.1.1 Interactive Brokers
- 12.1.1.1. Company Overview
- 12.1.1.2. Products
- 12.1.1.3. Company Financials
- 12.1.1.4. SWOT Analysis
- 12.1.2 Degiro
- 12.1.2.1. Company Overview
- 12.1.2.2. Products
- 12.1.2.3. Company Financials
- 12.1.2.4. SWOT Analysis
- 12.1.3 XTB S A
- 12.1.3.1. Company Overview
- 12.1.3.2. Products
- 12.1.3.3. Company Financials
- 12.1.3.4. SWOT Analysis
- 12.1.4 Saxo bank
- 12.1.4.1. Company Overview
- 12.1.4.2. Products
- 12.1.4.3. Company Financials
- 12.1.4.4. SWOT Analysis
- 12.1.5 eToro
- 12.1.5.1. Company Overview
- 12.1.5.2. Products
- 12.1.5.3. Company Financials
- 12.1.5.4. SWOT Analysis
- 12.1.6 Euronext Group
- 12.1.6.1. Company Overview
- 12.1.6.2. Products
- 12.1.6.3. Company Financials
- 12.1.6.4. SWOT Analysis
- 12.1.7 LYNX
- 12.1.7.1. Company Overview
- 12.1.7.2. Products
- 12.1.7.3. Company Financials
- 12.1.7.4. SWOT Analysis
- 12.1.8 IC Markets
- 12.1.8.1. Company Overview
- 12.1.8.2. Products
- 12.1.8.3. Company Financials
- 12.1.8.4. SWOT Analysis
- 12.1.9 RoboForex
- 12.1.9.1. Company Overview
- 12.1.9.2. Products
- 12.1.9.3. Company Financials
- 12.1.9.4. SWOT Analysis
- 12.1.10 FP Markets**List Not Exhaustive
- 12.1.10.1. Company Overview
- 12.1.10.2. Products
- 12.1.10.3. Company Financials
- 12.1.10.4. SWOT Analysis
- 12.1.1 Interactive Brokers
- 12.2. Market Entropy
- 12.2.1 Company's Key Areas Served
- 12.2.2 Recent Developments
- 12.3. Company Market Share Analysis 2025
- 12.3.1 Top 5 Companies Market Share Analysis
- 12.3.2 Top 3 Companies Market Share Analysis
- 12.4. List of Potential Customers
- 13. Research Methodology
List of Figures
- Figure 1: Global Electronic Brokerage Market in Netherlands Revenue Breakdown (billion, %) by Region 2025 & 2033
- Figure 2: North America Electronic Brokerage Market in Netherlands Revenue (billion), by Investor Type 2025 & 2033
- Figure 3: North America Electronic Brokerage Market in Netherlands Revenue Share (%), by Investor Type 2025 & 2033
- Figure 4: North America Electronic Brokerage Market in Netherlands Revenue (billion), by Services Provided 2025 & 2033
- Figure 5: North America Electronic Brokerage Market in Netherlands Revenue Share (%), by Services Provided 2025 & 2033
- Figure 6: North America Electronic Brokerage Market in Netherlands Revenue (billion), by Operation 2025 & 2033
- Figure 7: North America Electronic Brokerage Market in Netherlands Revenue Share (%), by Operation 2025 & 2033
- Figure 8: North America Electronic Brokerage Market in Netherlands Revenue (billion), by Country 2025 & 2033
- Figure 9: North America Electronic Brokerage Market in Netherlands Revenue Share (%), by Country 2025 & 2033
- Figure 10: South America Electronic Brokerage Market in Netherlands Revenue (billion), by Investor Type 2025 & 2033
- Figure 11: South America Electronic Brokerage Market in Netherlands Revenue Share (%), by Investor Type 2025 & 2033
- Figure 12: South America Electronic Brokerage Market in Netherlands Revenue (billion), by Services Provided 2025 & 2033
- Figure 13: South America Electronic Brokerage Market in Netherlands Revenue Share (%), by Services Provided 2025 & 2033
- Figure 14: South America Electronic Brokerage Market in Netherlands Revenue (billion), by Operation 2025 & 2033
- Figure 15: South America Electronic Brokerage Market in Netherlands Revenue Share (%), by Operation 2025 & 2033
- Figure 16: South America Electronic Brokerage Market in Netherlands Revenue (billion), by Country 2025 & 2033
- Figure 17: South America Electronic Brokerage Market in Netherlands Revenue Share (%), by Country 2025 & 2033
- Figure 18: Europe Electronic Brokerage Market in Netherlands Revenue (billion), by Investor Type 2025 & 2033
- Figure 19: Europe Electronic Brokerage Market in Netherlands Revenue Share (%), by Investor Type 2025 & 2033
- Figure 20: Europe Electronic Brokerage Market in Netherlands Revenue (billion), by Services Provided 2025 & 2033
- Figure 21: Europe Electronic Brokerage Market in Netherlands Revenue Share (%), by Services Provided 2025 & 2033
- Figure 22: Europe Electronic Brokerage Market in Netherlands Revenue (billion), by Operation 2025 & 2033
- Figure 23: Europe Electronic Brokerage Market in Netherlands Revenue Share (%), by Operation 2025 & 2033
- Figure 24: Europe Electronic Brokerage Market in Netherlands Revenue (billion), by Country 2025 & 2033
- Figure 25: Europe Electronic Brokerage Market in Netherlands Revenue Share (%), by Country 2025 & 2033
- Figure 26: Middle East & Africa Electronic Brokerage Market in Netherlands Revenue (billion), by Investor Type 2025 & 2033
- Figure 27: Middle East & Africa Electronic Brokerage Market in Netherlands Revenue Share (%), by Investor Type 2025 & 2033
- Figure 28: Middle East & Africa Electronic Brokerage Market in Netherlands Revenue (billion), by Services Provided 2025 & 2033
- Figure 29: Middle East & Africa Electronic Brokerage Market in Netherlands Revenue Share (%), by Services Provided 2025 & 2033
- Figure 30: Middle East & Africa Electronic Brokerage Market in Netherlands Revenue (billion), by Operation 2025 & 2033
- Figure 31: Middle East & Africa Electronic Brokerage Market in Netherlands Revenue Share (%), by Operation 2025 & 2033
- Figure 32: Middle East & Africa Electronic Brokerage Market in Netherlands Revenue (billion), by Country 2025 & 2033
- Figure 33: Middle East & Africa Electronic Brokerage Market in Netherlands Revenue Share (%), by Country 2025 & 2033
- Figure 34: Asia Pacific Electronic Brokerage Market in Netherlands Revenue (billion), by Investor Type 2025 & 2033
- Figure 35: Asia Pacific Electronic Brokerage Market in Netherlands Revenue Share (%), by Investor Type 2025 & 2033
- Figure 36: Asia Pacific Electronic Brokerage Market in Netherlands Revenue (billion), by Services Provided 2025 & 2033
- Figure 37: Asia Pacific Electronic Brokerage Market in Netherlands Revenue Share (%), by Services Provided 2025 & 2033
- Figure 38: Asia Pacific Electronic Brokerage Market in Netherlands Revenue (billion), by Operation 2025 & 2033
- Figure 39: Asia Pacific Electronic Brokerage Market in Netherlands Revenue Share (%), by Operation 2025 & 2033
- Figure 40: Asia Pacific Electronic Brokerage Market in Netherlands Revenue (billion), by Country 2025 & 2033
- Figure 41: Asia Pacific Electronic Brokerage Market in Netherlands Revenue Share (%), by Country 2025 & 2033
List of Tables
- Table 1: Global Electronic Brokerage Market in Netherlands Revenue billion Forecast, by Investor Type 2020 & 2033
- Table 2: Global Electronic Brokerage Market in Netherlands Revenue billion Forecast, by Services Provided 2020 & 2033
- Table 3: Global Electronic Brokerage Market in Netherlands Revenue billion Forecast, by Operation 2020 & 2033
- Table 4: Global Electronic Brokerage Market in Netherlands Revenue billion Forecast, by Region 2020 & 2033
- Table 5: Global Electronic Brokerage Market in Netherlands Revenue billion Forecast, by Investor Type 2020 & 2033
- Table 6: Global Electronic Brokerage Market in Netherlands Revenue billion Forecast, by Services Provided 2020 & 2033
- Table 7: Global Electronic Brokerage Market in Netherlands Revenue billion Forecast, by Operation 2020 & 2033
- Table 8: Global Electronic Brokerage Market in Netherlands Revenue billion Forecast, by Country 2020 & 2033
- Table 9: United States Electronic Brokerage Market in Netherlands Revenue (billion) Forecast, by Application 2020 & 2033
- Table 10: Canada Electronic Brokerage Market in Netherlands Revenue (billion) Forecast, by Application 2020 & 2033
- Table 11: Mexico Electronic Brokerage Market in Netherlands Revenue (billion) Forecast, by Application 2020 & 2033
- Table 12: Global Electronic Brokerage Market in Netherlands Revenue billion Forecast, by Investor Type 2020 & 2033
- Table 13: Global Electronic Brokerage Market in Netherlands Revenue billion Forecast, by Services Provided 2020 & 2033
- Table 14: Global Electronic Brokerage Market in Netherlands Revenue billion Forecast, by Operation 2020 & 2033
- Table 15: Global Electronic Brokerage Market in Netherlands Revenue billion Forecast, by Country 2020 & 2033
- Table 16: Brazil Electronic Brokerage Market in Netherlands Revenue (billion) Forecast, by Application 2020 & 2033
- Table 17: Argentina Electronic Brokerage Market in Netherlands Revenue (billion) Forecast, by Application 2020 & 2033
- Table 18: Rest of South America Electronic Brokerage Market in Netherlands Revenue (billion) Forecast, by Application 2020 & 2033
- Table 19: Global Electronic Brokerage Market in Netherlands Revenue billion Forecast, by Investor Type 2020 & 2033
- Table 20: Global Electronic Brokerage Market in Netherlands Revenue billion Forecast, by Services Provided 2020 & 2033
- Table 21: Global Electronic Brokerage Market in Netherlands Revenue billion Forecast, by Operation 2020 & 2033
- Table 22: Global Electronic Brokerage Market in Netherlands Revenue billion Forecast, by Country 2020 & 2033
- Table 23: United Kingdom Electronic Brokerage Market in Netherlands Revenue (billion) Forecast, by Application 2020 & 2033
- Table 24: Germany Electronic Brokerage Market in Netherlands Revenue (billion) Forecast, by Application 2020 & 2033
- Table 25: France Electronic Brokerage Market in Netherlands Revenue (billion) Forecast, by Application 2020 & 2033
- Table 26: Italy Electronic Brokerage Market in Netherlands Revenue (billion) Forecast, by Application 2020 & 2033
- Table 27: Spain Electronic Brokerage Market in Netherlands Revenue (billion) Forecast, by Application 2020 & 2033
- Table 28: Russia Electronic Brokerage Market in Netherlands Revenue (billion) Forecast, by Application 2020 & 2033
- Table 29: Benelux Electronic Brokerage Market in Netherlands Revenue (billion) Forecast, by Application 2020 & 2033
- Table 30: Nordics Electronic Brokerage Market in Netherlands Revenue (billion) Forecast, by Application 2020 & 2033
- Table 31: Rest of Europe Electronic Brokerage Market in Netherlands Revenue (billion) Forecast, by Application 2020 & 2033
- Table 32: Global Electronic Brokerage Market in Netherlands Revenue billion Forecast, by Investor Type 2020 & 2033
- Table 33: Global Electronic Brokerage Market in Netherlands Revenue billion Forecast, by Services Provided 2020 & 2033
- Table 34: Global Electronic Brokerage Market in Netherlands Revenue billion Forecast, by Operation 2020 & 2033
- Table 35: Global Electronic Brokerage Market in Netherlands Revenue billion Forecast, by Country 2020 & 2033
- Table 36: Turkey Electronic Brokerage Market in Netherlands Revenue (billion) Forecast, by Application 2020 & 2033
- Table 37: Israel Electronic Brokerage Market in Netherlands Revenue (billion) Forecast, by Application 2020 & 2033
- Table 38: GCC Electronic Brokerage Market in Netherlands Revenue (billion) Forecast, by Application 2020 & 2033
- Table 39: North Africa Electronic Brokerage Market in Netherlands Revenue (billion) Forecast, by Application 2020 & 2033
- Table 40: South Africa Electronic Brokerage Market in Netherlands Revenue (billion) Forecast, by Application 2020 & 2033
- Table 41: Rest of Middle East & Africa Electronic Brokerage Market in Netherlands Revenue (billion) Forecast, by Application 2020 & 2033
- Table 42: Global Electronic Brokerage Market in Netherlands Revenue billion Forecast, by Investor Type 2020 & 2033
- Table 43: Global Electronic Brokerage Market in Netherlands Revenue billion Forecast, by Services Provided 2020 & 2033
- Table 44: Global Electronic Brokerage Market in Netherlands Revenue billion Forecast, by Operation 2020 & 2033
- Table 45: Global Electronic Brokerage Market in Netherlands Revenue billion Forecast, by Country 2020 & 2033
- Table 46: China Electronic Brokerage Market in Netherlands Revenue (billion) Forecast, by Application 2020 & 2033
- Table 47: India Electronic Brokerage Market in Netherlands Revenue (billion) Forecast, by Application 2020 & 2033
- Table 48: Japan Electronic Brokerage Market in Netherlands Revenue (billion) Forecast, by Application 2020 & 2033
- Table 49: South Korea Electronic Brokerage Market in Netherlands Revenue (billion) Forecast, by Application 2020 & 2033
- Table 50: ASEAN Electronic Brokerage Market in Netherlands Revenue (billion) Forecast, by Application 2020 & 2033
- Table 51: Oceania Electronic Brokerage Market in Netherlands Revenue (billion) Forecast, by Application 2020 & 2033
- Table 52: Rest of Asia Pacific Electronic Brokerage Market in Netherlands Revenue (billion) Forecast, by Application 2020 & 2033
Frequently Asked Questions
1. What is the projected Compound Annual Growth Rate (CAGR) of the Electronic Brokerage Market in Netherlands?
The projected CAGR is approximately 7.3%.
2. Which companies are prominent players in the Electronic Brokerage Market in Netherlands?
Key companies in the market include Interactive Brokers, Degiro, XTB S A, Saxo bank, eToro, Euronext Group, LYNX, IC Markets, RoboForex, FP Markets**List Not Exhaustive.
3. What are the main segments of the Electronic Brokerage Market in Netherlands?
The market segments include Investor Type, Services Provided, Operation.
4. Can you provide details about the market size?
The market size is estimated to be USD 1.12 billion as of 2022.
5. What are some drivers contributing to market growth?
N/A
6. What are the notable trends driving market growth?
Growing Investing Household Signifying Rising E-Brokerage in Netherlands.
7. Are there any restraints impacting market growth?
N/A
8. Can you provide examples of recent developments in the market?
In September 2022, the leading European digital invetment platform, Scalable Capital expanded its presence in the Netherlands. Its subsidiaries Scalable Crypto and Scalable Broker are providing cost-effective and convenient trading and saving plans for Dutch retail clients with products like exchange traded funds (ETFs), stocks, cryptocurrencies, and mutual funds.
9. What pricing options are available for accessing the report?
Pricing options include single-user, multi-user, and enterprise licenses priced at USD 3800, USD 4500, and USD 5800 respectively.
10. Is the market size provided in terms of value or volume?
The market size is provided in terms of value, measured in billion.
11. Are there any specific market keywords associated with the report?
Yes, the market keyword associated with the report is "Electronic Brokerage Market in Netherlands," which aids in identifying and referencing the specific market segment covered.
12. How do I determine which pricing option suits my needs best?
The pricing options vary based on user requirements and access needs. Individual users may opt for single-user licenses, while businesses requiring broader access may choose multi-user or enterprise licenses for cost-effective access to the report.
13. Are there any additional resources or data provided in the Electronic Brokerage Market in Netherlands report?
While the report offers comprehensive insights, it's advisable to review the specific contents or supplementary materials provided to ascertain if additional resources or data are available.
14. How can I stay updated on further developments or reports in the Electronic Brokerage Market in Netherlands?
To stay informed about further developments, trends, and reports in the Electronic Brokerage Market in Netherlands, consider subscribing to industry newsletters, following relevant companies and organizations, or regularly checking reputable industry news sources and publications.
Methodology
Step 1 - Identification of Relevant Samples Size from Population Database


Step 2 - Approaches for Defining Global Market Size (Value, Volume* & Price*)

Note*: In applicable scenarios
Step 3 - Data Sources
Primary Research
- Web Analytics
- Survey Reports
- Research Institute
- Latest Research Reports
- Opinion Leaders
Secondary Research
- Annual Reports
- White Paper
- Latest Press Release
- Industry Association
- Paid Database
- Investor Presentations

Step 4 - Data Triangulation
Involves using different sources of information in order to increase the validity of a study
These sources are likely to be stakeholders in a program - participants, other researchers, program staff, other community members, and so on.
Then we put all data in single framework & apply various statistical tools to find out the dynamic on the market.
During the analysis stage, feedback from the stakeholder groups would be compared to determine areas of agreement as well as areas of divergence