

Key Insights
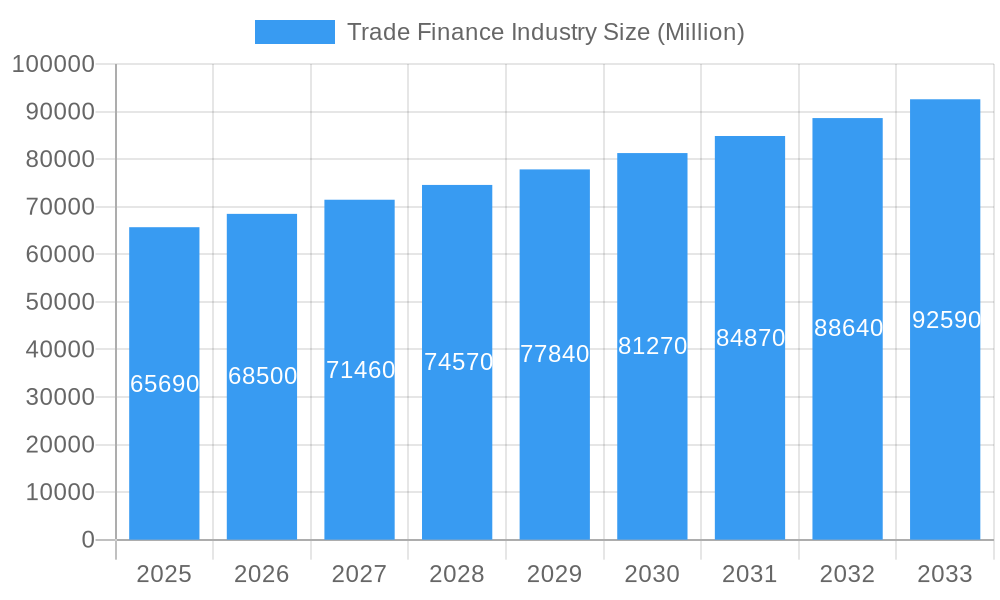
The global trade finance market, valued at $65.69 billion in 2025, is projected to experience robust growth, exhibiting a compound annual growth rate (CAGR) of 4.24% from 2025 to 2033. This expansion is fueled by several key drivers. The increasing globalization of businesses necessitates efficient and secure financing solutions for international trade transactions. E-commerce's continued rise significantly boosts demand for streamlined trade finance mechanisms. Technological advancements, particularly in fintech and blockchain, are improving transparency, security, and efficiency within the industry, attracting new participants and reducing operational costs. Furthermore, supportive government policies and initiatives aimed at promoting international trade further contribute to market growth. However, challenges remain, including geopolitical uncertainties, fluctuating exchange rates, and the ever-present risk of fraud and counterparty defaults. These factors can impact investor confidence and influence the pace of market expansion. Despite these constraints, the long-term outlook for the trade finance market remains positive, driven by the fundamental need for secure and efficient financing in a globalized economy.
Trade Finance Industry Market Size (In Billion)
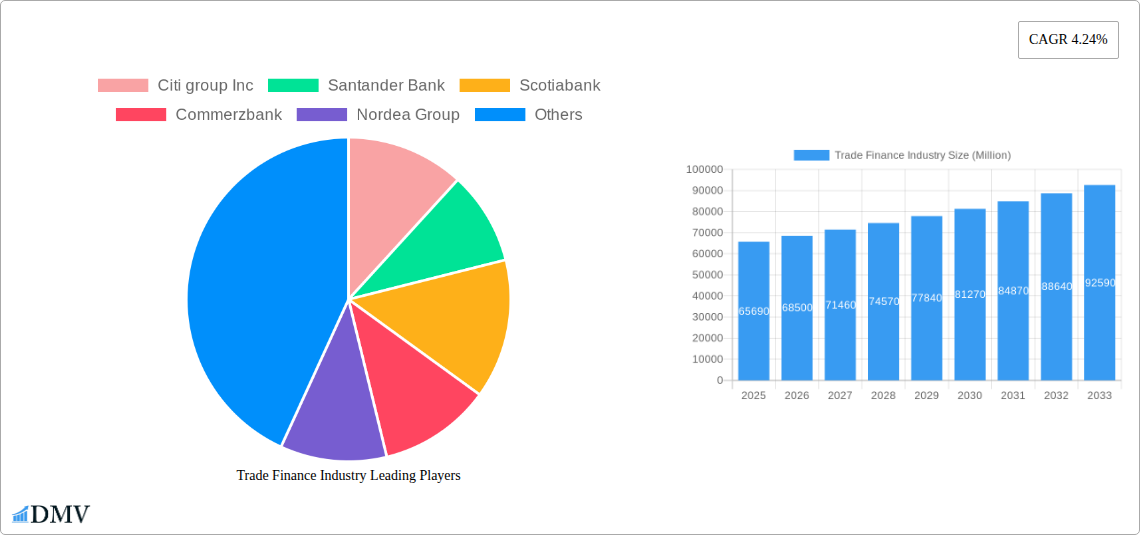
The competitive landscape is characterized by a mix of large multinational banks and regional players. Established institutions like Citigroup, Santander, and Scotiabank maintain significant market share due to their extensive global networks and established client relationships. However, the emergence of fintech companies and innovative financial technology solutions is disrupting traditional banking models, creating opportunities for new entrants to gain traction, particularly in niche markets or specific regions. The market is likely to see increased mergers and acquisitions as institutions adapt to the evolving technological landscape and seek to expand their reach and service offerings. Regional variations in market growth will be influenced by factors such as economic development, trade policies, and the adoption of digital technologies. North America and Europe are expected to remain major markets, but Asia-Pacific is projected to experience strong growth due to its expanding economies and rising cross-border trade activities.
Trade Finance Industry Company Market Share
Trade Finance Industry Market Report: 2019-2033
This comprehensive report provides an in-depth analysis of the global Trade Finance industry, projecting robust growth from USD xx Million in 2025 to USD xx Million by 2033. The study covers the historical period (2019-2024), the base year (2025), and forecasts until 2033, offering valuable insights for stakeholders across the industry. We examine key market dynamics, including technological advancements, regulatory shifts, and evolving consumer demands, presenting actionable intelligence for informed decision-making.
Trade Finance Industry Market Composition & Trends
This section delves into the intricate composition of the trade finance market, analyzing its concentration, innovation drivers, regulatory landscape, and competitive dynamics. We explore substitute products, end-user profiles, and the impact of mergers and acquisitions (M&A) on market share distribution. Our analysis includes quantitative data on M&A deal values (totalling USD xx Million in 2024) and market share distribution among key players.
- Market Concentration: Highly concentrated with top 10 players controlling approximately xx% of the market share in 2024.
- Innovation Catalysts: Blockchain technology, AI-driven solutions, and digitalization are driving efficiency and transparency.
- Regulatory Landscape: Evolving regulations focusing on KYC/AML compliance and sanctions screening are shaping industry practices.
- Substitute Products: The emergence of fintech solutions presents alternative trade finance options.
- End-User Profiles: The report segments end-users by industry (e.g., manufacturing, energy, agriculture) and company size (SMEs vs. large corporations).
- M&A Activities: Significant M&A activity observed in the period 2019-2024, with a notable increase in deal values in 2022. Key deals involved the consolidation of regional players and expansion into new markets.
Trade Finance Industry Industry Evolution
This section analyzes the evolutionary trajectory of the trade finance industry, highlighting market growth trajectories, technological advancements, and shifts in consumer demands. The report uses specific data points such as growth rates (e.g., a CAGR of xx% during 2019-2024), adoption metrics of innovative technologies (e.g., xx% adoption of blockchain solutions by 2024), and the impact of these developments on market dynamics. We examine the factors contributing to this evolution, including the growing adoption of digital technologies and increasing demand for sustainable trade finance solutions.
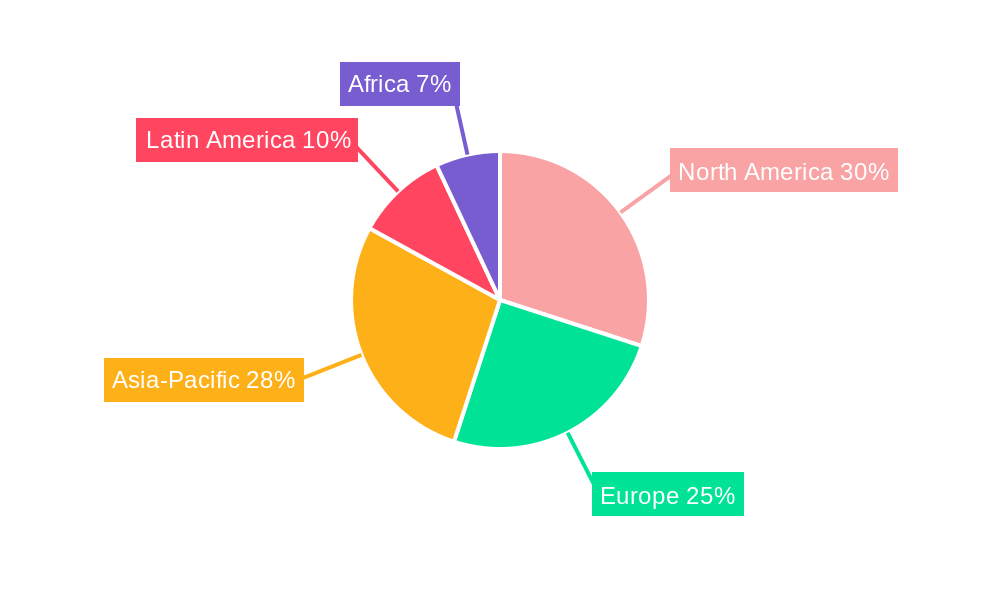
Leading Regions, Countries, or Segments in Trade Finance Industry
This section identifies the dominant regions, countries, and segments within the trade finance market, providing a detailed analysis of the factors contributing to their dominance. This analysis includes data on market size, growth rates, and key industry trends within each region.
Key Drivers (Examples):
- North America: Strong regulatory support for digital trade finance, high levels of investment in fintech.
- Europe: Well-established financial infrastructure, a large pool of multinational corporations involved in international trade.
- Asia-Pacific: Rapid economic growth, increasing trade volumes within and beyond the region.
Dominance Factors: The dominance of specific regions is attributed to factors such as strong economic growth, well-established financial infrastructure, government support for trade, and a concentration of large multinational corporations involved in international trade. The report analyzes these factors in detail for each key region.
Trade Finance Industry Product Innovations
This section highlights recent innovations in trade finance products, their applications, and associated performance metrics. The emphasis is on unique selling propositions (USPs) and the integration of advanced technologies such as AI and machine learning. This section will include examples of new product offerings and analyses of their impact on market dynamics.
Propelling Factors for Trade Finance Industry Growth
Several factors are driving the growth of the trade finance industry. Technological advancements, such as blockchain and AI, are streamlining processes and reducing costs. Favorable economic conditions and increased global trade contribute to higher transaction volumes. Supportive government policies and regulatory frameworks further encourage industry development. Specific examples include the increase in cross-border e-commerce and the growing adoption of sustainable finance practices.
Obstacles in the Trade Finance Industry Market
Despite significant growth potential, several challenges hinder the expansion of the trade finance industry. Stringent regulatory compliance requirements, particularly those related to Know Your Customer (KYC) and Anti-Money Laundering (AML) regulations, impose high compliance costs. Supply chain disruptions, geopolitical instability, and increased competitive pressure from Fintech companies also present significant hurdles.
Future Opportunities in Trade Finance Industry
The trade finance industry presents several lucrative opportunities in the coming years. The expansion of e-commerce, coupled with increasing globalization, will drive demand for efficient and secure trade finance solutions. The adoption of emerging technologies, like blockchain and AI, offers opportunities for process optimization and risk mitigation. Moreover, the rising focus on sustainable and ethical trade practices opens new avenues for specialized products and services.
Major Players in the Trade Finance Industry Ecosystem
Key Developments in Trade Finance Industry Industry
- September 2023: Standard Chartered Bank launched a sustainable trade loan offering for financial institutions, boosting liquidity for sustainable development projects.
- April 2022: The Asian Development Bank partnered with Axis Bank Limited (USD 150 Million deal) to expand supply chain financing for SMEs, focusing on impact sectors.
Strategic Trade Finance Industry Market Forecast
The Trade Finance industry is poised for significant growth over the forecast period (2025-2033). Continued technological advancements, increased global trade, and a favorable regulatory environment will drive market expansion. The rising demand for sustainable trade finance solutions and the increasing adoption of digital platforms will further propel market growth. The report projects substantial market potential with significant revenue generation opportunities for key players.
Trade Finance Industry Segmentation
-
1. Service Provider
- 1.1. Banks
- 1.2. Trade Finance Companies
- 1.3. Insurance Companies
Trade Finance Industry Segmentation By Geography
-
1. North America
- 1.1. US
- 1.2. Canada
- 1.3. Mexico
- 1.4. Rest of North America
-
2. Europe
- 2.1. Germany
- 2.2. UK
- 2.3. France
- 2.4. Russia
- 2.5. Spain
- 2.6. Rest of Europe
-
3. Asia Pacific
- 3.1. India
- 3.2. China
- 3.3. Japan
- 3.4. Rest of Asia Pacific
-
4. South America
- 4.1. Brazil
- 4.2. Argentina
-
5. Middle East And Africa
- 5.1. UAE
- 5.2. Saudi Arabia
- 5.3. Rest of Middle East And Africa
Trade Finance Industry Regional Market Share
Geographic Coverage of Trade Finance Industry
Trade Finance Industry REPORT HIGHLIGHTS
| Aspects | Details |
|---|---|
| Study Period | 2020-2034 |
| Base Year | 2025 |
| Estimated Year | 2026 |
| Forecast Period | 2026-2034 |
| Historical Period | 2020-2025 |
| Growth Rate | CAGR of 4.24% from 2020-2034 |
| Segmentation |
|
Table of Contents
- 1. Introduction
- 1.1. Research Scope
- 1.2. Market Segmentation
- 1.3. Research Objective
- 1.4. Definitions and Assumptions
- 2. Executive Summary
- 2.1. Market Snapshot
- 3. Market Dynamics
- 3.1. Market Drivers
- 3.2. Market Restrains
- 3.3. Market Trends
- 3.4. Market Opportunities
- 4. Market Factor Analysis
- 4.1. Porters Five Forces
- 4.1.1. Bargaining Power of Suppliers
- 4.1.2. Bargaining Power of Buyers
- 4.1.3. Threat of New Entrants
- 4.1.4. Threat of Substitutes
- 4.1.5. Competitive Rivalry
- 4.2. PESTEL analysis
- 4.3. BCG Analysis
- 4.3.1. Stars (High Growth, High Market Share)
- 4.3.2. Cash Cows (Low Growth, High Market Share)
- 4.3.3. Question Mark (High Growth, Low Market Share)
- 4.3.4. Dogs (Low Growth, Low Market Share)
- 4.4. Ansoff Matrix Analysis
- 4.5. Supply Chain Analysis
- 4.6. Regulatory Landscape
- 4.7. Current Market Potential and Opportunity Assessment (TAM–SAM–SOM Framework)
- 4.8. DMV Analyst Note
- 4.1. Porters Five Forces
- 5. Market Analysis, Insights and Forecast 2021-2033
- 5.1. Market Analysis, Insights and Forecast - by Service Provider
- 5.1.1. Banks
- 5.1.2. Trade Finance Companies
- 5.1.3. Insurance Companies
- 5.2. Market Analysis, Insights and Forecast - by Region
- 5.2.1. North America
- 5.2.2. Europe
- 5.2.3. Asia Pacific
- 5.2.4. South America
- 5.2.5. Middle East And Africa
- 5.1. Market Analysis, Insights and Forecast - by Service Provider
- 6. Global Trade Finance Industry Analysis, Insights and Forecast, 2021-2033
- 6.1. Market Analysis, Insights and Forecast - by Service Provider
- 6.1.1. Banks
- 6.1.2. Trade Finance Companies
- 6.1.3. Insurance Companies
- 6.1. Market Analysis, Insights and Forecast - by Service Provider
- 7. North America Trade Finance Industry Analysis, Insights and Forecast, 2020-2032
- 7.1. Market Analysis, Insights and Forecast - by Service Provider
- 7.1.1. Banks
- 7.1.2. Trade Finance Companies
- 7.1.3. Insurance Companies
- 7.1. Market Analysis, Insights and Forecast - by Service Provider
- 8. Europe Trade Finance Industry Analysis, Insights and Forecast, 2020-2032
- 8.1. Market Analysis, Insights and Forecast - by Service Provider
- 8.1.1. Banks
- 8.1.2. Trade Finance Companies
- 8.1.3. Insurance Companies
- 8.1. Market Analysis, Insights and Forecast - by Service Provider
- 9. Asia Pacific Trade Finance Industry Analysis, Insights and Forecast, 2020-2032
- 9.1. Market Analysis, Insights and Forecast - by Service Provider
- 9.1.1. Banks
- 9.1.2. Trade Finance Companies
- 9.1.3. Insurance Companies
- 9.1. Market Analysis, Insights and Forecast - by Service Provider
- 10. South America Trade Finance Industry Analysis, Insights and Forecast, 2020-2032
- 10.1. Market Analysis, Insights and Forecast - by Service Provider
- 10.1.1. Banks
- 10.1.2. Trade Finance Companies
- 10.1.3. Insurance Companies
- 10.1. Market Analysis, Insights and Forecast - by Service Provider
- 11. Middle East And Africa Trade Finance Industry Analysis, Insights and Forecast, 2020-2032
- 11.1. Market Analysis, Insights and Forecast - by Service Provider
- 11.1.1. Banks
- 11.1.2. Trade Finance Companies
- 11.1.3. Insurance Companies
- 11.1. Market Analysis, Insights and Forecast - by Service Provider
- 12. Competitive Analysis
- 12.1. Company Profiles
- 12.1.1 Citi group Inc
- 12.1.1.1. Company Overview
- 12.1.1.2. Products
- 12.1.1.3. Company Financials
- 12.1.1.4. SWOT Analysis
- 12.1.2 Santander Bank
- 12.1.2.1. Company Overview
- 12.1.2.2. Products
- 12.1.2.3. Company Financials
- 12.1.2.4. SWOT Analysis
- 12.1.3 Scotiabank
- 12.1.3.1. Company Overview
- 12.1.3.2. Products
- 12.1.3.3. Company Financials
- 12.1.3.4. SWOT Analysis
- 12.1.4 Commerzbank
- 12.1.4.1. Company Overview
- 12.1.4.2. Products
- 12.1.4.3. Company Financials
- 12.1.4.4. SWOT Analysis
- 12.1.5 Nordea Group
- 12.1.5.1. Company Overview
- 12.1.5.2. Products
- 12.1.5.3. Company Financials
- 12.1.5.4. SWOT Analysis
- 12.1.6 Unicredit
- 12.1.6.1. Company Overview
- 12.1.6.2. Products
- 12.1.6.3. Company Financials
- 12.1.6.4. SWOT Analysis
- 12.1.7 Standard Chartered Bank
- 12.1.7.1. Company Overview
- 12.1.7.2. Products
- 12.1.7.3. Company Financials
- 12.1.7.4. SWOT Analysis
- 12.1.8 Arab Bank
- 12.1.8.1. Company Overview
- 12.1.8.2. Products
- 12.1.8.3. Company Financials
- 12.1.8.4. SWOT Analysis
- 12.1.9 Societe Generale
- 12.1.9.1. Company Overview
- 12.1.9.2. Products
- 12.1.9.3. Company Financials
- 12.1.9.4. SWOT Analysis
- 12.1.10 Rand Merchant Bank
- 12.1.10.1. Company Overview
- 12.1.10.2. Products
- 12.1.10.3. Company Financials
- 12.1.10.4. SWOT Analysis
- 12.1.11 Rabobank
- 12.1.11.1. Company Overview
- 12.1.11.2. Products
- 12.1.11.3. Company Financials
- 12.1.11.4. SWOT Analysis
- 12.1.12 China Construction Bank
- 12.1.12.1. Company Overview
- 12.1.12.2. Products
- 12.1.12.3. Company Financials
- 12.1.12.4. SWOT Analysis
- 12.1.13 BNP Paribas**List Not Exhaustive
- 12.1.13.1. Company Overview
- 12.1.13.2. Products
- 12.1.13.3. Company Financials
- 12.1.13.4. SWOT Analysis
- 12.1.1 Citi group Inc
- 12.2. Market Entropy
- 12.2.1 Company's Key Areas Served
- 12.2.2 Recent Developments
- 12.3. Company Market Share Analysis 2025
- 12.3.1 Top 5 Companies Market Share Analysis
- 12.3.2 Top 3 Companies Market Share Analysis
- 12.4. List of Potential Customers
- 13. Research Methodology
List of Figures
- Figure 1: Global Trade Finance Industry Revenue Breakdown (Million, %) by Region 2025 & 2033
- Figure 2: Global Trade Finance Industry Volume Breakdown (Billion, %) by Region 2025 & 2033
- Figure 3: North America Trade Finance Industry Revenue (Million), by Service Provider 2025 & 2033
- Figure 4: North America Trade Finance Industry Volume (Billion), by Service Provider 2025 & 2033
- Figure 5: North America Trade Finance Industry Revenue Share (%), by Service Provider 2025 & 2033
- Figure 6: North America Trade Finance Industry Volume Share (%), by Service Provider 2025 & 2033
- Figure 7: North America Trade Finance Industry Revenue (Million), by Country 2025 & 2033
- Figure 8: North America Trade Finance Industry Volume (Billion), by Country 2025 & 2033
- Figure 9: North America Trade Finance Industry Revenue Share (%), by Country 2025 & 2033
- Figure 10: North America Trade Finance Industry Volume Share (%), by Country 2025 & 2033
- Figure 11: Europe Trade Finance Industry Revenue (Million), by Service Provider 2025 & 2033
- Figure 12: Europe Trade Finance Industry Volume (Billion), by Service Provider 2025 & 2033
- Figure 13: Europe Trade Finance Industry Revenue Share (%), by Service Provider 2025 & 2033
- Figure 14: Europe Trade Finance Industry Volume Share (%), by Service Provider 2025 & 2033
- Figure 15: Europe Trade Finance Industry Revenue (Million), by Country 2025 & 2033
- Figure 16: Europe Trade Finance Industry Volume (Billion), by Country 2025 & 2033
- Figure 17: Europe Trade Finance Industry Revenue Share (%), by Country 2025 & 2033
- Figure 18: Europe Trade Finance Industry Volume Share (%), by Country 2025 & 2033
- Figure 19: Asia Pacific Trade Finance Industry Revenue (Million), by Service Provider 2025 & 2033
- Figure 20: Asia Pacific Trade Finance Industry Volume (Billion), by Service Provider 2025 & 2033
- Figure 21: Asia Pacific Trade Finance Industry Revenue Share (%), by Service Provider 2025 & 2033
- Figure 22: Asia Pacific Trade Finance Industry Volume Share (%), by Service Provider 2025 & 2033
- Figure 23: Asia Pacific Trade Finance Industry Revenue (Million), by Country 2025 & 2033
- Figure 24: Asia Pacific Trade Finance Industry Volume (Billion), by Country 2025 & 2033
- Figure 25: Asia Pacific Trade Finance Industry Revenue Share (%), by Country 2025 & 2033
- Figure 26: Asia Pacific Trade Finance Industry Volume Share (%), by Country 2025 & 2033
- Figure 27: South America Trade Finance Industry Revenue (Million), by Service Provider 2025 & 2033
- Figure 28: South America Trade Finance Industry Volume (Billion), by Service Provider 2025 & 2033
- Figure 29: South America Trade Finance Industry Revenue Share (%), by Service Provider 2025 & 2033
- Figure 30: South America Trade Finance Industry Volume Share (%), by Service Provider 2025 & 2033
- Figure 31: South America Trade Finance Industry Revenue (Million), by Country 2025 & 2033
- Figure 32: South America Trade Finance Industry Volume (Billion), by Country 2025 & 2033
- Figure 33: South America Trade Finance Industry Revenue Share (%), by Country 2025 & 2033
- Figure 34: South America Trade Finance Industry Volume Share (%), by Country 2025 & 2033
- Figure 35: Middle East And Africa Trade Finance Industry Revenue (Million), by Service Provider 2025 & 2033
- Figure 36: Middle East And Africa Trade Finance Industry Volume (Billion), by Service Provider 2025 & 2033
- Figure 37: Middle East And Africa Trade Finance Industry Revenue Share (%), by Service Provider 2025 & 2033
- Figure 38: Middle East And Africa Trade Finance Industry Volume Share (%), by Service Provider 2025 & 2033
- Figure 39: Middle East And Africa Trade Finance Industry Revenue (Million), by Country 2025 & 2033
- Figure 40: Middle East And Africa Trade Finance Industry Volume (Billion), by Country 2025 & 2033
- Figure 41: Middle East And Africa Trade Finance Industry Revenue Share (%), by Country 2025 & 2033
- Figure 42: Middle East And Africa Trade Finance Industry Volume Share (%), by Country 2025 & 2033
List of Tables
- Table 1: Global Trade Finance Industry Revenue Million Forecast, by Service Provider 2020 & 2033
- Table 2: Global Trade Finance Industry Volume Billion Forecast, by Service Provider 2020 & 2033
- Table 3: Global Trade Finance Industry Revenue Million Forecast, by Region 2020 & 2033
- Table 4: Global Trade Finance Industry Volume Billion Forecast, by Region 2020 & 2033
- Table 5: Global Trade Finance Industry Revenue Million Forecast, by Service Provider 2020 & 2033
- Table 6: Global Trade Finance Industry Volume Billion Forecast, by Service Provider 2020 & 2033
- Table 7: Global Trade Finance Industry Revenue Million Forecast, by Country 2020 & 2033
- Table 8: Global Trade Finance Industry Volume Billion Forecast, by Country 2020 & 2033
- Table 9: US Trade Finance Industry Revenue (Million) Forecast, by Application 2020 & 2033
- Table 10: US Trade Finance Industry Volume (Billion) Forecast, by Application 2020 & 2033
- Table 11: Canada Trade Finance Industry Revenue (Million) Forecast, by Application 2020 & 2033
- Table 12: Canada Trade Finance Industry Volume (Billion) Forecast, by Application 2020 & 2033
- Table 13: Mexico Trade Finance Industry Revenue (Million) Forecast, by Application 2020 & 2033
- Table 14: Mexico Trade Finance Industry Volume (Billion) Forecast, by Application 2020 & 2033
- Table 15: Rest of North America Trade Finance Industry Revenue (Million) Forecast, by Application 2020 & 2033
- Table 16: Rest of North America Trade Finance Industry Volume (Billion) Forecast, by Application 2020 & 2033
- Table 17: Global Trade Finance Industry Revenue Million Forecast, by Service Provider 2020 & 2033
- Table 18: Global Trade Finance Industry Volume Billion Forecast, by Service Provider 2020 & 2033
- Table 19: Global Trade Finance Industry Revenue Million Forecast, by Country 2020 & 2033
- Table 20: Global Trade Finance Industry Volume Billion Forecast, by Country 2020 & 2033
- Table 21: Germany Trade Finance Industry Revenue (Million) Forecast, by Application 2020 & 2033
- Table 22: Germany Trade Finance Industry Volume (Billion) Forecast, by Application 2020 & 2033
- Table 23: UK Trade Finance Industry Revenue (Million) Forecast, by Application 2020 & 2033
- Table 24: UK Trade Finance Industry Volume (Billion) Forecast, by Application 2020 & 2033
- Table 25: France Trade Finance Industry Revenue (Million) Forecast, by Application 2020 & 2033
- Table 26: France Trade Finance Industry Volume (Billion) Forecast, by Application 2020 & 2033
- Table 27: Russia Trade Finance Industry Revenue (Million) Forecast, by Application 2020 & 2033
- Table 28: Russia Trade Finance Industry Volume (Billion) Forecast, by Application 2020 & 2033
- Table 29: Spain Trade Finance Industry Revenue (Million) Forecast, by Application 2020 & 2033
- Table 30: Spain Trade Finance Industry Volume (Billion) Forecast, by Application 2020 & 2033
- Table 31: Rest of Europe Trade Finance Industry Revenue (Million) Forecast, by Application 2020 & 2033
- Table 32: Rest of Europe Trade Finance Industry Volume (Billion) Forecast, by Application 2020 & 2033
- Table 33: Global Trade Finance Industry Revenue Million Forecast, by Service Provider 2020 & 2033
- Table 34: Global Trade Finance Industry Volume Billion Forecast, by Service Provider 2020 & 2033
- Table 35: Global Trade Finance Industry Revenue Million Forecast, by Country 2020 & 2033
- Table 36: Global Trade Finance Industry Volume Billion Forecast, by Country 2020 & 2033
- Table 37: India Trade Finance Industry Revenue (Million) Forecast, by Application 2020 & 2033
- Table 38: India Trade Finance Industry Volume (Billion) Forecast, by Application 2020 & 2033
- Table 39: China Trade Finance Industry Revenue (Million) Forecast, by Application 2020 & 2033
- Table 40: China Trade Finance Industry Volume (Billion) Forecast, by Application 2020 & 2033
- Table 41: Japan Trade Finance Industry Revenue (Million) Forecast, by Application 2020 & 2033
- Table 42: Japan Trade Finance Industry Volume (Billion) Forecast, by Application 2020 & 2033
- Table 43: Rest of Asia Pacific Trade Finance Industry Revenue (Million) Forecast, by Application 2020 & 2033
- Table 44: Rest of Asia Pacific Trade Finance Industry Volume (Billion) Forecast, by Application 2020 & 2033
- Table 45: Global Trade Finance Industry Revenue Million Forecast, by Service Provider 2020 & 2033
- Table 46: Global Trade Finance Industry Volume Billion Forecast, by Service Provider 2020 & 2033
- Table 47: Global Trade Finance Industry Revenue Million Forecast, by Country 2020 & 2033
- Table 48: Global Trade Finance Industry Volume Billion Forecast, by Country 2020 & 2033
- Table 49: Brazil Trade Finance Industry Revenue (Million) Forecast, by Application 2020 & 2033
- Table 50: Brazil Trade Finance Industry Volume (Billion) Forecast, by Application 2020 & 2033
- Table 51: Argentina Trade Finance Industry Revenue (Million) Forecast, by Application 2020 & 2033
- Table 52: Argentina Trade Finance Industry Volume (Billion) Forecast, by Application 2020 & 2033
- Table 53: Global Trade Finance Industry Revenue Million Forecast, by Service Provider 2020 & 2033
- Table 54: Global Trade Finance Industry Volume Billion Forecast, by Service Provider 2020 & 2033
- Table 55: Global Trade Finance Industry Revenue Million Forecast, by Country 2020 & 2033
- Table 56: Global Trade Finance Industry Volume Billion Forecast, by Country 2020 & 2033
- Table 57: UAE Trade Finance Industry Revenue (Million) Forecast, by Application 2020 & 2033
- Table 58: UAE Trade Finance Industry Volume (Billion) Forecast, by Application 2020 & 2033
- Table 59: Saudi Arabia Trade Finance Industry Revenue (Million) Forecast, by Application 2020 & 2033
- Table 60: Saudi Arabia Trade Finance Industry Volume (Billion) Forecast, by Application 2020 & 2033
- Table 61: Rest of Middle East And Africa Trade Finance Industry Revenue (Million) Forecast, by Application 2020 & 2033
- Table 62: Rest of Middle East And Africa Trade Finance Industry Volume (Billion) Forecast, by Application 2020 & 2033
Frequently Asked Questions
1. What is the projected Compound Annual Growth Rate (CAGR) of the Trade Finance Industry?
The projected CAGR is approximately 4.24%.
2. Which companies are prominent players in the Trade Finance Industry?
Key companies in the market include Citi group Inc, Santander Bank, Scotiabank, Commerzbank, Nordea Group, Unicredit, Standard Chartered Bank, Arab Bank, Societe Generale, Rand Merchant Bank, Rabobank, China Construction Bank, BNP Paribas**List Not Exhaustive.
3. What are the main segments of the Trade Finance Industry?
The market segments include Service Provider.
4. Can you provide details about the market size?
The market size is estimated to be USD 65.69 Million as of 2022.
5. What are some drivers contributing to market growth?
Rise In Global Trade Drives The Market; Increasing Investments And Innovations In Fintech Drives The Market.
6. What are the notable trends driving market growth?
Globalization And Increased International Trade Drives the Market.
7. Are there any restraints impacting market growth?
Rise In Global Trade Drives The Market; Increasing Investments And Innovations In Fintech Drives The Market.
8. Can you provide examples of recent developments in the market?
September 2023 - Standard Chartered Bank, a multinational bank, launched a sustainable trade loan offering for financial institutions. It will assist financial institutions in providing liquidity associated with sustainable development in the most needed areas.
9. What pricing options are available for accessing the report?
Pricing options include single-user, multi-user, and enterprise licenses priced at USD 4750, USD 5250, and USD 8750 respectively.
10. Is the market size provided in terms of value or volume?
The market size is provided in terms of value, measured in Million and volume, measured in Billion.
11. Are there any specific market keywords associated with the report?
Yes, the market keyword associated with the report is "Trade Finance Industry," which aids in identifying and referencing the specific market segment covered.
12. How do I determine which pricing option suits my needs best?
The pricing options vary based on user requirements and access needs. Individual users may opt for single-user licenses, while businesses requiring broader access may choose multi-user or enterprise licenses for cost-effective access to the report.
13. Are there any additional resources or data provided in the Trade Finance Industry report?
While the report offers comprehensive insights, it's advisable to review the specific contents or supplementary materials provided to ascertain if additional resources or data are available.
14. How can I stay updated on further developments or reports in the Trade Finance Industry?
To stay informed about further developments, trends, and reports in the Trade Finance Industry, consider subscribing to industry newsletters, following relevant companies and organizations, or regularly checking reputable industry news sources and publications.
Methodology
Step 1 - Identification of Relevant Samples Size from Population Database


Step 2 - Approaches for Defining Global Market Size (Value, Volume* & Price*)

Note*: In applicable scenarios
Step 3 - Data Sources
Primary Research
- Web Analytics
- Survey Reports
- Research Institute
- Latest Research Reports
- Opinion Leaders
Secondary Research
- Annual Reports
- White Paper
- Latest Press Release
- Industry Association
- Paid Database
- Investor Presentations

Step 4 - Data Triangulation
Involves using different sources of information in order to increase the validity of a study
These sources are likely to be stakeholders in a program - participants, other researchers, program staff, other community members, and so on.
Then we put all data in single framework & apply various statistical tools to find out the dynamic on the market.
During the analysis stage, feedback from the stakeholder groups would be compared to determine areas of agreement as well as areas of divergence