

Key Insights
The global e-grocery market is experiencing robust growth, driven by increasing internet and smartphone penetration, changing consumer lifestyles favoring convenience, and the expansion of delivery infrastructure. The market, while showing significant expansion in recent years (2019-2024), is projected to maintain a healthy Compound Annual Growth Rate (CAGR) throughout the forecast period (2025-2033). Key players like Walmart, Amazon, Kroger, and Tesco are leveraging their existing retail infrastructure and technological capabilities to dominate market share. However, the competitive landscape is dynamic, with smaller, specialized players focusing on niche markets (e.g., organic produce, specialized diets) and geographic areas. Successful strategies involve efficient logistics, personalized customer experiences, and competitive pricing, alongside addressing concerns around food freshness and delivery times. The market segmentation reveals a strong demand across various demographics and consumer preferences, leading to the rise of specialized e-grocery platforms and services.
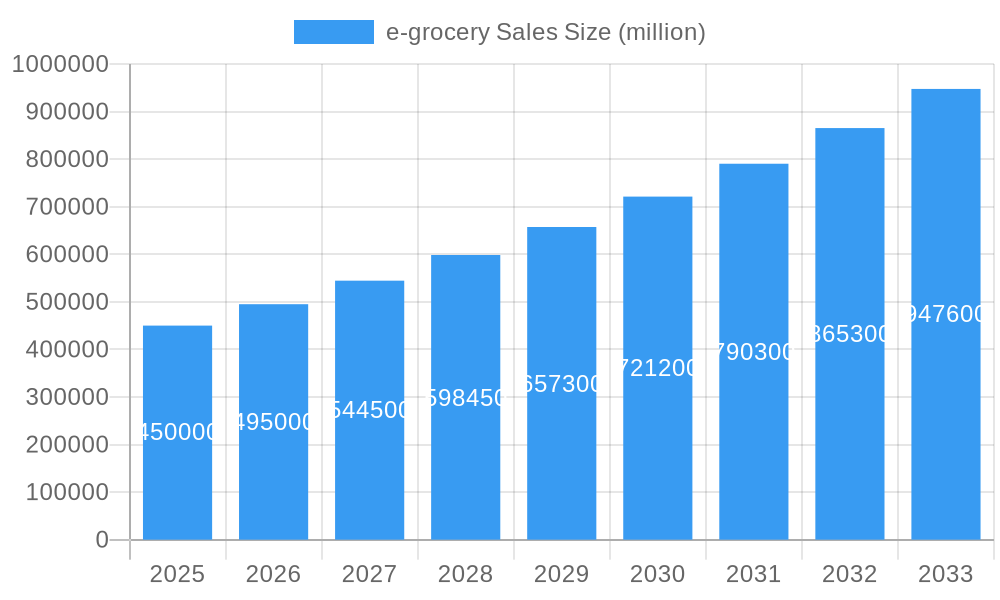
e-grocery Sales Market Size (In Billion)
Continued growth hinges on overcoming challenges such as maintaining consistent product quality during delivery, effectively managing last-mile delivery costs, and adapting to evolving consumer demands. The rise of quick commerce (rapid delivery within hours) presents both opportunity and threat, demanding further investment in technology and infrastructure. Regional variations will persist, reflecting factors such as infrastructure development, digital literacy levels, and existing retail landscapes. The market's maturation will likely witness consolidation among players and a focus on enhancing operational efficiency and customer loyalty programs. Factors such as rising inflation and economic uncertainty could impact consumer spending, but the long-term trend points towards continued expansion of the e-grocery market.
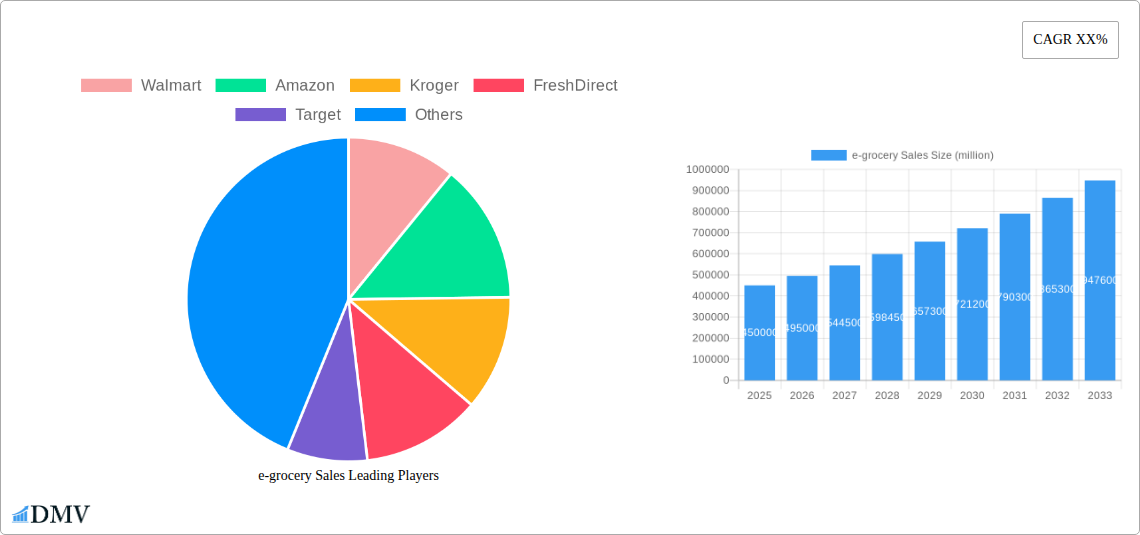
e-grocery Sales Company Market Share
e-grocery Sales Market: A Comprehensive Report (2019-2033)
This insightful report provides a detailed analysis of the global e-grocery sales market, encompassing historical data (2019-2024), current estimations (2025), and future projections (2025-2033). We delve deep into market dynamics, competitive landscapes, technological advancements, and key growth drivers, equipping stakeholders with crucial insights for informed decision-making. The report analyzes a market valued at $xx million in 2025, poised for significant expansion in the coming years.
e-grocery Sales Market Composition & Trends
This section offers a comprehensive overview of the e-grocery market's structure, dynamics, and key trends. We examine market concentration, revealing the market share distribution amongst key players like Walmart, Amazon, and Kroger. We also assess the impact of innovation catalysts, such as AI-powered personalized recommendations and drone delivery, on market growth. The report further analyzes the regulatory landscape, the influence of substitute products (e.g., meal kits), evolving end-user profiles (e.g., increased adoption by older demographics), and the effects of significant mergers and acquisitions (M&A) activities within the industry. Analysis includes examination of M&A deal values totaling $xx million in the historical period.
- Market Share Distribution (2025): Walmart ($xx million), Amazon ($xx million), Kroger ($xx million), others ($xx million).
- Key M&A Activities (2019-2024): Detailed analysis of significant mergers and acquisitions, including deal values.
- Innovation Catalysts: Discussion on the influence of AI, blockchain, and drone delivery on the market.
- Regulatory Landscape: An overview of key regulations and their impacts on market growth.
e-grocery Sales Industry Evolution
This section charts the evolution of the e-grocery sales market from 2019 to 2033, highlighting significant growth trajectories. We analyze the market's compound annual growth rate (CAGR) during the historical period (2019-2024) at xx% and project the CAGR for the forecast period (2025-2033) at xx%. The report meticulously examines the adoption of various technologies, such as mobile apps, automated warehouses, and sophisticated logistics systems, and assesses their influence on market growth. It also explores the changing consumer preferences, such as a rising preference for organic and locally sourced products and the impact on the industry's growth trajectory.
- Technological Advancements: In-depth analysis of the role of AI, IoT, and blockchain in transforming the e-grocery landscape.
- Shifting Consumer Demands: Exploration of evolving consumer preferences, including increasing demand for convenience, sustainability, and personalized experiences.
- Growth Rate Analysis: Detailed analysis of historical and projected growth rates, backed by robust data.
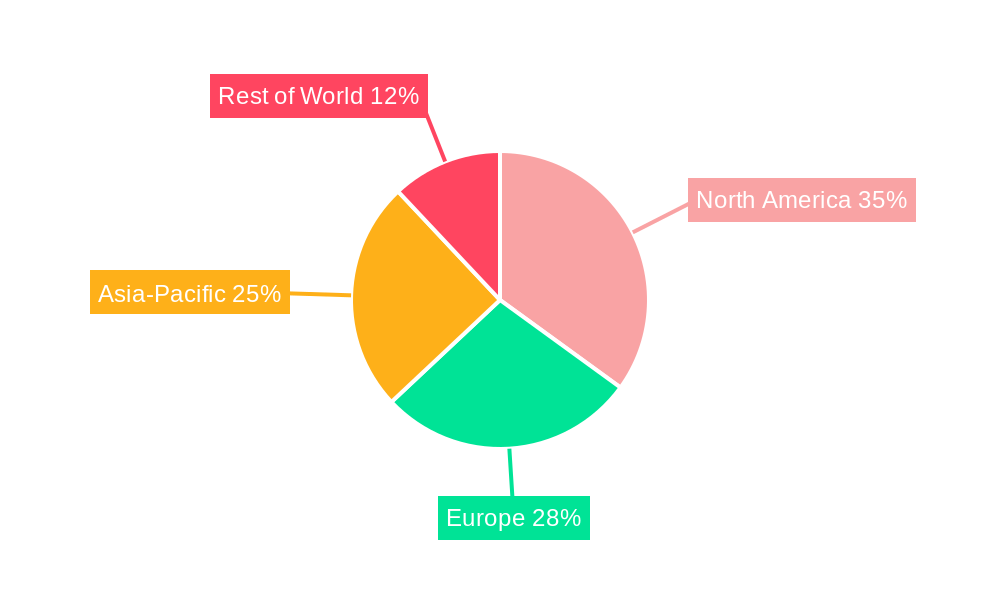
Leading Regions, Countries, or Segments in e-grocery Sales
This section identifies the leading regions and segments within the e-grocery market, providing an in-depth analysis of their dominance. The report pinpoints the key drivers behind this dominance, including investment trends, supportive regulations, and unique market characteristics. We analyze the factors contributing to the market’s leadership in these regions/segments, covering aspects like consumer behavior, infrastructure development, and government initiatives. For example, the North American market is expected to continue its strong performance due to [insert specific reason, e.g., high internet penetration and established logistics networks].
- Key Drivers: Specific examples of investment trends, regulatory support, and infrastructural developments contributing to regional dominance.
- Dominance Factors: In-depth analysis of factors like consumer behavior, market infrastructure, and government policies driving regional leadership. (e.g., high smartphone penetration and robust delivery infrastructure in [region] drive high adoption).
e-grocery Sales Product Innovations
This section focuses on recent product innovations in the e-grocery sector. We analyze cutting-edge technologies such as personalized recommendations, subscription services (e.g., meal kits), and improved delivery options like same-day delivery and click-and-collect. These innovations offer unique selling propositions, enhanced convenience, and improved customer experience, impacting the growth of the e-grocery market. We explore the performance metrics of these new products and services.
Propelling Factors for e-grocery Sales Growth
Several factors are fueling the growth of e-grocery sales. Technological advancements like improved mobile apps and AI-driven personalized shopping experiences are key drivers. Economic factors such as rising disposable incomes and a preference for convenience are also impacting the market. Furthermore, supportive government regulations and initiatives aimed at promoting e-commerce are stimulating growth.
Obstacles in the e-grocery Sales Market
Despite its growth trajectory, the e-grocery market faces challenges. Regulatory hurdles, such as food safety regulations and data privacy concerns, create barriers. Supply chain disruptions, particularly during peak seasons or unforeseen events, negatively impact sales and customer satisfaction. Intense competition among major players also creates pressures on profitability and market share.
Future Opportunities in e-grocery Sales
The e-grocery market presents substantial future opportunities. Expanding into new markets with high growth potential, utilizing emerging technologies like autonomous delivery vehicles, and capitalizing on growing consumer demand for sustainable and healthy food options are key avenues for growth. The development of innovative subscription models and personalized services will also play a crucial role.
Key Developments in e-grocery Sales Industry
- [Month, Year]: [Description of key development and its market impact, e.g., Amazon launches a new grocery delivery service, impacting market share.]
- [Month, Year]: [Description of key development and its market impact]
- [Month, Year]: [Description of key development and its market impact]
Strategic e-grocery Sales Market Forecast
The e-grocery market is projected to experience robust growth, driven by sustained technological innovation, shifting consumer preferences towards online shopping, and supportive regulatory frameworks. The market's potential is significant, promising substantial returns for investors and stakeholders who strategically navigate the evolving landscape. Future growth will be shaped by factors such as the adoption of innovative technologies, expansion into new geographical markets, and the increasing adoption of subscription models.
e-grocery Sales Segmentation
-
1. Application
- 1.1. Personal Shoppers
- 1.2. Business Customers
-
2. Types
- 2.1. Packaged Foods
- 2.2. Fresh Foods
e-grocery Sales Segmentation By Geography
-
1. North America
- 1.1. United States
- 1.2. Canada
- 1.3. Mexico
-
2. South America
- 2.1. Brazil
- 2.2. Argentina
- 2.3. Rest of South America
-
3. Europe
- 3.1. United Kingdom
- 3.2. Germany
- 3.3. France
- 3.4. Italy
- 3.5. Spain
- 3.6. Russia
- 3.7. Benelux
- 3.8. Nordics
- 3.9. Rest of Europe
-
4. Middle East & Africa
- 4.1. Turkey
- 4.2. Israel
- 4.3. GCC
- 4.4. North Africa
- 4.5. South Africa
- 4.6. Rest of Middle East & Africa
-
5. Asia Pacific
- 5.1. China
- 5.2. India
- 5.3. Japan
- 5.4. South Korea
- 5.5. ASEAN
- 5.6. Oceania
- 5.7. Rest of Asia Pacific
e-grocery Sales Regional Market Share
Geographic Coverage of e-grocery Sales
e-grocery Sales REPORT HIGHLIGHTS
| Aspects | Details |
|---|---|
| Study Period | 2020-2034 |
| Base Year | 2025 |
| Estimated Year | 2026 |
| Forecast Period | 2026-2034 |
| Historical Period | 2020-2025 |
| Growth Rate | CAGR of XX% from 2020-2034 |
| Segmentation |
|
Table of Contents
- 1. Introduction
- 1.1. Research Scope
- 1.2. Market Segmentation
- 1.3. Research Methodology
- 1.4. Definitions and Assumptions
- 2. Executive Summary
- 2.1. Introduction
- 3. Market Dynamics
- 3.1. Introduction
- 3.2. Market Drivers
- 3.3. Market Restrains
- 3.4. Market Trends
- 4. Market Factor Analysis
- 4.1. Porters Five Forces
- 4.2. Supply/Value Chain
- 4.3. PESTEL analysis
- 4.4. Market Entropy
- 4.5. Patent/Trademark Analysis
- 5. Global e-grocery Sales Analysis, Insights and Forecast, 2020-2032
- 5.1. Market Analysis, Insights and Forecast - by Application
- 5.1.1. Personal Shoppers
- 5.1.2. Business Customers
- 5.2. Market Analysis, Insights and Forecast - by Types
- 5.2.1. Packaged Foods
- 5.2.2. Fresh Foods
- 5.3. Market Analysis, Insights and Forecast - by Region
- 5.3.1. North America
- 5.3.2. South America
- 5.3.3. Europe
- 5.3.4. Middle East & Africa
- 5.3.5. Asia Pacific
- 5.1. Market Analysis, Insights and Forecast - by Application
- 6. North America e-grocery Sales Analysis, Insights and Forecast, 2020-2032
- 6.1. Market Analysis, Insights and Forecast - by Application
- 6.1.1. Personal Shoppers
- 6.1.2. Business Customers
- 6.2. Market Analysis, Insights and Forecast - by Types
- 6.2.1. Packaged Foods
- 6.2.2. Fresh Foods
- 6.1. Market Analysis, Insights and Forecast - by Application
- 7. South America e-grocery Sales Analysis, Insights and Forecast, 2020-2032
- 7.1. Market Analysis, Insights and Forecast - by Application
- 7.1.1. Personal Shoppers
- 7.1.2. Business Customers
- 7.2. Market Analysis, Insights and Forecast - by Types
- 7.2.1. Packaged Foods
- 7.2.2. Fresh Foods
- 7.1. Market Analysis, Insights and Forecast - by Application
- 8. Europe e-grocery Sales Analysis, Insights and Forecast, 2020-2032
- 8.1. Market Analysis, Insights and Forecast - by Application
- 8.1.1. Personal Shoppers
- 8.1.2. Business Customers
- 8.2. Market Analysis, Insights and Forecast - by Types
- 8.2.1. Packaged Foods
- 8.2.2. Fresh Foods
- 8.1. Market Analysis, Insights and Forecast - by Application
- 9. Middle East & Africa e-grocery Sales Analysis, Insights and Forecast, 2020-2032
- 9.1. Market Analysis, Insights and Forecast - by Application
- 9.1.1. Personal Shoppers
- 9.1.2. Business Customers
- 9.2. Market Analysis, Insights and Forecast - by Types
- 9.2.1. Packaged Foods
- 9.2.2. Fresh Foods
- 9.1. Market Analysis, Insights and Forecast - by Application
- 10. Asia Pacific e-grocery Sales Analysis, Insights and Forecast, 2020-2032
- 10.1. Market Analysis, Insights and Forecast - by Application
- 10.1.1. Personal Shoppers
- 10.1.2. Business Customers
- 10.2. Market Analysis, Insights and Forecast - by Types
- 10.2.1. Packaged Foods
- 10.2.2. Fresh Foods
- 10.1. Market Analysis, Insights and Forecast - by Application
- 11. Competitive Analysis
- 11.1. Global Market Share Analysis 2025
- 11.2. Company Profiles
- 11.2.1 Walmart
- 11.2.1.1. Overview
- 11.2.1.2. Products
- 11.2.1.3. SWOT Analysis
- 11.2.1.4. Recent Developments
- 11.2.1.5. Financials (Based on Availability)
- 11.2.2 Amazon
- 11.2.2.1. Overview
- 11.2.2.2. Products
- 11.2.2.3. SWOT Analysis
- 11.2.2.4. Recent Developments
- 11.2.2.5. Financials (Based on Availability)
- 11.2.3 Kroger
- 11.2.3.1. Overview
- 11.2.3.2. Products
- 11.2.3.3. SWOT Analysis
- 11.2.3.4. Recent Developments
- 11.2.3.5. Financials (Based on Availability)
- 11.2.4 FreshDirect
- 11.2.4.1. Overview
- 11.2.4.2. Products
- 11.2.4.3. SWOT Analysis
- 11.2.4.4. Recent Developments
- 11.2.4.5. Financials (Based on Availability)
- 11.2.5 Target
- 11.2.5.1. Overview
- 11.2.5.2. Products
- 11.2.5.3. SWOT Analysis
- 11.2.5.4. Recent Developments
- 11.2.5.5. Financials (Based on Availability)
- 11.2.6 Tesco
- 11.2.6.1. Overview
- 11.2.6.2. Products
- 11.2.6.3. SWOT Analysis
- 11.2.6.4. Recent Developments
- 11.2.6.5. Financials (Based on Availability)
- 11.2.7 Alibaba
- 11.2.7.1. Overview
- 11.2.7.2. Products
- 11.2.7.3. SWOT Analysis
- 11.2.7.4. Recent Developments
- 11.2.7.5. Financials (Based on Availability)
- 11.2.8 Carrefour
- 11.2.8.1. Overview
- 11.2.8.2. Products
- 11.2.8.3. SWOT Analysis
- 11.2.8.4. Recent Developments
- 11.2.8.5. Financials (Based on Availability)
- 11.2.9 ALDI
- 11.2.9.1. Overview
- 11.2.9.2. Products
- 11.2.9.3. SWOT Analysis
- 11.2.9.4. Recent Developments
- 11.2.9.5. Financials (Based on Availability)
- 11.2.10 Coles Online
- 11.2.10.1. Overview
- 11.2.10.2. Products
- 11.2.10.3. SWOT Analysis
- 11.2.10.4. Recent Developments
- 11.2.10.5. Financials (Based on Availability)
- 11.2.11 BigBasket
- 11.2.11.1. Overview
- 11.2.11.2. Products
- 11.2.11.3. SWOT Analysis
- 11.2.11.4. Recent Developments
- 11.2.11.5. Financials (Based on Availability)
- 11.2.12 Longo
- 11.2.12.1. Overview
- 11.2.12.2. Products
- 11.2.12.3. SWOT Analysis
- 11.2.12.4. Recent Developments
- 11.2.12.5. Financials (Based on Availability)
- 11.2.13 Schwan Food
- 11.2.13.1. Overview
- 11.2.13.2. Products
- 11.2.13.3. SWOT Analysis
- 11.2.13.4. Recent Developments
- 11.2.13.5. Financials (Based on Availability)
- 11.2.14 Honestbee
- 11.2.14.1. Overview
- 11.2.14.2. Products
- 11.2.14.3. SWOT Analysis
- 11.2.14.4. Recent Developments
- 11.2.14.5. Financials (Based on Availability)
- 11.2.1 Walmart
List of Figures
- Figure 1: Global e-grocery Sales Revenue Breakdown (million, %) by Region 2025 & 2033
- Figure 2: North America e-grocery Sales Revenue (million), by Application 2025 & 2033
- Figure 3: North America e-grocery Sales Revenue Share (%), by Application 2025 & 2033
- Figure 4: North America e-grocery Sales Revenue (million), by Types 2025 & 2033
- Figure 5: North America e-grocery Sales Revenue Share (%), by Types 2025 & 2033
- Figure 6: North America e-grocery Sales Revenue (million), by Country 2025 & 2033
- Figure 7: North America e-grocery Sales Revenue Share (%), by Country 2025 & 2033
- Figure 8: South America e-grocery Sales Revenue (million), by Application 2025 & 2033
- Figure 9: South America e-grocery Sales Revenue Share (%), by Application 2025 & 2033
- Figure 10: South America e-grocery Sales Revenue (million), by Types 2025 & 2033
- Figure 11: South America e-grocery Sales Revenue Share (%), by Types 2025 & 2033
- Figure 12: South America e-grocery Sales Revenue (million), by Country 2025 & 2033
- Figure 13: South America e-grocery Sales Revenue Share (%), by Country 2025 & 2033
- Figure 14: Europe e-grocery Sales Revenue (million), by Application 2025 & 2033
- Figure 15: Europe e-grocery Sales Revenue Share (%), by Application 2025 & 2033
- Figure 16: Europe e-grocery Sales Revenue (million), by Types 2025 & 2033
- Figure 17: Europe e-grocery Sales Revenue Share (%), by Types 2025 & 2033
- Figure 18: Europe e-grocery Sales Revenue (million), by Country 2025 & 2033
- Figure 19: Europe e-grocery Sales Revenue Share (%), by Country 2025 & 2033
- Figure 20: Middle East & Africa e-grocery Sales Revenue (million), by Application 2025 & 2033
- Figure 21: Middle East & Africa e-grocery Sales Revenue Share (%), by Application 2025 & 2033
- Figure 22: Middle East & Africa e-grocery Sales Revenue (million), by Types 2025 & 2033
- Figure 23: Middle East & Africa e-grocery Sales Revenue Share (%), by Types 2025 & 2033
- Figure 24: Middle East & Africa e-grocery Sales Revenue (million), by Country 2025 & 2033
- Figure 25: Middle East & Africa e-grocery Sales Revenue Share (%), by Country 2025 & 2033
- Figure 26: Asia Pacific e-grocery Sales Revenue (million), by Application 2025 & 2033
- Figure 27: Asia Pacific e-grocery Sales Revenue Share (%), by Application 2025 & 2033
- Figure 28: Asia Pacific e-grocery Sales Revenue (million), by Types 2025 & 2033
- Figure 29: Asia Pacific e-grocery Sales Revenue Share (%), by Types 2025 & 2033
- Figure 30: Asia Pacific e-grocery Sales Revenue (million), by Country 2025 & 2033
- Figure 31: Asia Pacific e-grocery Sales Revenue Share (%), by Country 2025 & 2033
List of Tables
- Table 1: Global e-grocery Sales Revenue million Forecast, by Application 2020 & 2033
- Table 2: Global e-grocery Sales Revenue million Forecast, by Types 2020 & 2033
- Table 3: Global e-grocery Sales Revenue million Forecast, by Region 2020 & 2033
- Table 4: Global e-grocery Sales Revenue million Forecast, by Application 2020 & 2033
- Table 5: Global e-grocery Sales Revenue million Forecast, by Types 2020 & 2033
- Table 6: Global e-grocery Sales Revenue million Forecast, by Country 2020 & 2033
- Table 7: United States e-grocery Sales Revenue (million) Forecast, by Application 2020 & 2033
- Table 8: Canada e-grocery Sales Revenue (million) Forecast, by Application 2020 & 2033
- Table 9: Mexico e-grocery Sales Revenue (million) Forecast, by Application 2020 & 2033
- Table 10: Global e-grocery Sales Revenue million Forecast, by Application 2020 & 2033
- Table 11: Global e-grocery Sales Revenue million Forecast, by Types 2020 & 2033
- Table 12: Global e-grocery Sales Revenue million Forecast, by Country 2020 & 2033
- Table 13: Brazil e-grocery Sales Revenue (million) Forecast, by Application 2020 & 2033
- Table 14: Argentina e-grocery Sales Revenue (million) Forecast, by Application 2020 & 2033
- Table 15: Rest of South America e-grocery Sales Revenue (million) Forecast, by Application 2020 & 2033
- Table 16: Global e-grocery Sales Revenue million Forecast, by Application 2020 & 2033
- Table 17: Global e-grocery Sales Revenue million Forecast, by Types 2020 & 2033
- Table 18: Global e-grocery Sales Revenue million Forecast, by Country 2020 & 2033
- Table 19: United Kingdom e-grocery Sales Revenue (million) Forecast, by Application 2020 & 2033
- Table 20: Germany e-grocery Sales Revenue (million) Forecast, by Application 2020 & 2033
- Table 21: France e-grocery Sales Revenue (million) Forecast, by Application 2020 & 2033
- Table 22: Italy e-grocery Sales Revenue (million) Forecast, by Application 2020 & 2033
- Table 23: Spain e-grocery Sales Revenue (million) Forecast, by Application 2020 & 2033
- Table 24: Russia e-grocery Sales Revenue (million) Forecast, by Application 2020 & 2033
- Table 25: Benelux e-grocery Sales Revenue (million) Forecast, by Application 2020 & 2033
- Table 26: Nordics e-grocery Sales Revenue (million) Forecast, by Application 2020 & 2033
- Table 27: Rest of Europe e-grocery Sales Revenue (million) Forecast, by Application 2020 & 2033
- Table 28: Global e-grocery Sales Revenue million Forecast, by Application 2020 & 2033
- Table 29: Global e-grocery Sales Revenue million Forecast, by Types 2020 & 2033
- Table 30: Global e-grocery Sales Revenue million Forecast, by Country 2020 & 2033
- Table 31: Turkey e-grocery Sales Revenue (million) Forecast, by Application 2020 & 2033
- Table 32: Israel e-grocery Sales Revenue (million) Forecast, by Application 2020 & 2033
- Table 33: GCC e-grocery Sales Revenue (million) Forecast, by Application 2020 & 2033
- Table 34: North Africa e-grocery Sales Revenue (million) Forecast, by Application 2020 & 2033
- Table 35: South Africa e-grocery Sales Revenue (million) Forecast, by Application 2020 & 2033
- Table 36: Rest of Middle East & Africa e-grocery Sales Revenue (million) Forecast, by Application 2020 & 2033
- Table 37: Global e-grocery Sales Revenue million Forecast, by Application 2020 & 2033
- Table 38: Global e-grocery Sales Revenue million Forecast, by Types 2020 & 2033
- Table 39: Global e-grocery Sales Revenue million Forecast, by Country 2020 & 2033
- Table 40: China e-grocery Sales Revenue (million) Forecast, by Application 2020 & 2033
- Table 41: India e-grocery Sales Revenue (million) Forecast, by Application 2020 & 2033
- Table 42: Japan e-grocery Sales Revenue (million) Forecast, by Application 2020 & 2033
- Table 43: South Korea e-grocery Sales Revenue (million) Forecast, by Application 2020 & 2033
- Table 44: ASEAN e-grocery Sales Revenue (million) Forecast, by Application 2020 & 2033
- Table 45: Oceania e-grocery Sales Revenue (million) Forecast, by Application 2020 & 2033
- Table 46: Rest of Asia Pacific e-grocery Sales Revenue (million) Forecast, by Application 2020 & 2033
Frequently Asked Questions
1. What is the projected Compound Annual Growth Rate (CAGR) of the e-grocery Sales?
The projected CAGR is approximately XX%.
2. Which companies are prominent players in the e-grocery Sales?
Key companies in the market include Walmart, Amazon, Kroger, FreshDirect, Target, Tesco, Alibaba, Carrefour, ALDI, Coles Online, BigBasket, Longo, Schwan Food, Honestbee.
3. What are the main segments of the e-grocery Sales?
The market segments include Application, Types.
4. Can you provide details about the market size?
The market size is estimated to be USD XXX million as of 2022.
5. What are some drivers contributing to market growth?
N/A
6. What are the notable trends driving market growth?
N/A
7. Are there any restraints impacting market growth?
N/A
8. Can you provide examples of recent developments in the market?
N/A
9. What pricing options are available for accessing the report?
Pricing options include single-user, multi-user, and enterprise licenses priced at USD 2900.00, USD 4350.00, and USD 5800.00 respectively.
10. Is the market size provided in terms of value or volume?
The market size is provided in terms of value, measured in million.
11. Are there any specific market keywords associated with the report?
Yes, the market keyword associated with the report is "e-grocery Sales," which aids in identifying and referencing the specific market segment covered.
12. How do I determine which pricing option suits my needs best?
The pricing options vary based on user requirements and access needs. Individual users may opt for single-user licenses, while businesses requiring broader access may choose multi-user or enterprise licenses for cost-effective access to the report.
13. Are there any additional resources or data provided in the e-grocery Sales report?
While the report offers comprehensive insights, it's advisable to review the specific contents or supplementary materials provided to ascertain if additional resources or data are available.
14. How can I stay updated on further developments or reports in the e-grocery Sales?
To stay informed about further developments, trends, and reports in the e-grocery Sales, consider subscribing to industry newsletters, following relevant companies and organizations, or regularly checking reputable industry news sources and publications.
Methodology
Step 1 - Identification of Relevant Samples Size from Population Database


Step 2 - Approaches for Defining Global Market Size (Value, Volume* & Price*)

Note*: In applicable scenarios
Step 3 - Data Sources
Primary Research
- Web Analytics
- Survey Reports
- Research Institute
- Latest Research Reports
- Opinion Leaders
Secondary Research
- Annual Reports
- White Paper
- Latest Press Release
- Industry Association
- Paid Database
- Investor Presentations

Step 4 - Data Triangulation
Involves using different sources of information in order to increase the validity of a study
These sources are likely to be stakeholders in a program - participants, other researchers, program staff, other community members, and so on.
Then we put all data in single framework & apply various statistical tools to find out the dynamic on the market.
During the analysis stage, feedback from the stakeholder groups would be compared to determine areas of agreement as well as areas of divergence