

Key Insights
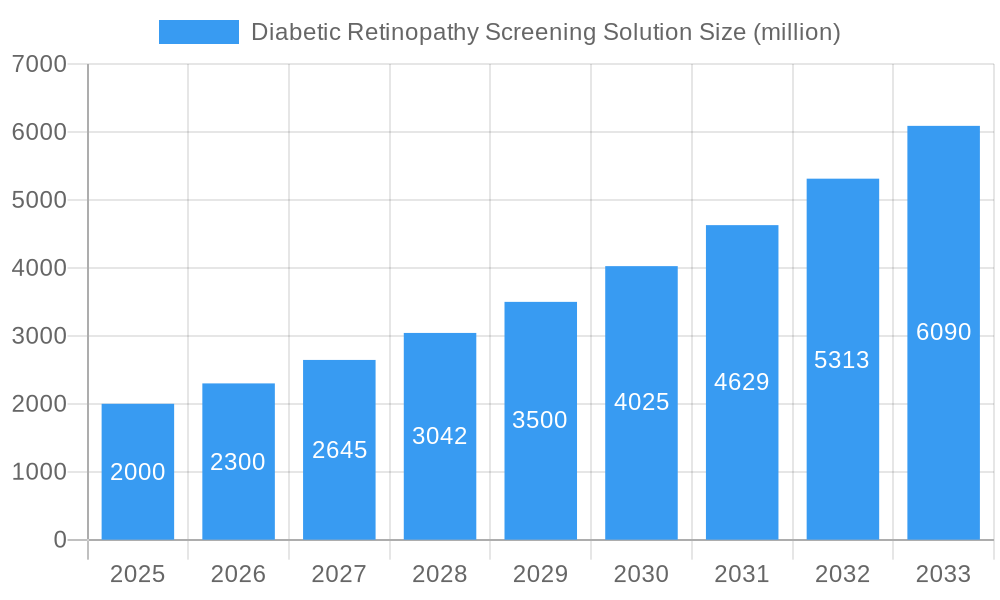
The global diabetic retinopathy (DR) screening solution market is experiencing robust growth, driven by the escalating prevalence of diabetes worldwide and the increasing awareness of DR as a leading cause of blindness. The market, currently estimated at $2 billion in 2025, is projected to achieve a Compound Annual Growth Rate (CAGR) of 15% from 2025 to 2033, reaching approximately $6.5 billion by 2033. This growth is fueled by several key factors, including technological advancements in AI-powered image analysis, the rising adoption of telemedicine for remote DR screening, and increasing government initiatives to improve early detection and management of diabetic eye diseases. Furthermore, the development of more cost-effective and accessible screening solutions is broadening market reach, particularly in underserved populations. Key players like Retina-AI Health, IRIS, and Eyenuk are actively contributing to this growth through innovation and strategic partnerships.
Diabetic Retinopathy Screening Solution Market Size (In Billion)
However, market expansion faces certain restraints. High initial investment costs associated with advanced screening technologies can limit adoption, especially in resource-constrained healthcare settings. Data privacy concerns and the need for robust regulatory frameworks to ensure the accuracy and reliability of AI-based diagnostic tools also present challenges. Despite these limitations, the long-term market outlook remains positive, driven by the significant unmet need for efficient and effective DR screening, particularly given the projected increase in the diabetic population globally. Market segmentation reveals a growing demand for AI-driven solutions, and ongoing research and development efforts focused on improving diagnostic accuracy and expanding access will further fuel market expansion throughout the forecast period.
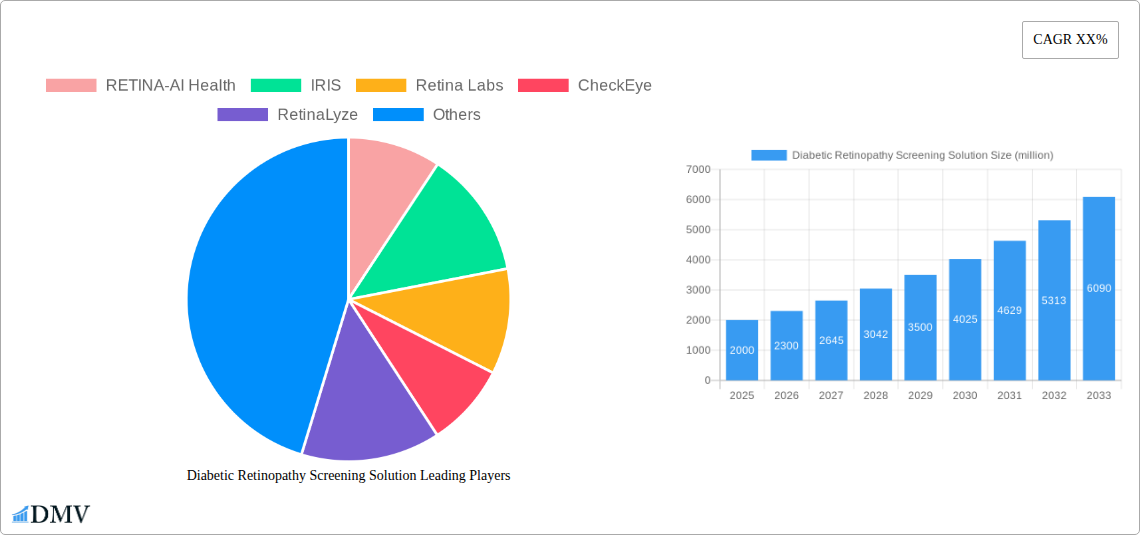
Diabetic Retinopathy Screening Solution Company Market Share
Diabetic Retinopathy Screening Solution Market Report: 2019-2033
This comprehensive report provides an in-depth analysis of the global Diabetic Retinopathy Screening Solution market, projecting a market value exceeding $XX million by 2033. The study covers the period from 2019 to 2033, with a focus on the forecast period (2025-2033), utilizing 2025 as the base and estimated year. Key players analyzed include RETINA-AI Health, IRIS, Retina Labs, CheckEye, RetinaLyze, NEC Software, InHealth Intelligence, RetinaRisk, Thirona Retina, Synapxe, Eyenuk, EyRIS (SELENA+), and Vistel. This report is invaluable for stakeholders seeking to understand market dynamics, identify growth opportunities, and make informed strategic decisions.
Diabetic Retinopathy Screening Solution Market Composition & Trends
The global Diabetic Retinopathy Screening Solution market is characterized by a moderately concentrated landscape, with a few major players holding significant market share. In 2025, the top five companies—estimated to be RETINA-AI Health, IRIS, Retina Labs, CheckEye, and RetinaLyze—are projected to collectively control approximately xx% of the market. This concentration is driven by factors including substantial R&D investments, established brand recognition, and early adoption of advanced technologies. Innovation is a key catalyst, with continuous advancements in AI-powered image analysis, telemedicine integration, and non-invasive screening techniques shaping the market landscape. Regulatory landscapes vary across regions, influencing market access and adoption rates. Substitute products are limited, primarily involving traditional methods which are less efficient and less precise. End-users primarily include ophthalmologists, optometrists, and diabetic clinics, with increasing adoption by primary care physicians. M&A activity in this space has been moderate, with several deals exceeding $xx million in value during the historical period (2019-2024).
- Market Share Distribution (2025): RETINA-AI Health (xx%), IRIS (xx%), Retina Labs (xx%), CheckEye (xx%), RetinaLyze (xx%), Others (xx%).
- M&A Deal Value (2019-2024): Total estimated value exceeding $xx million.
- Key Innovation Catalysts: AI-powered image analysis, telemedicine integration, non-invasive screening technologies.
Diabetic Retinopathy Screening Solution Industry Evolution
The Diabetic Retinopathy Screening Solution market has experienced significant growth driven by the increasing prevalence of diabetes globally and technological advancements enabling earlier and more accurate diagnosis. The market witnessed a Compound Annual Growth Rate (CAGR) of xx% during the historical period (2019-2024) and is projected to maintain a CAGR of xx% during the forecast period (2025-2033), reaching an estimated market value of $XX million by 2033. This growth is fueled by the rising adoption of AI-powered solutions offering faster, more accurate, and cost-effective screening compared to traditional methods. Furthermore, telemedicine integration is expanding access to screening services, particularly in underserved populations. Consumer demand for convenient, non-invasive, and accurate screening options is driving the market evolution. The adoption rate of AI-based screening solutions is increasing rapidly, with xx% of diabetic patients estimated to have used AI-based screening by 2025.
Leading Regions, Countries, or Segments in Diabetic Retinopathy Screening Solution
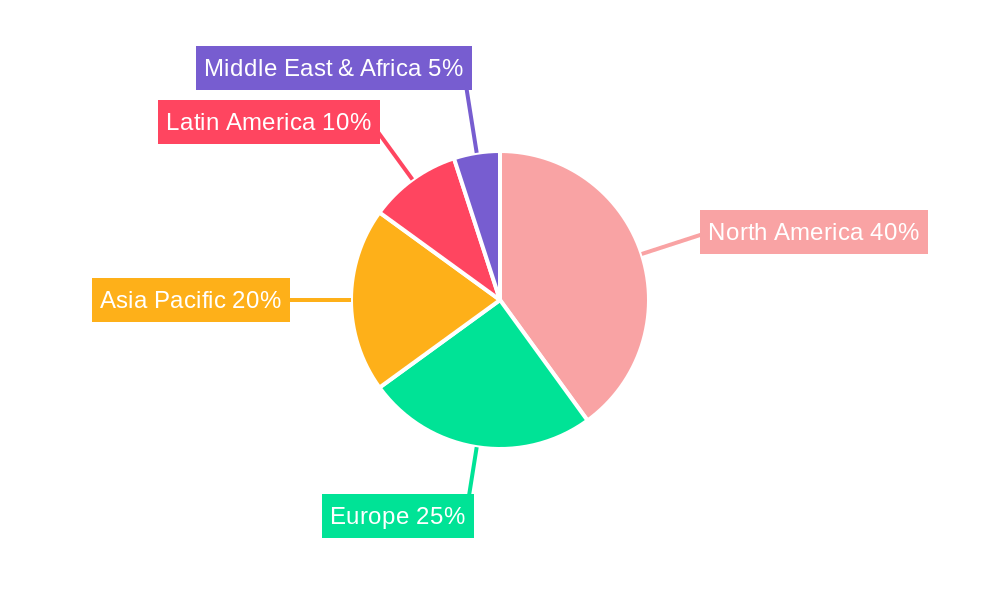
The North American region dominates the Diabetic Retinopathy Screening Solution market, driven primarily by high diabetes prevalence, robust healthcare infrastructure, and early adoption of advanced technologies. This dominance is further fueled by substantial investments in R&D, favorable regulatory environments supporting the adoption of new technologies, and increasing government initiatives promoting early detection of diabetic retinopathy. Other key regions include Europe and Asia-Pacific, experiencing significant growth driven by rising diabetes prevalence and increasing healthcare spending.
- Key Drivers for North American Dominance:
- High diabetes prevalence.
- Strong healthcare infrastructure and investment in technological advancements.
- Favorable regulatory environment for new medical technologies.
- Increased government initiatives promoting early detection and prevention of diabetic retinopathy.
- Growth in Other Regions: Europe and Asia-Pacific markets are experiencing significant growth due to increasing diabetes prevalence and rising healthcare expenditures.
Diabetic Retinopathy Screening Solution Product Innovations
Recent innovations in Diabetic Retinopathy Screening Solutions include the integration of AI algorithms for improved accuracy and efficiency in image analysis, the development of portable and user-friendly devices for decentralized screening, and the implementation of cloud-based platforms for data management and analysis. These advancements offer improved diagnostic capabilities, reduced costs, and increased accessibility to screening services. Unique selling propositions encompass superior image quality, faster processing times, improved diagnostic accuracy, and seamless integration with existing Electronic Health Records (EHR) systems. Technological advancements in AI and machine learning are continuously enhancing the speed and accuracy of diabetic retinopathy detection.
Propelling Factors for Diabetic Retinopathy Screening Solution Growth
Several factors propel the growth of the Diabetic Retinopathy Screening Solution market. Technological advancements, such as AI-powered image analysis and improved imaging techniques, significantly enhance diagnostic accuracy and efficiency. The increasing prevalence of diabetes globally fuels the demand for effective screening solutions. Favorable regulatory policies, particularly in developed countries, accelerate market adoption by streamlining the approval process for new technologies. Cost-effectiveness compared to traditional methods also contributes significantly to the market's expansion, making it more accessible to a broader range of healthcare providers.
Obstacles in the Diabetic Retinopathy Screening Solution Market
The Diabetic Retinopathy Screening Solution market faces several challenges. Stringent regulatory approvals and reimbursement policies can delay market entry and limit accessibility. Supply chain disruptions related to manufacturing and distribution can impact product availability and pricing. Intense competition among existing players and the entry of new companies can exert downward pressure on prices and margins. The reluctance of some healthcare professionals to adopt new technologies can also hinder widespread market penetration. These factors can collectively impact the market growth trajectory in various regions.
Future Opportunities in Diabetic Retinopathy Screening Solution
Emerging opportunities lie in expanding market penetration in underserved regions, developing more sophisticated AI algorithms for early and more accurate detection, integrating screening solutions with broader telehealth platforms, and exploring new applications such as remote patient monitoring. Further opportunities exist in the development of cost-effective, portable screening devices for use in low-resource settings, thus improving global access to crucial diabetic retinopathy screening.
Major Players in the Diabetic Retinopathy Screening Solution Ecosystem
- RETINA-AI Health
- IRIS
- Retina Labs
- CheckEye
- RetinaLyze
- NEC Software
- InHealth Intelligence
- RetinaRisk
- Thirona Retina
- Synapxe
- Eyenuk
- EyRIS (SELENA+)
- Vistel
Key Developments in Diabetic Retinopathy Screening Solution Industry
- 2022 Q4: RETINA-AI Health announced FDA clearance for its advanced AI-powered diabetic retinopathy screening software.
- 2023 Q1: IRIS launched a new telemedicine platform integrating its diabetic retinopathy screening technology.
- 2023 Q2: Retina Labs partnered with a major pharmaceutical company to expand access to its screening services.
- (Add more specific examples as available)
Strategic Diabetic Retinopathy Screening Solution Market Forecast
The Diabetic Retinopathy Screening Solution market is poised for sustained growth, driven by technological advancements, increasing diabetes prevalence, and supportive regulatory environments. The continued integration of AI, telemedicine, and improved imaging techniques will enhance diagnostic accuracy, cost-effectiveness, and accessibility. Expansion into new markets, especially in developing countries, presents significant opportunities. The market's future potential remains substantial, with the projected market value exceeding $XX million by 2033.
Diabetic Retinopathy Screening Solution Segmentation
-
1. Application
- 1.1. Medical Industry
- 1.2. Scientific Research
- 1.3. Others
-
2. Types
- 2.1. Traditional
- 2.2. Artificial Intelligence
- 2.3. Others
Diabetic Retinopathy Screening Solution Segmentation By Geography
-
1. North America
- 1.1. United States
- 1.2. Canada
- 1.3. Mexico
-
2. South America
- 2.1. Brazil
- 2.2. Argentina
- 2.3. Rest of South America
-
3. Europe
- 3.1. United Kingdom
- 3.2. Germany
- 3.3. France
- 3.4. Italy
- 3.5. Spain
- 3.6. Russia
- 3.7. Benelux
- 3.8. Nordics
- 3.9. Rest of Europe
-
4. Middle East & Africa
- 4.1. Turkey
- 4.2. Israel
- 4.3. GCC
- 4.4. North Africa
- 4.5. South Africa
- 4.6. Rest of Middle East & Africa
-
5. Asia Pacific
- 5.1. China
- 5.2. India
- 5.3. Japan
- 5.4. South Korea
- 5.5. ASEAN
- 5.6. Oceania
- 5.7. Rest of Asia Pacific
Diabetic Retinopathy Screening Solution Regional Market Share
Geographic Coverage of Diabetic Retinopathy Screening Solution
Diabetic Retinopathy Screening Solution REPORT HIGHLIGHTS
| Aspects | Details |
|---|---|
| Study Period | 2020-2034 |
| Base Year | 2025 |
| Estimated Year | 2026 |
| Forecast Period | 2026-2034 |
| Historical Period | 2020-2025 |
| Growth Rate | CAGR of 6.9% from 2020-2034 |
| Segmentation |
|
Table of Contents
- 1. Introduction
- 1.1. Research Scope
- 1.2. Market Segmentation
- 1.3. Research Methodology
- 1.4. Definitions and Assumptions
- 2. Executive Summary
- 2.1. Introduction
- 3. Market Dynamics
- 3.1. Introduction
- 3.2. Market Drivers
- 3.3. Market Restrains
- 3.4. Market Trends
- 4. Market Factor Analysis
- 4.1. Porters Five Forces
- 4.2. Supply/Value Chain
- 4.3. PESTEL analysis
- 4.4. Market Entropy
- 4.5. Patent/Trademark Analysis
- 5. Global Diabetic Retinopathy Screening Solution Analysis, Insights and Forecast, 2020-2032
- 5.1. Market Analysis, Insights and Forecast - by Application
- 5.1.1. Medical Industry
- 5.1.2. Scientific Research
- 5.1.3. Others
- 5.2. Market Analysis, Insights and Forecast - by Types
- 5.2.1. Traditional
- 5.2.2. Artificial Intelligence
- 5.2.3. Others
- 5.3. Market Analysis, Insights and Forecast - by Region
- 5.3.1. North America
- 5.3.2. South America
- 5.3.3. Europe
- 5.3.4. Middle East & Africa
- 5.3.5. Asia Pacific
- 5.1. Market Analysis, Insights and Forecast - by Application
- 6. North America Diabetic Retinopathy Screening Solution Analysis, Insights and Forecast, 2020-2032
- 6.1. Market Analysis, Insights and Forecast - by Application
- 6.1.1. Medical Industry
- 6.1.2. Scientific Research
- 6.1.3. Others
- 6.2. Market Analysis, Insights and Forecast - by Types
- 6.2.1. Traditional
- 6.2.2. Artificial Intelligence
- 6.2.3. Others
- 6.1. Market Analysis, Insights and Forecast - by Application
- 7. South America Diabetic Retinopathy Screening Solution Analysis, Insights and Forecast, 2020-2032
- 7.1. Market Analysis, Insights and Forecast - by Application
- 7.1.1. Medical Industry
- 7.1.2. Scientific Research
- 7.1.3. Others
- 7.2. Market Analysis, Insights and Forecast - by Types
- 7.2.1. Traditional
- 7.2.2. Artificial Intelligence
- 7.2.3. Others
- 7.1. Market Analysis, Insights and Forecast - by Application
- 8. Europe Diabetic Retinopathy Screening Solution Analysis, Insights and Forecast, 2020-2032
- 8.1. Market Analysis, Insights and Forecast - by Application
- 8.1.1. Medical Industry
- 8.1.2. Scientific Research
- 8.1.3. Others
- 8.2. Market Analysis, Insights and Forecast - by Types
- 8.2.1. Traditional
- 8.2.2. Artificial Intelligence
- 8.2.3. Others
- 8.1. Market Analysis, Insights and Forecast - by Application
- 9. Middle East & Africa Diabetic Retinopathy Screening Solution Analysis, Insights and Forecast, 2020-2032
- 9.1. Market Analysis, Insights and Forecast - by Application
- 9.1.1. Medical Industry
- 9.1.2. Scientific Research
- 9.1.3. Others
- 9.2. Market Analysis, Insights and Forecast - by Types
- 9.2.1. Traditional
- 9.2.2. Artificial Intelligence
- 9.2.3. Others
- 9.1. Market Analysis, Insights and Forecast - by Application
- 10. Asia Pacific Diabetic Retinopathy Screening Solution Analysis, Insights and Forecast, 2020-2032
- 10.1. Market Analysis, Insights and Forecast - by Application
- 10.1.1. Medical Industry
- 10.1.2. Scientific Research
- 10.1.3. Others
- 10.2. Market Analysis, Insights and Forecast - by Types
- 10.2.1. Traditional
- 10.2.2. Artificial Intelligence
- 10.2.3. Others
- 10.1. Market Analysis, Insights and Forecast - by Application
- 11. Competitive Analysis
- 11.1. Global Market Share Analysis 2025
- 11.2. Company Profiles
- 11.2.1 RETINA-AI Health
- 11.2.1.1. Overview
- 11.2.1.2. Products
- 11.2.1.3. SWOT Analysis
- 11.2.1.4. Recent Developments
- 11.2.1.5. Financials (Based on Availability)
- 11.2.2 IRIS
- 11.2.2.1. Overview
- 11.2.2.2. Products
- 11.2.2.3. SWOT Analysis
- 11.2.2.4. Recent Developments
- 11.2.2.5. Financials (Based on Availability)
- 11.2.3 Retina Labs
- 11.2.3.1. Overview
- 11.2.3.2. Products
- 11.2.3.3. SWOT Analysis
- 11.2.3.4. Recent Developments
- 11.2.3.5. Financials (Based on Availability)
- 11.2.4 CheckEye
- 11.2.4.1. Overview
- 11.2.4.2. Products
- 11.2.4.3. SWOT Analysis
- 11.2.4.4. Recent Developments
- 11.2.4.5. Financials (Based on Availability)
- 11.2.5 RetinaLyze
- 11.2.5.1. Overview
- 11.2.5.2. Products
- 11.2.5.3. SWOT Analysis
- 11.2.5.4. Recent Developments
- 11.2.5.5. Financials (Based on Availability)
- 11.2.6 NEC Software
- 11.2.6.1. Overview
- 11.2.6.2. Products
- 11.2.6.3. SWOT Analysis
- 11.2.6.4. Recent Developments
- 11.2.6.5. Financials (Based on Availability)
- 11.2.7 InHealth Intelligence
- 11.2.7.1. Overview
- 11.2.7.2. Products
- 11.2.7.3. SWOT Analysis
- 11.2.7.4. Recent Developments
- 11.2.7.5. Financials (Based on Availability)
- 11.2.8 RetinaRisk
- 11.2.8.1. Overview
- 11.2.8.2. Products
- 11.2.8.3. SWOT Analysis
- 11.2.8.4. Recent Developments
- 11.2.8.5. Financials (Based on Availability)
- 11.2.9 Thirona Retina
- 11.2.9.1. Overview
- 11.2.9.2. Products
- 11.2.9.3. SWOT Analysis
- 11.2.9.4. Recent Developments
- 11.2.9.5. Financials (Based on Availability)
- 11.2.10 Synapxe
- 11.2.10.1. Overview
- 11.2.10.2. Products
- 11.2.10.3. SWOT Analysis
- 11.2.10.4. Recent Developments
- 11.2.10.5. Financials (Based on Availability)
- 11.2.11 Eyenuk
- 11.2.11.1. Overview
- 11.2.11.2. Products
- 11.2.11.3. SWOT Analysis
- 11.2.11.4. Recent Developments
- 11.2.11.5. Financials (Based on Availability)
- 11.2.12 EyRIS (SELENA+)
- 11.2.12.1. Overview
- 11.2.12.2. Products
- 11.2.12.3. SWOT Analysis
- 11.2.12.4. Recent Developments
- 11.2.12.5. Financials (Based on Availability)
- 11.2.13 Vistel
- 11.2.13.1. Overview
- 11.2.13.2. Products
- 11.2.13.3. SWOT Analysis
- 11.2.13.4. Recent Developments
- 11.2.13.5. Financials (Based on Availability)
- 11.2.1 RETINA-AI Health
List of Figures
- Figure 1: Global Diabetic Retinopathy Screening Solution Revenue Breakdown (undefined, %) by Region 2025 & 2033
- Figure 2: North America Diabetic Retinopathy Screening Solution Revenue (undefined), by Application 2025 & 2033
- Figure 3: North America Diabetic Retinopathy Screening Solution Revenue Share (%), by Application 2025 & 2033
- Figure 4: North America Diabetic Retinopathy Screening Solution Revenue (undefined), by Types 2025 & 2033
- Figure 5: North America Diabetic Retinopathy Screening Solution Revenue Share (%), by Types 2025 & 2033
- Figure 6: North America Diabetic Retinopathy Screening Solution Revenue (undefined), by Country 2025 & 2033
- Figure 7: North America Diabetic Retinopathy Screening Solution Revenue Share (%), by Country 2025 & 2033
- Figure 8: South America Diabetic Retinopathy Screening Solution Revenue (undefined), by Application 2025 & 2033
- Figure 9: South America Diabetic Retinopathy Screening Solution Revenue Share (%), by Application 2025 & 2033
- Figure 10: South America Diabetic Retinopathy Screening Solution Revenue (undefined), by Types 2025 & 2033
- Figure 11: South America Diabetic Retinopathy Screening Solution Revenue Share (%), by Types 2025 & 2033
- Figure 12: South America Diabetic Retinopathy Screening Solution Revenue (undefined), by Country 2025 & 2033
- Figure 13: South America Diabetic Retinopathy Screening Solution Revenue Share (%), by Country 2025 & 2033
- Figure 14: Europe Diabetic Retinopathy Screening Solution Revenue (undefined), by Application 2025 & 2033
- Figure 15: Europe Diabetic Retinopathy Screening Solution Revenue Share (%), by Application 2025 & 2033
- Figure 16: Europe Diabetic Retinopathy Screening Solution Revenue (undefined), by Types 2025 & 2033
- Figure 17: Europe Diabetic Retinopathy Screening Solution Revenue Share (%), by Types 2025 & 2033
- Figure 18: Europe Diabetic Retinopathy Screening Solution Revenue (undefined), by Country 2025 & 2033
- Figure 19: Europe Diabetic Retinopathy Screening Solution Revenue Share (%), by Country 2025 & 2033
- Figure 20: Middle East & Africa Diabetic Retinopathy Screening Solution Revenue (undefined), by Application 2025 & 2033
- Figure 21: Middle East & Africa Diabetic Retinopathy Screening Solution Revenue Share (%), by Application 2025 & 2033
- Figure 22: Middle East & Africa Diabetic Retinopathy Screening Solution Revenue (undefined), by Types 2025 & 2033
- Figure 23: Middle East & Africa Diabetic Retinopathy Screening Solution Revenue Share (%), by Types 2025 & 2033
- Figure 24: Middle East & Africa Diabetic Retinopathy Screening Solution Revenue (undefined), by Country 2025 & 2033
- Figure 25: Middle East & Africa Diabetic Retinopathy Screening Solution Revenue Share (%), by Country 2025 & 2033
- Figure 26: Asia Pacific Diabetic Retinopathy Screening Solution Revenue (undefined), by Application 2025 & 2033
- Figure 27: Asia Pacific Diabetic Retinopathy Screening Solution Revenue Share (%), by Application 2025 & 2033
- Figure 28: Asia Pacific Diabetic Retinopathy Screening Solution Revenue (undefined), by Types 2025 & 2033
- Figure 29: Asia Pacific Diabetic Retinopathy Screening Solution Revenue Share (%), by Types 2025 & 2033
- Figure 30: Asia Pacific Diabetic Retinopathy Screening Solution Revenue (undefined), by Country 2025 & 2033
- Figure 31: Asia Pacific Diabetic Retinopathy Screening Solution Revenue Share (%), by Country 2025 & 2033
List of Tables
- Table 1: Global Diabetic Retinopathy Screening Solution Revenue undefined Forecast, by Application 2020 & 2033
- Table 2: Global Diabetic Retinopathy Screening Solution Revenue undefined Forecast, by Types 2020 & 2033
- Table 3: Global Diabetic Retinopathy Screening Solution Revenue undefined Forecast, by Region 2020 & 2033
- Table 4: Global Diabetic Retinopathy Screening Solution Revenue undefined Forecast, by Application 2020 & 2033
- Table 5: Global Diabetic Retinopathy Screening Solution Revenue undefined Forecast, by Types 2020 & 2033
- Table 6: Global Diabetic Retinopathy Screening Solution Revenue undefined Forecast, by Country 2020 & 2033
- Table 7: United States Diabetic Retinopathy Screening Solution Revenue (undefined) Forecast, by Application 2020 & 2033
- Table 8: Canada Diabetic Retinopathy Screening Solution Revenue (undefined) Forecast, by Application 2020 & 2033
- Table 9: Mexico Diabetic Retinopathy Screening Solution Revenue (undefined) Forecast, by Application 2020 & 2033
- Table 10: Global Diabetic Retinopathy Screening Solution Revenue undefined Forecast, by Application 2020 & 2033
- Table 11: Global Diabetic Retinopathy Screening Solution Revenue undefined Forecast, by Types 2020 & 2033
- Table 12: Global Diabetic Retinopathy Screening Solution Revenue undefined Forecast, by Country 2020 & 2033
- Table 13: Brazil Diabetic Retinopathy Screening Solution Revenue (undefined) Forecast, by Application 2020 & 2033
- Table 14: Argentina Diabetic Retinopathy Screening Solution Revenue (undefined) Forecast, by Application 2020 & 2033
- Table 15: Rest of South America Diabetic Retinopathy Screening Solution Revenue (undefined) Forecast, by Application 2020 & 2033
- Table 16: Global Diabetic Retinopathy Screening Solution Revenue undefined Forecast, by Application 2020 & 2033
- Table 17: Global Diabetic Retinopathy Screening Solution Revenue undefined Forecast, by Types 2020 & 2033
- Table 18: Global Diabetic Retinopathy Screening Solution Revenue undefined Forecast, by Country 2020 & 2033
- Table 19: United Kingdom Diabetic Retinopathy Screening Solution Revenue (undefined) Forecast, by Application 2020 & 2033
- Table 20: Germany Diabetic Retinopathy Screening Solution Revenue (undefined) Forecast, by Application 2020 & 2033
- Table 21: France Diabetic Retinopathy Screening Solution Revenue (undefined) Forecast, by Application 2020 & 2033
- Table 22: Italy Diabetic Retinopathy Screening Solution Revenue (undefined) Forecast, by Application 2020 & 2033
- Table 23: Spain Diabetic Retinopathy Screening Solution Revenue (undefined) Forecast, by Application 2020 & 2033
- Table 24: Russia Diabetic Retinopathy Screening Solution Revenue (undefined) Forecast, by Application 2020 & 2033
- Table 25: Benelux Diabetic Retinopathy Screening Solution Revenue (undefined) Forecast, by Application 2020 & 2033
- Table 26: Nordics Diabetic Retinopathy Screening Solution Revenue (undefined) Forecast, by Application 2020 & 2033
- Table 27: Rest of Europe Diabetic Retinopathy Screening Solution Revenue (undefined) Forecast, by Application 2020 & 2033
- Table 28: Global Diabetic Retinopathy Screening Solution Revenue undefined Forecast, by Application 2020 & 2033
- Table 29: Global Diabetic Retinopathy Screening Solution Revenue undefined Forecast, by Types 2020 & 2033
- Table 30: Global Diabetic Retinopathy Screening Solution Revenue undefined Forecast, by Country 2020 & 2033
- Table 31: Turkey Diabetic Retinopathy Screening Solution Revenue (undefined) Forecast, by Application 2020 & 2033
- Table 32: Israel Diabetic Retinopathy Screening Solution Revenue (undefined) Forecast, by Application 2020 & 2033
- Table 33: GCC Diabetic Retinopathy Screening Solution Revenue (undefined) Forecast, by Application 2020 & 2033
- Table 34: North Africa Diabetic Retinopathy Screening Solution Revenue (undefined) Forecast, by Application 2020 & 2033
- Table 35: South Africa Diabetic Retinopathy Screening Solution Revenue (undefined) Forecast, by Application 2020 & 2033
- Table 36: Rest of Middle East & Africa Diabetic Retinopathy Screening Solution Revenue (undefined) Forecast, by Application 2020 & 2033
- Table 37: Global Diabetic Retinopathy Screening Solution Revenue undefined Forecast, by Application 2020 & 2033
- Table 38: Global Diabetic Retinopathy Screening Solution Revenue undefined Forecast, by Types 2020 & 2033
- Table 39: Global Diabetic Retinopathy Screening Solution Revenue undefined Forecast, by Country 2020 & 2033
- Table 40: China Diabetic Retinopathy Screening Solution Revenue (undefined) Forecast, by Application 2020 & 2033
- Table 41: India Diabetic Retinopathy Screening Solution Revenue (undefined) Forecast, by Application 2020 & 2033
- Table 42: Japan Diabetic Retinopathy Screening Solution Revenue (undefined) Forecast, by Application 2020 & 2033
- Table 43: South Korea Diabetic Retinopathy Screening Solution Revenue (undefined) Forecast, by Application 2020 & 2033
- Table 44: ASEAN Diabetic Retinopathy Screening Solution Revenue (undefined) Forecast, by Application 2020 & 2033
- Table 45: Oceania Diabetic Retinopathy Screening Solution Revenue (undefined) Forecast, by Application 2020 & 2033
- Table 46: Rest of Asia Pacific Diabetic Retinopathy Screening Solution Revenue (undefined) Forecast, by Application 2020 & 2033
Frequently Asked Questions
1. What is the projected Compound Annual Growth Rate (CAGR) of the Diabetic Retinopathy Screening Solution?
The projected CAGR is approximately 6.9%.
2. Which companies are prominent players in the Diabetic Retinopathy Screening Solution?
Key companies in the market include RETINA-AI Health, IRIS, Retina Labs, CheckEye, RetinaLyze, NEC Software, InHealth Intelligence, RetinaRisk, Thirona Retina, Synapxe, Eyenuk, EyRIS (SELENA+), Vistel.
3. What are the main segments of the Diabetic Retinopathy Screening Solution?
The market segments include Application, Types.
4. Can you provide details about the market size?
The market size is estimated to be USD XXX N/A as of 2022.
5. What are some drivers contributing to market growth?
N/A
6. What are the notable trends driving market growth?
N/A
7. Are there any restraints impacting market growth?
N/A
8. Can you provide examples of recent developments in the market?
N/A
9. What pricing options are available for accessing the report?
Pricing options include single-user, multi-user, and enterprise licenses priced at USD 4900.00, USD 7350.00, and USD 9800.00 respectively.
10. Is the market size provided in terms of value or volume?
The market size is provided in terms of value, measured in N/A.
11. Are there any specific market keywords associated with the report?
Yes, the market keyword associated with the report is "Diabetic Retinopathy Screening Solution," which aids in identifying and referencing the specific market segment covered.
12. How do I determine which pricing option suits my needs best?
The pricing options vary based on user requirements and access needs. Individual users may opt for single-user licenses, while businesses requiring broader access may choose multi-user or enterprise licenses for cost-effective access to the report.
13. Are there any additional resources or data provided in the Diabetic Retinopathy Screening Solution report?
While the report offers comprehensive insights, it's advisable to review the specific contents or supplementary materials provided to ascertain if additional resources or data are available.
14. How can I stay updated on further developments or reports in the Diabetic Retinopathy Screening Solution?
To stay informed about further developments, trends, and reports in the Diabetic Retinopathy Screening Solution, consider subscribing to industry newsletters, following relevant companies and organizations, or regularly checking reputable industry news sources and publications.
Methodology
Step 1 - Identification of Relevant Samples Size from Population Database


Step 2 - Approaches for Defining Global Market Size (Value, Volume* & Price*)

Note*: In applicable scenarios
Step 3 - Data Sources
Primary Research
- Web Analytics
- Survey Reports
- Research Institute
- Latest Research Reports
- Opinion Leaders
Secondary Research
- Annual Reports
- White Paper
- Latest Press Release
- Industry Association
- Paid Database
- Investor Presentations

Step 4 - Data Triangulation
Involves using different sources of information in order to increase the validity of a study
These sources are likely to be stakeholders in a program - participants, other researchers, program staff, other community members, and so on.
Then we put all data in single framework & apply various statistical tools to find out the dynamic on the market.
During the analysis stage, feedback from the stakeholder groups would be compared to determine areas of agreement as well as areas of divergence