

Key Insights
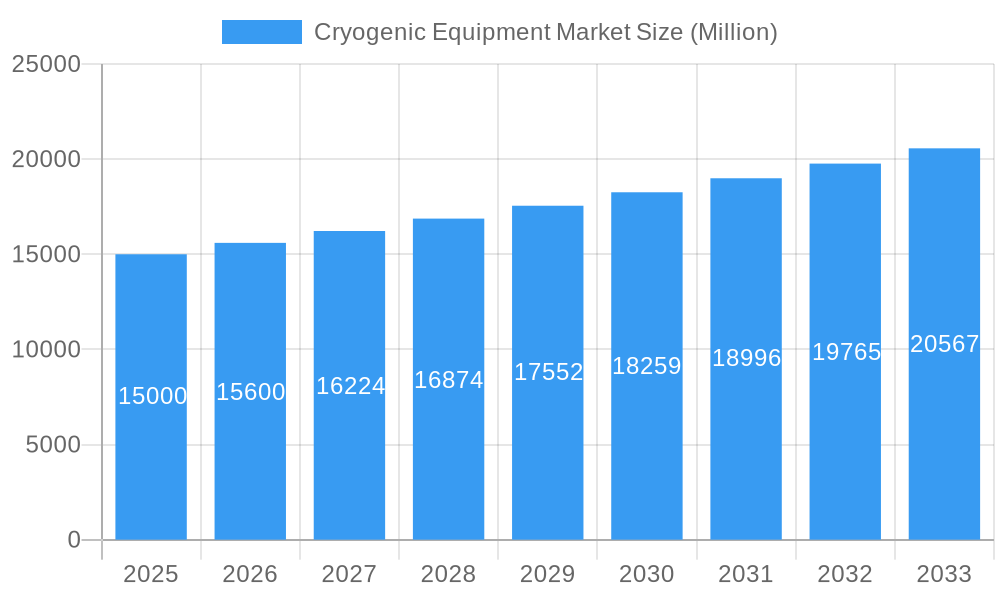
The global cryogenic equipment market is poised for significant expansion, projected to reach $26.6 billion by 2025, with a Compound Annual Growth Rate (CAGR) of 6.8% through 2033. This growth is propelled by escalating demand in the energy and power sector, notably the widespread adoption of liquefied natural gas (LNG) in transportation and storage. The food and beverage industry's increasing reliance on advanced cryogenic freezing and preservation techniques also fuels market expansion. Technological innovations are yielding more efficient and cost-effective cryogenic equipment, further stimulating growth. Additionally, the healthcare sector's expanding use of cryogenic solutions for applications such as cryosurgery and cryopreservation contributes to this upward trend. Emerging economies in the Asia-Pacific and Middle East & Africa regions present considerable untapped market potential.
Cryogenic Equipment Market Market Size (In Billion)
Despite a positive outlook, the market encounters challenges including high initial capital expenditure, stringent safety regulations, and the need for specialized operational expertise. Volatile raw material prices and environmental considerations associated with certain cryogenic gases also influence market dynamics. Nevertheless, sustained growth across pivotal end-user industries and ongoing technological advancements underpin a robust long-term forecast. Market segmentation by end-user (e.g., Oil & Gas, Energy & Power, Food & Beverage), equipment type (e.g., Tanks, Pumps, Heat Exchangers), application (e.g., Storage, Transportation, Processing), and gas type (e.g., Liquefied Nitrogen, Liquefied Helium) offers critical insights into market trends and future opportunities. A competitive analysis of leading players, including Linde PLC and Honeywell International Inc., highlights a focus on innovation and strategic alliances to strengthen market positions.
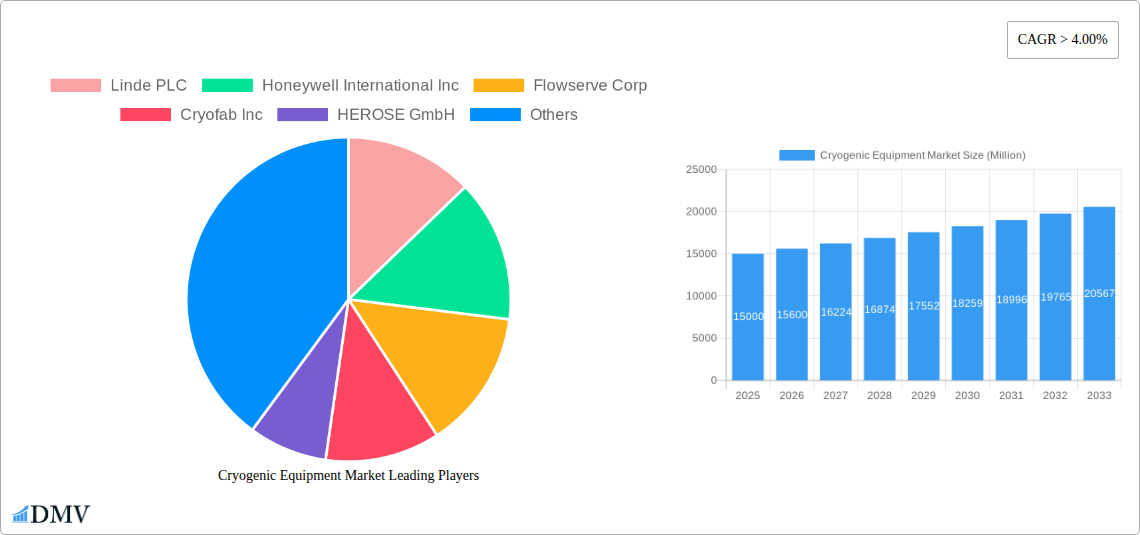
Cryogenic Equipment Market Company Market Share
Cryogenic Equipment Market: A Comprehensive Report (2019-2033)
This insightful report provides a detailed analysis of the Cryogenic Equipment Market, encompassing historical data (2019-2024), current estimates (2025), and future projections (2025-2033). It offers a comprehensive overview of market dynamics, including key players, technological advancements, and regional variations, providing valuable insights for stakeholders seeking to navigate this rapidly evolving landscape. The market is segmented by end-user industry (Oil and Gas, Energy and Power, Food and Beverages, Marine and Aerospace, Chemical and Healthcare, Other End-user Industries), equipment type (Tanks, Pumps, Heat Exchangers, Valves, Other Equipment), application (Storage, Transportation and Distribution, Processing, Other Applications), and gas used (Liquified Nitrogen, Liquified Helium, Other Gases Used). The report's meticulous research and data-driven analysis will empower businesses to make informed decisions and capitalize on lucrative opportunities within the Cryogenic Equipment Market. The market is projected to reach xx Million by 2033.
Cryogenic Equipment Market Market Composition & Trends
The Cryogenic Equipment market exhibits a moderately concentrated landscape, with key players such as Linde PLC, Honeywell International Inc, and Chart Industries Inc holding significant market share. The exact market share distribution for 2025 is estimated to be: Linde PLC (xx%), Honeywell International Inc (xx%), Chart Industries Inc (xx%), with remaining share distributed amongst other players. Innovation in materials science, particularly the development of advanced alloys and insulation technologies, is a major catalyst for growth. Stringent safety regulations and environmental concerns drive the need for improved equipment efficiency and reduced emissions. The market witnesses continuous M&A activity, with deal values ranging from xx Million to xx Million in recent years, fostering consolidation and technological integration. Substitute products, such as traditional refrigeration systems, pose a challenge, though cryogenic solutions are often preferred for their superior performance in specific applications. End-user profiles reveal a strong focus on industries like oil and gas, which account for a significant portion of market demand.
- Market Concentration: Moderately Concentrated
- Innovation Catalysts: Advanced materials, improved insulation
- Regulatory Landscape: Stringent safety and environmental standards
- Substitute Products: Traditional refrigeration systems
- M&A Activity: Deals ranging from xx Million to xx Million in recent years.
Cryogenic Equipment Market Industry Evolution
The Cryogenic Equipment market has witnessed consistent growth over the historical period (2019-2024), expanding at a Compound Annual Growth Rate (CAGR) of xx%. This growth is fueled by increasing demand from various end-user industries, particularly in the energy, healthcare, and food and beverage sectors. Technological advancements, such as the development of more efficient and cost-effective equipment, are further driving market expansion. The shift towards cryogenic solutions for efficient energy storage and transportation is another key trend. Adoption of advanced cryogenic technologies, especially in liquefied natural gas (LNG) processing and transportation, continues to rise, with adoption rates increasing by xx% annually in the last five years. Furthermore, rising consumer demand for food preservation and medical cryopreservation further bolsters market growth. The forecast period (2025-2033) anticipates sustained growth, propelled by ongoing technological improvements and the expansion of applications across diverse industries.
Leading Regions, Countries, or Segments in Cryogenic Equipment Market
The Oil and Gas sector emerges as the leading end-user industry, driven by the significant demand for cryogenic equipment in LNG processing and transportation. North America and Asia-Pacific are the dominant regions, with North America leading in terms of revenue generation due to significant investments in oil and gas infrastructure. Europe displays strong growth potential, driven by increased adoption in the chemical and healthcare sectors.
Key Drivers:
- Oil & Gas: High demand for LNG processing and transportation.
- Energy & Power: Growing investments in cryogenic energy storage.
- North America: Strong investments in oil and gas infrastructure.
- Asia-Pacific: Rapid industrialization and rising energy demand.
- Regulatory Support: Government incentives for energy efficiency and environmental protection.
Dominance Factors:
High demand from the oil and gas sector and significant investments in cryogenic infrastructure in North America and Asia-Pacific are the key factors driving the dominance of these regions. Moreover, supportive government policies and regulations further boost market growth in these regions.
Cryogenic Equipment Market Product Innovations
Recent innovations focus on enhancing efficiency, reducing energy consumption, and improving safety features. New materials, advanced designs, and improved insulation techniques are leading to smaller, lighter, and more robust cryogenic equipment. Unique selling propositions include superior energy efficiency, reduced operating costs, and enhanced safety features. The integration of advanced monitoring and control systems also plays a vital role in improving operational efficiency and minimizing risks.
Propelling Factors for Cryogenic Equipment Market Growth
The Cryogenic Equipment market is propelled by several factors. Firstly, the increasing demand for LNG in the energy sector drives significant growth. Secondly, technological advancements leading to more efficient and cost-effective equipment contribute to market expansion. Thirdly, stringent environmental regulations promote the adoption of energy-efficient cryogenic systems. Finally, growth in the healthcare and food and beverage industries further fuels market demand.
Obstacles in the Cryogenic Equipment Market Market
The market faces challenges, including stringent safety regulations requiring substantial investments in compliance. Supply chain disruptions impacting the availability of raw materials and components, and intense competition among established players and new entrants, negatively affect profitability and market share.
Future Opportunities in Cryogenic Equipment Market
Emerging opportunities include expanding into new markets like renewable energy and space exploration. Furthermore, innovations in cryogenic materials and technologies create potential for more efficient and cost-effective solutions. Finally, the rising demand for cryogenic applications in emerging economies presents significant growth prospects.
Major Players in the Cryogenic Equipment Market Ecosystem
- Linde PLC
- Honeywell International Inc
- Flowserve Corp
- Cryofab Inc
- HEROSE GmbH
- Emerson Electric Co
- Chart Industries Inc
- McDermott International Inc
- Sumitomo Heavy Industries Ltd
- Beijing Tianhai Industry Co Ltd
Key Developments in Cryogenic Equipment Market Industry
- January 2022: Saulsbury awarded an EPC contract for two cryogenic processing facilities in the Midland Basin, significantly expanding its capacity.
- October 2021: Chemie-Tech awarded a contract for cryogenic double-wall storage tanks and associated facilities at HPCL Rajasthan Refinery Ltd in India, showcasing growth in the Asian market.
Strategic Cryogenic Equipment Market Market Forecast
The Cryogenic Equipment market is poised for continued growth, driven by ongoing technological advancements, increasing demand from various sectors, and favorable government policies. Emerging applications in renewable energy and other innovative sectors will further fuel market expansion, presenting significant opportunities for businesses in the coming years. The market is expected to maintain a healthy growth trajectory throughout the forecast period.
Cryogenic Equipment Market Segmentation
-
1. Equipment
- 1.1. Tanks
- 1.2. Pumps
- 1.3. Heat Exchanger
- 1.4. Valves
- 1.5. Other Equipment
-
2. Application
- 2.1. Storage
- 2.2. Transportation and Distribution
- 2.3. Processing
- 2.4. Other Applications
-
3. Gas Used
- 3.1. Liquified Nitrogen
- 3.2. Liquified Helium
- 3.3. Other Gases Used
-
4. End-user Industry
- 4.1. Oil and Gas
- 4.2. Energy and Power
- 4.3. Food and Beverages
- 4.4. Marine and Areospace
- 4.5. Chemical and Healthcare
- 4.6. Other End-user Industries
Cryogenic Equipment Market Segmentation By Geography
- 1. North America
- 2. Europe
- 3. Asia Pacific
- 4. South America
- 5. Middle East and Africa
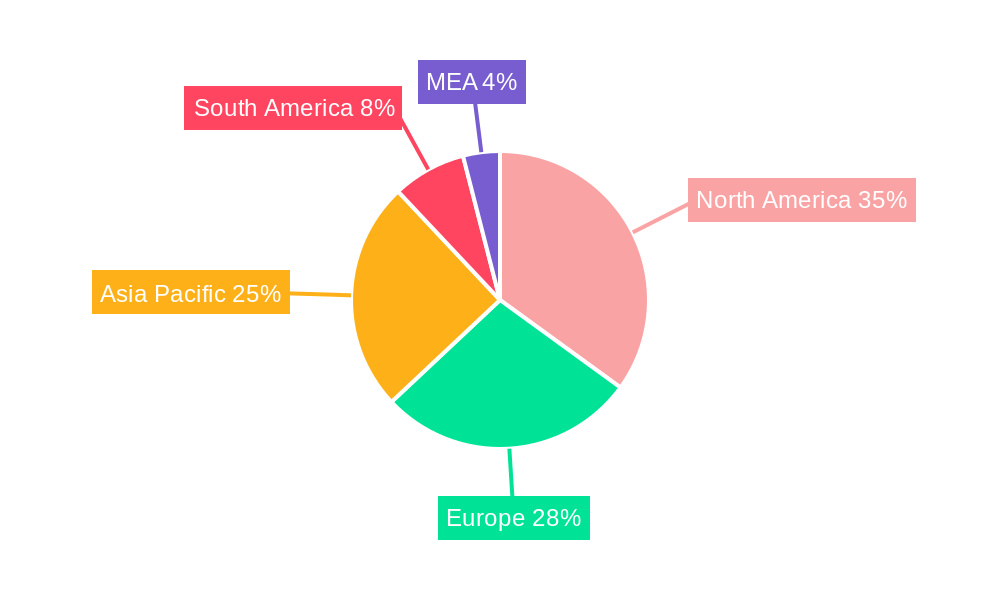
Cryogenic Equipment Market Regional Market Share
Geographic Coverage of Cryogenic Equipment Market
Cryogenic Equipment Market REPORT HIGHLIGHTS
| Aspects | Details |
|---|---|
| Study Period | 2020-2034 |
| Base Year | 2025 |
| Estimated Year | 2026 |
| Forecast Period | 2026-2034 |
| Historical Period | 2020-2025 |
| Growth Rate | CAGR of 6.8% from 2020-2034 |
| Segmentation |
|
Table of Contents
- 1. Introduction
- 1.1. Research Scope
- 1.2. Market Segmentation
- 1.3. Research Objective
- 1.4. Definitions and Assumptions
- 2. Executive Summary
- 2.1. Market Snapshot
- 3. Market Dynamics
- 3.1. Market Drivers
- 3.2. Market Restrains
- 3.3. Market Trends
- 3.4. Market Opportunities
- 4. Market Factor Analysis
- 4.1. Porters Five Forces
- 4.1.1. Bargaining Power of Suppliers
- 4.1.2. Bargaining Power of Buyers
- 4.1.3. Threat of New Entrants
- 4.1.4. Threat of Substitutes
- 4.1.5. Competitive Rivalry
- 4.2. PESTEL analysis
- 4.3. BCG Analysis
- 4.3.1. Stars (High Growth, High Market Share)
- 4.3.2. Cash Cows (Low Growth, High Market Share)
- 4.3.3. Question Mark (High Growth, Low Market Share)
- 4.3.4. Dogs (Low Growth, Low Market Share)
- 4.4. Ansoff Matrix Analysis
- 4.5. Supply Chain Analysis
- 4.6. Regulatory Landscape
- 4.7. Current Market Potential and Opportunity Assessment (TAM–SAM–SOM Framework)
- 4.8. DMV Analyst Note
- 4.1. Porters Five Forces
- 5. Market Analysis, Insights and Forecast 2021-2033
- 5.1. Market Analysis, Insights and Forecast - by Equipment
- 5.1.1. Tanks
- 5.1.2. Pumps
- 5.1.3. Heat Exchanger
- 5.1.4. Valves
- 5.1.5. Other Equipment
- 5.2. Market Analysis, Insights and Forecast - by Application
- 5.2.1. Storage
- 5.2.2. Transportation and Distribution
- 5.2.3. Processing
- 5.2.4. Other Applications
- 5.3. Market Analysis, Insights and Forecast - by Gas Used
- 5.3.1. Liquified Nitrogen
- 5.3.2. Liquified Helium
- 5.3.3. Other Gases Used
- 5.4. Market Analysis, Insights and Forecast - by End-user Industry
- 5.4.1. Oil and Gas
- 5.4.2. Energy and Power
- 5.4.3. Food and Beverages
- 5.4.4. Marine and Areospace
- 5.4.5. Chemical and Healthcare
- 5.4.6. Other End-user Industries
- 5.5. Market Analysis, Insights and Forecast - by Region
- 5.5.1. North America
- 5.5.2. Europe
- 5.5.3. Asia Pacific
- 5.5.4. South America
- 5.5.5. Middle East and Africa
- 5.1. Market Analysis, Insights and Forecast - by Equipment
- 6. Global Cryogenic Equipment Market Analysis, Insights and Forecast, 2021-2033
- 6.1. Market Analysis, Insights and Forecast - by Equipment
- 6.1.1. Tanks
- 6.1.2. Pumps
- 6.1.3. Heat Exchanger
- 6.1.4. Valves
- 6.1.5. Other Equipment
- 6.2. Market Analysis, Insights and Forecast - by Application
- 6.2.1. Storage
- 6.2.2. Transportation and Distribution
- 6.2.3. Processing
- 6.2.4. Other Applications
- 6.3. Market Analysis, Insights and Forecast - by Gas Used
- 6.3.1. Liquified Nitrogen
- 6.3.2. Liquified Helium
- 6.3.3. Other Gases Used
- 6.4. Market Analysis, Insights and Forecast - by End-user Industry
- 6.4.1. Oil and Gas
- 6.4.2. Energy and Power
- 6.4.3. Food and Beverages
- 6.4.4. Marine and Areospace
- 6.4.5. Chemical and Healthcare
- 6.4.6. Other End-user Industries
- 6.1. Market Analysis, Insights and Forecast - by Equipment
- 7. North America Cryogenic Equipment Market Analysis, Insights and Forecast, 2020-2032
- 7.1. Market Analysis, Insights and Forecast - by Equipment
- 7.1.1. Tanks
- 7.1.2. Pumps
- 7.1.3. Heat Exchanger
- 7.1.4. Valves
- 7.1.5. Other Equipment
- 7.2. Market Analysis, Insights and Forecast - by Application
- 7.2.1. Storage
- 7.2.2. Transportation and Distribution
- 7.2.3. Processing
- 7.2.4. Other Applications
- 7.3. Market Analysis, Insights and Forecast - by Gas Used
- 7.3.1. Liquified Nitrogen
- 7.3.2. Liquified Helium
- 7.3.3. Other Gases Used
- 7.4. Market Analysis, Insights and Forecast - by End-user Industry
- 7.4.1. Oil and Gas
- 7.4.2. Energy and Power
- 7.4.3. Food and Beverages
- 7.4.4. Marine and Areospace
- 7.4.5. Chemical and Healthcare
- 7.4.6. Other End-user Industries
- 7.1. Market Analysis, Insights and Forecast - by Equipment
- 8. Europe Cryogenic Equipment Market Analysis, Insights and Forecast, 2020-2032
- 8.1. Market Analysis, Insights and Forecast - by Equipment
- 8.1.1. Tanks
- 8.1.2. Pumps
- 8.1.3. Heat Exchanger
- 8.1.4. Valves
- 8.1.5. Other Equipment
- 8.2. Market Analysis, Insights and Forecast - by Application
- 8.2.1. Storage
- 8.2.2. Transportation and Distribution
- 8.2.3. Processing
- 8.2.4. Other Applications
- 8.3. Market Analysis, Insights and Forecast - by Gas Used
- 8.3.1. Liquified Nitrogen
- 8.3.2. Liquified Helium
- 8.3.3. Other Gases Used
- 8.4. Market Analysis, Insights and Forecast - by End-user Industry
- 8.4.1. Oil and Gas
- 8.4.2. Energy and Power
- 8.4.3. Food and Beverages
- 8.4.4. Marine and Areospace
- 8.4.5. Chemical and Healthcare
- 8.4.6. Other End-user Industries
- 8.1. Market Analysis, Insights and Forecast - by Equipment
- 9. Asia Pacific Cryogenic Equipment Market Analysis, Insights and Forecast, 2020-2032
- 9.1. Market Analysis, Insights and Forecast - by Equipment
- 9.1.1. Tanks
- 9.1.2. Pumps
- 9.1.3. Heat Exchanger
- 9.1.4. Valves
- 9.1.5. Other Equipment
- 9.2. Market Analysis, Insights and Forecast - by Application
- 9.2.1. Storage
- 9.2.2. Transportation and Distribution
- 9.2.3. Processing
- 9.2.4. Other Applications
- 9.3. Market Analysis, Insights and Forecast - by Gas Used
- 9.3.1. Liquified Nitrogen
- 9.3.2. Liquified Helium
- 9.3.3. Other Gases Used
- 9.4. Market Analysis, Insights and Forecast - by End-user Industry
- 9.4.1. Oil and Gas
- 9.4.2. Energy and Power
- 9.4.3. Food and Beverages
- 9.4.4. Marine and Areospace
- 9.4.5. Chemical and Healthcare
- 9.4.6. Other End-user Industries
- 9.1. Market Analysis, Insights and Forecast - by Equipment
- 10. South America Cryogenic Equipment Market Analysis, Insights and Forecast, 2020-2032
- 10.1. Market Analysis, Insights and Forecast - by Equipment
- 10.1.1. Tanks
- 10.1.2. Pumps
- 10.1.3. Heat Exchanger
- 10.1.4. Valves
- 10.1.5. Other Equipment
- 10.2. Market Analysis, Insights and Forecast - by Application
- 10.2.1. Storage
- 10.2.2. Transportation and Distribution
- 10.2.3. Processing
- 10.2.4. Other Applications
- 10.3. Market Analysis, Insights and Forecast - by Gas Used
- 10.3.1. Liquified Nitrogen
- 10.3.2. Liquified Helium
- 10.3.3. Other Gases Used
- 10.4. Market Analysis, Insights and Forecast - by End-user Industry
- 10.4.1. Oil and Gas
- 10.4.2. Energy and Power
- 10.4.3. Food and Beverages
- 10.4.4. Marine and Areospace
- 10.4.5. Chemical and Healthcare
- 10.4.6. Other End-user Industries
- 10.1. Market Analysis, Insights and Forecast - by Equipment
- 11. Middle East and Africa Cryogenic Equipment Market Analysis, Insights and Forecast, 2020-2032
- 11.1. Market Analysis, Insights and Forecast - by Equipment
- 11.1.1. Tanks
- 11.1.2. Pumps
- 11.1.3. Heat Exchanger
- 11.1.4. Valves
- 11.1.5. Other Equipment
- 11.2. Market Analysis, Insights and Forecast - by Application
- 11.2.1. Storage
- 11.2.2. Transportation and Distribution
- 11.2.3. Processing
- 11.2.4. Other Applications
- 11.3. Market Analysis, Insights and Forecast - by Gas Used
- 11.3.1. Liquified Nitrogen
- 11.3.2. Liquified Helium
- 11.3.3. Other Gases Used
- 11.4. Market Analysis, Insights and Forecast - by End-user Industry
- 11.4.1. Oil and Gas
- 11.4.2. Energy and Power
- 11.4.3. Food and Beverages
- 11.4.4. Marine and Areospace
- 11.4.5. Chemical and Healthcare
- 11.4.6. Other End-user Industries
- 11.1. Market Analysis, Insights and Forecast - by Equipment
- 12. Competitive Analysis
- 12.1. Company Profiles
- 12.1.1 Linde PLC
- 12.1.1.1. Company Overview
- 12.1.1.2. Products
- 12.1.1.3. Company Financials
- 12.1.1.4. SWOT Analysis
- 12.1.2 Honeywell International Inc
- 12.1.2.1. Company Overview
- 12.1.2.2. Products
- 12.1.2.3. Company Financials
- 12.1.2.4. SWOT Analysis
- 12.1.3 Flowserve Corp
- 12.1.3.1. Company Overview
- 12.1.3.2. Products
- 12.1.3.3. Company Financials
- 12.1.3.4. SWOT Analysis
- 12.1.4 Cryofab Inc
- 12.1.4.1. Company Overview
- 12.1.4.2. Products
- 12.1.4.3. Company Financials
- 12.1.4.4. SWOT Analysis
- 12.1.5 HEROSE GmbH
- 12.1.5.1. Company Overview
- 12.1.5.2. Products
- 12.1.5.3. Company Financials
- 12.1.5.4. SWOT Analysis
- 12.1.6 Emerson Electric Co
- 12.1.6.1. Company Overview
- 12.1.6.2. Products
- 12.1.6.3. Company Financials
- 12.1.6.4. SWOT Analysis
- 12.1.7 Chart Industries Inc
- 12.1.7.1. Company Overview
- 12.1.7.2. Products
- 12.1.7.3. Company Financials
- 12.1.7.4. SWOT Analysis
- 12.1.8 McDermott International Inc
- 12.1.8.1. Company Overview
- 12.1.8.2. Products
- 12.1.8.3. Company Financials
- 12.1.8.4. SWOT Analysis
- 12.1.9 Sumitomo Heavy Industries Ltd
- 12.1.9.1. Company Overview
- 12.1.9.2. Products
- 12.1.9.3. Company Financials
- 12.1.9.4. SWOT Analysis
- 12.1.10 Beijing Tianhai Industry Co Ltd
- 12.1.10.1. Company Overview
- 12.1.10.2. Products
- 12.1.10.3. Company Financials
- 12.1.10.4. SWOT Analysis
- 12.1.1 Linde PLC
- 12.2. Market Entropy
- 12.2.1 Company's Key Areas Served
- 12.2.2 Recent Developments
- 12.3. Company Market Share Analysis 2025
- 12.3.1 Top 5 Companies Market Share Analysis
- 12.3.2 Top 3 Companies Market Share Analysis
- 12.4. List of Potential Customers
- 13. Research Methodology
List of Figures
- Figure 1: Global Cryogenic Equipment Market Revenue Breakdown (billion, %) by Region 2025 & 2033
- Figure 2: Global Cryogenic Equipment Market Volume Breakdown (K Unit, %) by Region 2025 & 2033
- Figure 3: North America Cryogenic Equipment Market Revenue (billion), by Equipment 2025 & 2033
- Figure 4: North America Cryogenic Equipment Market Volume (K Unit), by Equipment 2025 & 2033
- Figure 5: North America Cryogenic Equipment Market Revenue Share (%), by Equipment 2025 & 2033
- Figure 6: North America Cryogenic Equipment Market Volume Share (%), by Equipment 2025 & 2033
- Figure 7: North America Cryogenic Equipment Market Revenue (billion), by Application 2025 & 2033
- Figure 8: North America Cryogenic Equipment Market Volume (K Unit), by Application 2025 & 2033
- Figure 9: North America Cryogenic Equipment Market Revenue Share (%), by Application 2025 & 2033
- Figure 10: North America Cryogenic Equipment Market Volume Share (%), by Application 2025 & 2033
- Figure 11: North America Cryogenic Equipment Market Revenue (billion), by Gas Used 2025 & 2033
- Figure 12: North America Cryogenic Equipment Market Volume (K Unit), by Gas Used 2025 & 2033
- Figure 13: North America Cryogenic Equipment Market Revenue Share (%), by Gas Used 2025 & 2033
- Figure 14: North America Cryogenic Equipment Market Volume Share (%), by Gas Used 2025 & 2033
- Figure 15: North America Cryogenic Equipment Market Revenue (billion), by End-user Industry 2025 & 2033
- Figure 16: North America Cryogenic Equipment Market Volume (K Unit), by End-user Industry 2025 & 2033
- Figure 17: North America Cryogenic Equipment Market Revenue Share (%), by End-user Industry 2025 & 2033
- Figure 18: North America Cryogenic Equipment Market Volume Share (%), by End-user Industry 2025 & 2033
- Figure 19: North America Cryogenic Equipment Market Revenue (billion), by Country 2025 & 2033
- Figure 20: North America Cryogenic Equipment Market Volume (K Unit), by Country 2025 & 2033
- Figure 21: North America Cryogenic Equipment Market Revenue Share (%), by Country 2025 & 2033
- Figure 22: North America Cryogenic Equipment Market Volume Share (%), by Country 2025 & 2033
- Figure 23: Europe Cryogenic Equipment Market Revenue (billion), by Equipment 2025 & 2033
- Figure 24: Europe Cryogenic Equipment Market Volume (K Unit), by Equipment 2025 & 2033
- Figure 25: Europe Cryogenic Equipment Market Revenue Share (%), by Equipment 2025 & 2033
- Figure 26: Europe Cryogenic Equipment Market Volume Share (%), by Equipment 2025 & 2033
- Figure 27: Europe Cryogenic Equipment Market Revenue (billion), by Application 2025 & 2033
- Figure 28: Europe Cryogenic Equipment Market Volume (K Unit), by Application 2025 & 2033
- Figure 29: Europe Cryogenic Equipment Market Revenue Share (%), by Application 2025 & 2033
- Figure 30: Europe Cryogenic Equipment Market Volume Share (%), by Application 2025 & 2033
- Figure 31: Europe Cryogenic Equipment Market Revenue (billion), by Gas Used 2025 & 2033
- Figure 32: Europe Cryogenic Equipment Market Volume (K Unit), by Gas Used 2025 & 2033
- Figure 33: Europe Cryogenic Equipment Market Revenue Share (%), by Gas Used 2025 & 2033
- Figure 34: Europe Cryogenic Equipment Market Volume Share (%), by Gas Used 2025 & 2033
- Figure 35: Europe Cryogenic Equipment Market Revenue (billion), by End-user Industry 2025 & 2033
- Figure 36: Europe Cryogenic Equipment Market Volume (K Unit), by End-user Industry 2025 & 2033
- Figure 37: Europe Cryogenic Equipment Market Revenue Share (%), by End-user Industry 2025 & 2033
- Figure 38: Europe Cryogenic Equipment Market Volume Share (%), by End-user Industry 2025 & 2033
- Figure 39: Europe Cryogenic Equipment Market Revenue (billion), by Country 2025 & 2033
- Figure 40: Europe Cryogenic Equipment Market Volume (K Unit), by Country 2025 & 2033
- Figure 41: Europe Cryogenic Equipment Market Revenue Share (%), by Country 2025 & 2033
- Figure 42: Europe Cryogenic Equipment Market Volume Share (%), by Country 2025 & 2033
- Figure 43: Asia Pacific Cryogenic Equipment Market Revenue (billion), by Equipment 2025 & 2033
- Figure 44: Asia Pacific Cryogenic Equipment Market Volume (K Unit), by Equipment 2025 & 2033
- Figure 45: Asia Pacific Cryogenic Equipment Market Revenue Share (%), by Equipment 2025 & 2033
- Figure 46: Asia Pacific Cryogenic Equipment Market Volume Share (%), by Equipment 2025 & 2033
- Figure 47: Asia Pacific Cryogenic Equipment Market Revenue (billion), by Application 2025 & 2033
- Figure 48: Asia Pacific Cryogenic Equipment Market Volume (K Unit), by Application 2025 & 2033
- Figure 49: Asia Pacific Cryogenic Equipment Market Revenue Share (%), by Application 2025 & 2033
- Figure 50: Asia Pacific Cryogenic Equipment Market Volume Share (%), by Application 2025 & 2033
- Figure 51: Asia Pacific Cryogenic Equipment Market Revenue (billion), by Gas Used 2025 & 2033
- Figure 52: Asia Pacific Cryogenic Equipment Market Volume (K Unit), by Gas Used 2025 & 2033
- Figure 53: Asia Pacific Cryogenic Equipment Market Revenue Share (%), by Gas Used 2025 & 2033
- Figure 54: Asia Pacific Cryogenic Equipment Market Volume Share (%), by Gas Used 2025 & 2033
- Figure 55: Asia Pacific Cryogenic Equipment Market Revenue (billion), by End-user Industry 2025 & 2033
- Figure 56: Asia Pacific Cryogenic Equipment Market Volume (K Unit), by End-user Industry 2025 & 2033
- Figure 57: Asia Pacific Cryogenic Equipment Market Revenue Share (%), by End-user Industry 2025 & 2033
- Figure 58: Asia Pacific Cryogenic Equipment Market Volume Share (%), by End-user Industry 2025 & 2033
- Figure 59: Asia Pacific Cryogenic Equipment Market Revenue (billion), by Country 2025 & 2033
- Figure 60: Asia Pacific Cryogenic Equipment Market Volume (K Unit), by Country 2025 & 2033
- Figure 61: Asia Pacific Cryogenic Equipment Market Revenue Share (%), by Country 2025 & 2033
- Figure 62: Asia Pacific Cryogenic Equipment Market Volume Share (%), by Country 2025 & 2033
- Figure 63: South America Cryogenic Equipment Market Revenue (billion), by Equipment 2025 & 2033
- Figure 64: South America Cryogenic Equipment Market Volume (K Unit), by Equipment 2025 & 2033
- Figure 65: South America Cryogenic Equipment Market Revenue Share (%), by Equipment 2025 & 2033
- Figure 66: South America Cryogenic Equipment Market Volume Share (%), by Equipment 2025 & 2033
- Figure 67: South America Cryogenic Equipment Market Revenue (billion), by Application 2025 & 2033
- Figure 68: South America Cryogenic Equipment Market Volume (K Unit), by Application 2025 & 2033
- Figure 69: South America Cryogenic Equipment Market Revenue Share (%), by Application 2025 & 2033
- Figure 70: South America Cryogenic Equipment Market Volume Share (%), by Application 2025 & 2033
- Figure 71: South America Cryogenic Equipment Market Revenue (billion), by Gas Used 2025 & 2033
- Figure 72: South America Cryogenic Equipment Market Volume (K Unit), by Gas Used 2025 & 2033
- Figure 73: South America Cryogenic Equipment Market Revenue Share (%), by Gas Used 2025 & 2033
- Figure 74: South America Cryogenic Equipment Market Volume Share (%), by Gas Used 2025 & 2033
- Figure 75: South America Cryogenic Equipment Market Revenue (billion), by End-user Industry 2025 & 2033
- Figure 76: South America Cryogenic Equipment Market Volume (K Unit), by End-user Industry 2025 & 2033
- Figure 77: South America Cryogenic Equipment Market Revenue Share (%), by End-user Industry 2025 & 2033
- Figure 78: South America Cryogenic Equipment Market Volume Share (%), by End-user Industry 2025 & 2033
- Figure 79: South America Cryogenic Equipment Market Revenue (billion), by Country 2025 & 2033
- Figure 80: South America Cryogenic Equipment Market Volume (K Unit), by Country 2025 & 2033
- Figure 81: South America Cryogenic Equipment Market Revenue Share (%), by Country 2025 & 2033
- Figure 82: South America Cryogenic Equipment Market Volume Share (%), by Country 2025 & 2033
- Figure 83: Middle East and Africa Cryogenic Equipment Market Revenue (billion), by Equipment 2025 & 2033
- Figure 84: Middle East and Africa Cryogenic Equipment Market Volume (K Unit), by Equipment 2025 & 2033
- Figure 85: Middle East and Africa Cryogenic Equipment Market Revenue Share (%), by Equipment 2025 & 2033
- Figure 86: Middle East and Africa Cryogenic Equipment Market Volume Share (%), by Equipment 2025 & 2033
- Figure 87: Middle East and Africa Cryogenic Equipment Market Revenue (billion), by Application 2025 & 2033
- Figure 88: Middle East and Africa Cryogenic Equipment Market Volume (K Unit), by Application 2025 & 2033
- Figure 89: Middle East and Africa Cryogenic Equipment Market Revenue Share (%), by Application 2025 & 2033
- Figure 90: Middle East and Africa Cryogenic Equipment Market Volume Share (%), by Application 2025 & 2033
- Figure 91: Middle East and Africa Cryogenic Equipment Market Revenue (billion), by Gas Used 2025 & 2033
- Figure 92: Middle East and Africa Cryogenic Equipment Market Volume (K Unit), by Gas Used 2025 & 2033
- Figure 93: Middle East and Africa Cryogenic Equipment Market Revenue Share (%), by Gas Used 2025 & 2033
- Figure 94: Middle East and Africa Cryogenic Equipment Market Volume Share (%), by Gas Used 2025 & 2033
- Figure 95: Middle East and Africa Cryogenic Equipment Market Revenue (billion), by End-user Industry 2025 & 2033
- Figure 96: Middle East and Africa Cryogenic Equipment Market Volume (K Unit), by End-user Industry 2025 & 2033
- Figure 97: Middle East and Africa Cryogenic Equipment Market Revenue Share (%), by End-user Industry 2025 & 2033
- Figure 98: Middle East and Africa Cryogenic Equipment Market Volume Share (%), by End-user Industry 2025 & 2033
- Figure 99: Middle East and Africa Cryogenic Equipment Market Revenue (billion), by Country 2025 & 2033
- Figure 100: Middle East and Africa Cryogenic Equipment Market Volume (K Unit), by Country 2025 & 2033
- Figure 101: Middle East and Africa Cryogenic Equipment Market Revenue Share (%), by Country 2025 & 2033
- Figure 102: Middle East and Africa Cryogenic Equipment Market Volume Share (%), by Country 2025 & 2033
List of Tables
- Table 1: Global Cryogenic Equipment Market Revenue billion Forecast, by Equipment 2020 & 2033
- Table 2: Global Cryogenic Equipment Market Volume K Unit Forecast, by Equipment 2020 & 2033
- Table 3: Global Cryogenic Equipment Market Revenue billion Forecast, by Application 2020 & 2033
- Table 4: Global Cryogenic Equipment Market Volume K Unit Forecast, by Application 2020 & 2033
- Table 5: Global Cryogenic Equipment Market Revenue billion Forecast, by Gas Used 2020 & 2033
- Table 6: Global Cryogenic Equipment Market Volume K Unit Forecast, by Gas Used 2020 & 2033
- Table 7: Global Cryogenic Equipment Market Revenue billion Forecast, by End-user Industry 2020 & 2033
- Table 8: Global Cryogenic Equipment Market Volume K Unit Forecast, by End-user Industry 2020 & 2033
- Table 9: Global Cryogenic Equipment Market Revenue billion Forecast, by Region 2020 & 2033
- Table 10: Global Cryogenic Equipment Market Volume K Unit Forecast, by Region 2020 & 2033
- Table 11: Global Cryogenic Equipment Market Revenue billion Forecast, by Equipment 2020 & 2033
- Table 12: Global Cryogenic Equipment Market Volume K Unit Forecast, by Equipment 2020 & 2033
- Table 13: Global Cryogenic Equipment Market Revenue billion Forecast, by Application 2020 & 2033
- Table 14: Global Cryogenic Equipment Market Volume K Unit Forecast, by Application 2020 & 2033
- Table 15: Global Cryogenic Equipment Market Revenue billion Forecast, by Gas Used 2020 & 2033
- Table 16: Global Cryogenic Equipment Market Volume K Unit Forecast, by Gas Used 2020 & 2033
- Table 17: Global Cryogenic Equipment Market Revenue billion Forecast, by End-user Industry 2020 & 2033
- Table 18: Global Cryogenic Equipment Market Volume K Unit Forecast, by End-user Industry 2020 & 2033
- Table 19: Global Cryogenic Equipment Market Revenue billion Forecast, by Country 2020 & 2033
- Table 20: Global Cryogenic Equipment Market Volume K Unit Forecast, by Country 2020 & 2033
- Table 21: Global Cryogenic Equipment Market Revenue billion Forecast, by Equipment 2020 & 2033
- Table 22: Global Cryogenic Equipment Market Volume K Unit Forecast, by Equipment 2020 & 2033
- Table 23: Global Cryogenic Equipment Market Revenue billion Forecast, by Application 2020 & 2033
- Table 24: Global Cryogenic Equipment Market Volume K Unit Forecast, by Application 2020 & 2033
- Table 25: Global Cryogenic Equipment Market Revenue billion Forecast, by Gas Used 2020 & 2033
- Table 26: Global Cryogenic Equipment Market Volume K Unit Forecast, by Gas Used 2020 & 2033
- Table 27: Global Cryogenic Equipment Market Revenue billion Forecast, by End-user Industry 2020 & 2033
- Table 28: Global Cryogenic Equipment Market Volume K Unit Forecast, by End-user Industry 2020 & 2033
- Table 29: Global Cryogenic Equipment Market Revenue billion Forecast, by Country 2020 & 2033
- Table 30: Global Cryogenic Equipment Market Volume K Unit Forecast, by Country 2020 & 2033
- Table 31: Global Cryogenic Equipment Market Revenue billion Forecast, by Equipment 2020 & 2033
- Table 32: Global Cryogenic Equipment Market Volume K Unit Forecast, by Equipment 2020 & 2033
- Table 33: Global Cryogenic Equipment Market Revenue billion Forecast, by Application 2020 & 2033
- Table 34: Global Cryogenic Equipment Market Volume K Unit Forecast, by Application 2020 & 2033
- Table 35: Global Cryogenic Equipment Market Revenue billion Forecast, by Gas Used 2020 & 2033
- Table 36: Global Cryogenic Equipment Market Volume K Unit Forecast, by Gas Used 2020 & 2033
- Table 37: Global Cryogenic Equipment Market Revenue billion Forecast, by End-user Industry 2020 & 2033
- Table 38: Global Cryogenic Equipment Market Volume K Unit Forecast, by End-user Industry 2020 & 2033
- Table 39: Global Cryogenic Equipment Market Revenue billion Forecast, by Country 2020 & 2033
- Table 40: Global Cryogenic Equipment Market Volume K Unit Forecast, by Country 2020 & 2033
- Table 41: Global Cryogenic Equipment Market Revenue billion Forecast, by Equipment 2020 & 2033
- Table 42: Global Cryogenic Equipment Market Volume K Unit Forecast, by Equipment 2020 & 2033
- Table 43: Global Cryogenic Equipment Market Revenue billion Forecast, by Application 2020 & 2033
- Table 44: Global Cryogenic Equipment Market Volume K Unit Forecast, by Application 2020 & 2033
- Table 45: Global Cryogenic Equipment Market Revenue billion Forecast, by Gas Used 2020 & 2033
- Table 46: Global Cryogenic Equipment Market Volume K Unit Forecast, by Gas Used 2020 & 2033
- Table 47: Global Cryogenic Equipment Market Revenue billion Forecast, by End-user Industry 2020 & 2033
- Table 48: Global Cryogenic Equipment Market Volume K Unit Forecast, by End-user Industry 2020 & 2033
- Table 49: Global Cryogenic Equipment Market Revenue billion Forecast, by Country 2020 & 2033
- Table 50: Global Cryogenic Equipment Market Volume K Unit Forecast, by Country 2020 & 2033
- Table 51: Global Cryogenic Equipment Market Revenue billion Forecast, by Equipment 2020 & 2033
- Table 52: Global Cryogenic Equipment Market Volume K Unit Forecast, by Equipment 2020 & 2033
- Table 53: Global Cryogenic Equipment Market Revenue billion Forecast, by Application 2020 & 2033
- Table 54: Global Cryogenic Equipment Market Volume K Unit Forecast, by Application 2020 & 2033
- Table 55: Global Cryogenic Equipment Market Revenue billion Forecast, by Gas Used 2020 & 2033
- Table 56: Global Cryogenic Equipment Market Volume K Unit Forecast, by Gas Used 2020 & 2033
- Table 57: Global Cryogenic Equipment Market Revenue billion Forecast, by End-user Industry 2020 & 2033
- Table 58: Global Cryogenic Equipment Market Volume K Unit Forecast, by End-user Industry 2020 & 2033
- Table 59: Global Cryogenic Equipment Market Revenue billion Forecast, by Country 2020 & 2033
- Table 60: Global Cryogenic Equipment Market Volume K Unit Forecast, by Country 2020 & 2033
Frequently Asked Questions
1. What is the projected Compound Annual Growth Rate (CAGR) of the Cryogenic Equipment Market?
The projected CAGR is approximately 6.8%.
2. Which companies are prominent players in the Cryogenic Equipment Market?
Key companies in the market include Linde PLC, Honeywell International Inc, Flowserve Corp, Cryofab Inc, HEROSE GmbH, Emerson Electric Co, Chart Industries Inc, McDermott International Inc, Sumitomo Heavy Industries Ltd, Beijing Tianhai Industry Co Ltd.
3. What are the main segments of the Cryogenic Equipment Market?
The market segments include Equipment, Application, Gas Used, End-user Industry.
4. Can you provide details about the market size?
The market size is estimated to be USD 26.6 billion as of 2022.
5. What are some drivers contributing to market growth?
4.; Increasing Demand for Liquefied Natural Gas (LNG).
6. What are the notable trends driving market growth?
Tanks Segment Expected to Experience Significant Market Growth.
7. Are there any restraints impacting market growth?
4.; High Operational and Maintenance Costs.
8. Can you provide examples of recent developments in the market?
In January 2022, Saulsbury was awarded the EPC contract for the design and installation of two cryogenic processing facilities in the Midland Basin. The facilities, designed with a base-rated capacity of 200 million standard cubic feet per day (MMSCFD) each, mark Saulsbury's 61st and 62nd cryogenic processing facility projects since 2006, representing nearly 11 billion cubic feet per day (BCFD) of processing capacity, and its 23rd and 24th cryogenic processing facility in the West Texas region.
9. What pricing options are available for accessing the report?
Pricing options include single-user, multi-user, and enterprise licenses priced at USD 4750, USD 5250, and USD 8750 respectively.
10. Is the market size provided in terms of value or volume?
The market size is provided in terms of value, measured in billion and volume, measured in K Unit.
11. Are there any specific market keywords associated with the report?
Yes, the market keyword associated with the report is "Cryogenic Equipment Market," which aids in identifying and referencing the specific market segment covered.
12. How do I determine which pricing option suits my needs best?
The pricing options vary based on user requirements and access needs. Individual users may opt for single-user licenses, while businesses requiring broader access may choose multi-user or enterprise licenses for cost-effective access to the report.
13. Are there any additional resources or data provided in the Cryogenic Equipment Market report?
While the report offers comprehensive insights, it's advisable to review the specific contents or supplementary materials provided to ascertain if additional resources or data are available.
14. How can I stay updated on further developments or reports in the Cryogenic Equipment Market?
To stay informed about further developments, trends, and reports in the Cryogenic Equipment Market, consider subscribing to industry newsletters, following relevant companies and organizations, or regularly checking reputable industry news sources and publications.
Methodology
Step 1 - Identification of Relevant Samples Size from Population Database


Step 2 - Approaches for Defining Global Market Size (Value, Volume* & Price*)

Note*: In applicable scenarios
Step 3 - Data Sources
Primary Research
- Web Analytics
- Survey Reports
- Research Institute
- Latest Research Reports
- Opinion Leaders
Secondary Research
- Annual Reports
- White Paper
- Latest Press Release
- Industry Association
- Paid Database
- Investor Presentations

Step 4 - Data Triangulation
Involves using different sources of information in order to increase the validity of a study
These sources are likely to be stakeholders in a program - participants, other researchers, program staff, other community members, and so on.
Then we put all data in single framework & apply various statistical tools to find out the dynamic on the market.
During the analysis stage, feedback from the stakeholder groups would be compared to determine areas of agreement as well as areas of divergence