

Key Insights
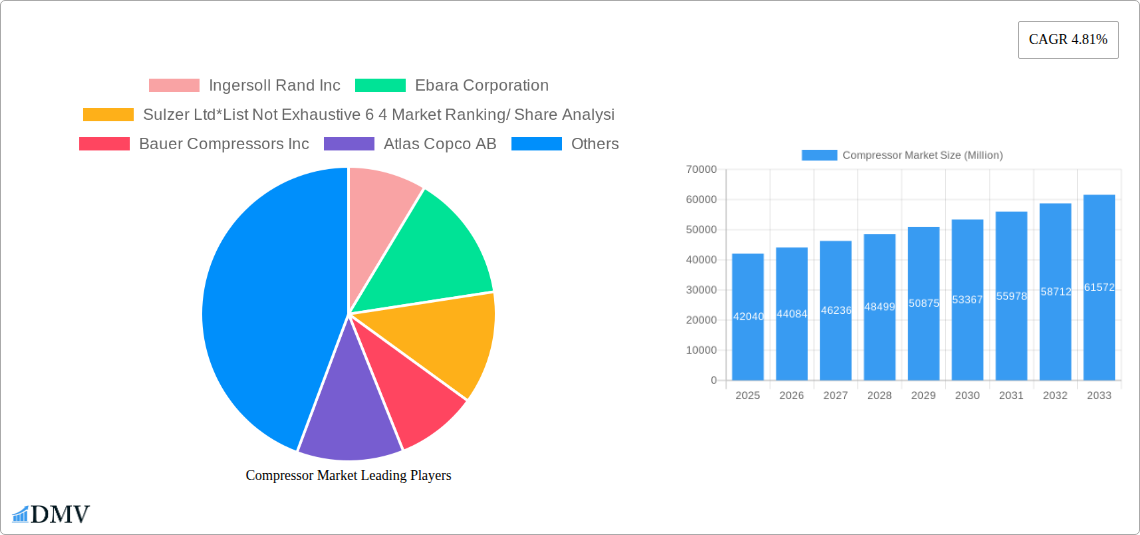
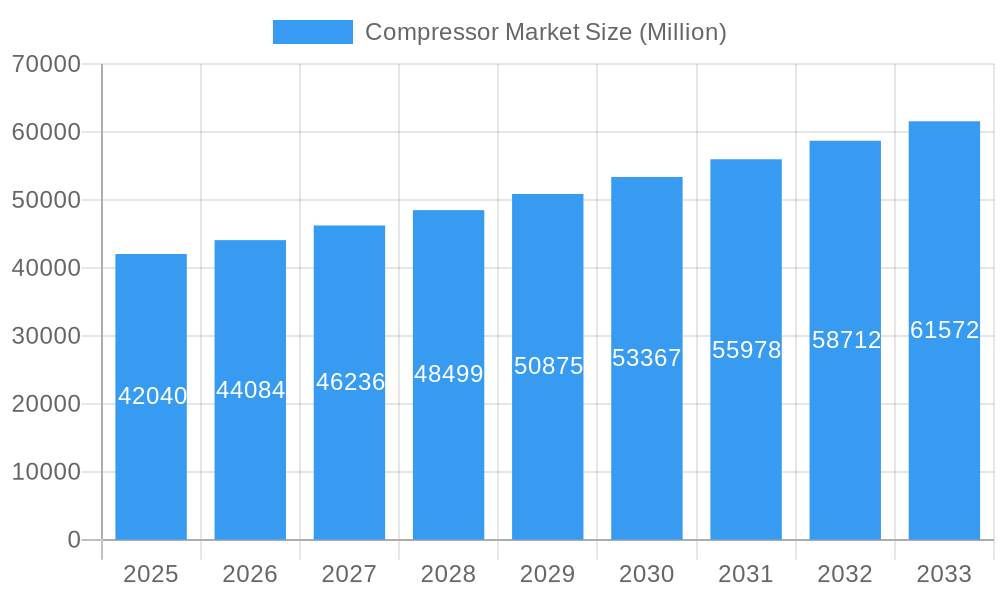
The global compressor market, valued at $42.04 billion in 2025, is projected to experience robust growth, driven by increasing demand across diverse end-use sectors. A compound annual growth rate (CAGR) of 4.81% from 2025 to 2033 indicates a significant expansion, primarily fueled by the burgeoning oil and gas industry, the expanding power generation sector's need for efficient energy transfer, and the growth of manufacturing and chemical processing. Technological advancements in positive displacement and dynamic compressors, leading to improved energy efficiency and reduced emissions, are further stimulating market growth. While the market faces certain restraints, such as fluctuating raw material prices and stringent environmental regulations, the overall outlook remains positive due to the ongoing investments in infrastructure development and industrial automation across key regions. The North American market, comprising the United States, Canada, and Mexico, is anticipated to maintain a dominant share due to its established industrial base and significant investments in energy infrastructure. However, the Asia-Pacific region, particularly China and India, is poised for rapid expansion due to the ongoing industrialization and infrastructure development. This region is likely to witness the fastest growth rate during the forecast period.
Compressor Market Market Size (In Billion)
The competitive landscape is characterized by a mix of established players and emerging companies. Major players such as Ingersoll Rand, Ebara Corporation, Sulzer Ltd, Atlas Copco AB, and Baker Hughes Co are leveraging their technological expertise and global presence to maintain their market share. However, the market also displays scope for new entrants offering innovative solutions and specialized compressor technologies. The segmentation by end-user and compressor type provides crucial insights for targeted marketing and investment strategies. Furthermore, future growth prospects are closely tied to the global economic climate, energy transition initiatives, and the evolution of industrial automation practices. Understanding the regional dynamics, technological advancements, and competitive strategies is essential for making informed business decisions within this rapidly evolving market.
Compressor Market Company Market Share
Compressor Market: A Comprehensive Report (2019-2033)
This insightful report provides a detailed analysis of the global compressor market, encompassing historical data (2019-2024), current estimates (2025), and future projections (2025-2033). The study meticulously examines market dynamics, competitive landscapes, technological advancements, and growth opportunities within this vital industrial sector, offering invaluable insights for stakeholders across the value chain. The report is based on rigorous research and analysis, using a combination of primary and secondary data sources to deliver precise and actionable intelligence. The total market value is projected to reach xx Million by 2033.
Compressor Market Composition & Trends
This section delves into the intricate composition of the compressor market, evaluating its concentration levels, innovation drivers, and regulatory influences. We analyze the competitive dynamics through a detailed examination of market share distribution among key players like Ingersoll Rand Inc, Ebara Corporation, Sulzer Ltd, Bauer Compressors Inc, Atlas Copco AB, Baker Hughes Co, Ariel Corporation, Aerzener Maschinenfabrik GmbH, Burckhardt Compression Holding AG, and Siemens Energy AG (list not exhaustive). The report further investigates the impact of mergers and acquisitions (M&A) activities, quantifying deal values where possible, and assessing their influence on market structure and competition. The analysis also considers the impact of substitute products and evolving end-user preferences across diverse sectors, including oil and gas, power generation, manufacturing, and chemicals. The market is segmented by end-user and compressor type (Positive Displacement and Dynamic), allowing for a granular understanding of market trends across various applications. Our analysis reveals a moderately concentrated market with ongoing consolidation.
- Market Concentration: The market is characterized by a mix of large multinational corporations and specialized niche players. The top 6 players hold approximately 64% of the market share (2025 estimate).
- Innovation Catalysts: Advances in energy efficiency, digitalization, and material science are driving innovation within the compressor market.
- Regulatory Landscape: Stringent environmental regulations related to emissions and energy consumption are shaping product development and market dynamics.
- M&A Activity: The past five years have witnessed several significant M&A transactions, with an estimated total value exceeding xx Million. This consolidation is expected to continue.
- Substitute Products: The emergence of alternative technologies such as centrifugal compressors presents a level of competitive pressure, albeit limited to specific applications.
- End-User Profiles: The report provides detailed profiles of end-users across various industries, highlighting their specific compressor needs and purchasing patterns.
Compressor Market Industry Evolution
This section examines the historical evolution and future trajectories of the compressor market. We trace the growth trends since 2019, analyzing factors influencing market expansion, including technological advancements and changing consumer demand. The report details the adoption rates of new technologies such as variable speed drives and digital controls and assesses their impact on market growth. Specific data points, such as compound annual growth rates (CAGRs) for different segments and regions are included. The analysis also factors in macroeconomic conditions and their influence on investment patterns within the compressor industry. The market experienced a CAGR of xx% during the historical period (2019-2024) and is projected to grow at a CAGR of xx% during the forecast period (2025-2033). This growth is driven by increasing demand from various end-user sectors.
Leading Regions, Countries, or Segments in Compressor Market
This section identifies the leading regions, countries, and market segments within the compressor market. Detailed analysis and projections are offered across each segmented area.
Dominant Regions/Countries: (Analysis will include regional market size, growth rates, and key drivers)
- By End-User:
- Oil and Gas Industry: This segment dominates due to the crucial role of compressors in oil and gas extraction, processing, and transportation. Strong investment in upstream and midstream activities supports this market segment's dominance.
- Power Sector: Growing investments in renewable energy and conventional power generation fuel demand for compressors in power plants.
- Manufacturing Sector: The manufacturing sector requires diverse compressor types for various processes, contributing to significant market share.
- Chemicals and Petrochemical Industry: This sector relies heavily on compressors for chemical processes and product transportation, driving substantial demand.
- Other End-Users: This segment encompasses diverse applications across different industries with varied growth potentials.
- By Type:
- Positive Displacement Compressors: This type maintains a significant market share due to their reliability and suitability for specific applications.
- Dynamic Compressors: This type exhibits increasing adoption rates, driven by advancements in efficiency and performance.
Key Drivers (Examples):
- Significant government investments in infrastructure development.
- Favorable regulatory environment supporting the adoption of energy-efficient technologies.
- Growing industrialization and urbanization in several emerging economies.
Compressor Market Product Innovations
Recent innovations in compressor technology center on increased energy efficiency, reduced emissions, and improved reliability. Manufacturers are incorporating advanced materials, innovative designs, and digital technologies to enhance compressor performance and longevity. These advancements address end-user needs for reduced operational costs and minimized environmental impact. Unique selling propositions include variable speed drives for optimized energy consumption and predictive maintenance capabilities based on digital sensor data.
Propelling Factors for Compressor Market Growth
The growth of the compressor market is primarily driven by several factors: the increasing demand from end-user industries like oil and gas, the expansion of the manufacturing sector, and government initiatives promoting energy efficiency. Technological advancements such as the development of more efficient and reliable compressors are also significant drivers. The rising adoption of renewable energy sources and ongoing infrastructural projects in developing economies contribute further.
Obstacles in the Compressor Market Market
Several factors hinder the growth of the compressor market. These include fluctuating raw material prices, supply chain disruptions, and intense competition among established and emerging players. Furthermore, stringent environmental regulations and evolving industry standards require significant investment in research and development to comply with emissions requirements. These factors can lead to price volatility and affect profitability.
Future Opportunities in Compressor Market
The compressor market is poised for growth, with opportunities in emerging economies, expansion into new applications like hydrogen compression, and the adoption of advanced technologies like artificial intelligence for predictive maintenance and improved efficiency. Furthermore, a focus on sustainable practices and reduced environmental impact through efficient compressor designs creates significant market potential.
Major Players in the Compressor Market Ecosystem
- Ingersoll Rand Inc
- Ebara Corporation
- Sulzer Ltd
- Bauer Compressors Inc
- Atlas Copco AB
- Baker Hughes Co
- Ariel Corporation
- Aerzener Maschinenfabrik GmbH
- Burckhardt Compression Holding AG
- Siemens Energy AG
Key Developments in Compressor Market Industry
- April 2024: The Srikail gas field in Cumilla, Bangladesh, signed a contract for three wellhead compressors (10 million cubic feet per day capacity), highlighting growing investment in the gas sector.
- March 2023: Sapphire Gas Solutions and Bauer Compressors Inc. formed a national partnership, expanding Bauer's service network and market reach across North America.
Strategic Compressor Market Market Forecast
The compressor market is expected to witness robust growth over the forecast period driven by continued industrial expansion, increasing energy demand, and the adoption of advanced technologies. Focus on sustainability and energy efficiency will shape future product development and market dynamics, presenting significant growth opportunities for innovative players. The market is poised for continued consolidation, with larger players likely acquiring smaller companies to expand their market share and product portfolio.
Compressor Market Segmentation
-
1. End-User
- 1.1. Oil and Gas Industry
- 1.2. Power Sector
- 1.3. Manufacturing Sector
- 1.4. Chemicals and Petrochemical Industry
- 1.5. Other End-Users
-
2. Type
- 2.1. Positive Displacement
- 2.2. Dynamic
Compressor Market Segmentation By Geography
-
1. North America
- 1.1. United States
- 1.2. Canada
- 1.3. Rest of North America
-
2. Europe
- 2.1. Germany
- 2.2. France
- 2.3. United Kingdom
- 2.4. Spain
- 2.5. Norway
- 2.6. Turkey
- 2.7. Russia
- 2.8. NORDIC
- 2.9. Rest of Europe
-
3. Asia Pacific
- 3.1. China
- 3.2. India
- 3.3. Malaysia
- 3.4. Thailand
- 3.5. Australia
- 3.6. Indonesia
- 3.7. Vietnam
- 4. Rest of Asia Pacific
-
5. South America
- 5.1. Brazil
- 5.2. Argentina
- 5.3. Colombia
- 5.4. Rest of South America
-
6. Middle East and Africa
- 6.1. Saudi Arabia
- 6.2. United Arab Emirates
- 6.3. South Africa
- 6.4. Nigeria
- 6.5. Qatar
- 7. Egypt
- 8. Rest of Middle East and Africa
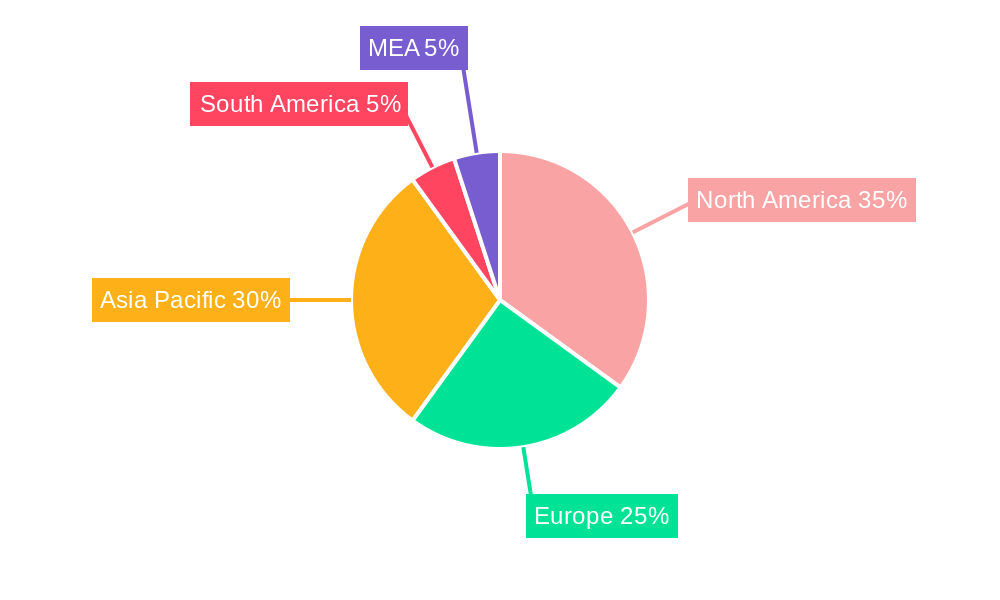
Compressor Market Regional Market Share
Geographic Coverage of Compressor Market
Compressor Market REPORT HIGHLIGHTS
| Aspects | Details |
|---|---|
| Study Period | 2020-2034 |
| Base Year | 2025 |
| Estimated Year | 2026 |
| Forecast Period | 2026-2034 |
| Historical Period | 2020-2025 |
| Growth Rate | CAGR of 4.81% from 2020-2034 |
| Segmentation |
|
Table of Contents
- 1. Introduction
- 1.1. Research Scope
- 1.2. Market Segmentation
- 1.3. Research Objective
- 1.4. Definitions and Assumptions
- 2. Executive Summary
- 2.1. Market Snapshot
- 3. Market Dynamics
- 3.1. Market Drivers
- 3.2. Market Restrains
- 3.3. Market Trends
- 3.4. Market Opportunities
- 4. Market Factor Analysis
- 4.1. Porters Five Forces
- 4.1.1. Bargaining Power of Suppliers
- 4.1.2. Bargaining Power of Buyers
- 4.1.3. Threat of New Entrants
- 4.1.4. Threat of Substitutes
- 4.1.5. Competitive Rivalry
- 4.2. PESTEL analysis
- 4.3. BCG Analysis
- 4.3.1. Stars (High Growth, High Market Share)
- 4.3.2. Cash Cows (Low Growth, High Market Share)
- 4.3.3. Question Mark (High Growth, Low Market Share)
- 4.3.4. Dogs (Low Growth, Low Market Share)
- 4.4. Ansoff Matrix Analysis
- 4.5. Supply Chain Analysis
- 4.6. Regulatory Landscape
- 4.7. Current Market Potential and Opportunity Assessment (TAM–SAM–SOM Framework)
- 4.8. DMV Analyst Note
- 4.1. Porters Five Forces
- 5. Market Analysis, Insights and Forecast 2021-2033
- 5.1. Market Analysis, Insights and Forecast - by End-User
- 5.1.1. Oil and Gas Industry
- 5.1.2. Power Sector
- 5.1.3. Manufacturing Sector
- 5.1.4. Chemicals and Petrochemical Industry
- 5.1.5. Other End-Users
- 5.2. Market Analysis, Insights and Forecast - by Type
- 5.2.1. Positive Displacement
- 5.2.2. Dynamic
- 5.3. Market Analysis, Insights and Forecast - by Region
- 5.3.1. North America
- 5.3.2. Europe
- 5.3.3. Asia Pacific
- 5.3.4. Rest of Asia Pacific
- 5.3.5. South America
- 5.3.6. Middle East and Africa
- 5.3.7. Egypt
- 5.3.8. Rest of Middle East and Africa
- 5.1. Market Analysis, Insights and Forecast - by End-User
- 6. Global Compressor Market Analysis, Insights and Forecast, 2021-2033
- 6.1. Market Analysis, Insights and Forecast - by End-User
- 6.1.1. Oil and Gas Industry
- 6.1.2. Power Sector
- 6.1.3. Manufacturing Sector
- 6.1.4. Chemicals and Petrochemical Industry
- 6.1.5. Other End-Users
- 6.2. Market Analysis, Insights and Forecast - by Type
- 6.2.1. Positive Displacement
- 6.2.2. Dynamic
- 6.1. Market Analysis, Insights and Forecast - by End-User
- 7. North America Compressor Market Analysis, Insights and Forecast, 2020-2032
- 7.1. Market Analysis, Insights and Forecast - by End-User
- 7.1.1. Oil and Gas Industry
- 7.1.2. Power Sector
- 7.1.3. Manufacturing Sector
- 7.1.4. Chemicals and Petrochemical Industry
- 7.1.5. Other End-Users
- 7.2. Market Analysis, Insights and Forecast - by Type
- 7.2.1. Positive Displacement
- 7.2.2. Dynamic
- 7.1. Market Analysis, Insights and Forecast - by End-User
- 8. Europe Compressor Market Analysis, Insights and Forecast, 2020-2032
- 8.1. Market Analysis, Insights and Forecast - by End-User
- 8.1.1. Oil and Gas Industry
- 8.1.2. Power Sector
- 8.1.3. Manufacturing Sector
- 8.1.4. Chemicals and Petrochemical Industry
- 8.1.5. Other End-Users
- 8.2. Market Analysis, Insights and Forecast - by Type
- 8.2.1. Positive Displacement
- 8.2.2. Dynamic
- 8.1. Market Analysis, Insights and Forecast - by End-User
- 9. Asia Pacific Compressor Market Analysis, Insights and Forecast, 2020-2032
- 9.1. Market Analysis, Insights and Forecast - by End-User
- 9.1.1. Oil and Gas Industry
- 9.1.2. Power Sector
- 9.1.3. Manufacturing Sector
- 9.1.4. Chemicals and Petrochemical Industry
- 9.1.5. Other End-Users
- 9.2. Market Analysis, Insights and Forecast - by Type
- 9.2.1. Positive Displacement
- 9.2.2. Dynamic
- 9.1. Market Analysis, Insights and Forecast - by End-User
- 10. Rest of Asia Pacific Compressor Market Analysis, Insights and Forecast, 2020-2032
- 10.1. Market Analysis, Insights and Forecast - by End-User
- 10.1.1. Oil and Gas Industry
- 10.1.2. Power Sector
- 10.1.3. Manufacturing Sector
- 10.1.4. Chemicals and Petrochemical Industry
- 10.1.5. Other End-Users
- 10.2. Market Analysis, Insights and Forecast - by Type
- 10.2.1. Positive Displacement
- 10.2.2. Dynamic
- 10.1. Market Analysis, Insights and Forecast - by End-User
- 11. South America Compressor Market Analysis, Insights and Forecast, 2020-2032
- 11.1. Market Analysis, Insights and Forecast - by End-User
- 11.1.1. Oil and Gas Industry
- 11.1.2. Power Sector
- 11.1.3. Manufacturing Sector
- 11.1.4. Chemicals and Petrochemical Industry
- 11.1.5. Other End-Users
- 11.2. Market Analysis, Insights and Forecast - by Type
- 11.2.1. Positive Displacement
- 11.2.2. Dynamic
- 11.1. Market Analysis, Insights and Forecast - by End-User
- 12. Middle East and Africa Compressor Market Analysis, Insights and Forecast, 2020-2032
- 12.1. Market Analysis, Insights and Forecast - by End-User
- 12.1.1. Oil and Gas Industry
- 12.1.2. Power Sector
- 12.1.3. Manufacturing Sector
- 12.1.4. Chemicals and Petrochemical Industry
- 12.1.5. Other End-Users
- 12.2. Market Analysis, Insights and Forecast - by Type
- 12.2.1. Positive Displacement
- 12.2.2. Dynamic
- 12.1. Market Analysis, Insights and Forecast - by End-User
- 13. Egypt Compressor Market Analysis, Insights and Forecast, 2020-2032
- 13.1. Market Analysis, Insights and Forecast - by End-User
- 13.1.1. Oil and Gas Industry
- 13.1.2. Power Sector
- 13.1.3. Manufacturing Sector
- 13.1.4. Chemicals and Petrochemical Industry
- 13.1.5. Other End-Users
- 13.2. Market Analysis, Insights and Forecast - by Type
- 13.2.1. Positive Displacement
- 13.2.2. Dynamic
- 13.1. Market Analysis, Insights and Forecast - by End-User
- 14. Rest of Middle East and Africa Compressor Market Analysis, Insights and Forecast, 2020-2032
- 14.1. Market Analysis, Insights and Forecast - by End-User
- 14.1.1. Oil and Gas Industry
- 14.1.2. Power Sector
- 14.1.3. Manufacturing Sector
- 14.1.4. Chemicals and Petrochemical Industry
- 14.1.5. Other End-Users
- 14.2. Market Analysis, Insights and Forecast - by Type
- 14.2.1. Positive Displacement
- 14.2.2. Dynamic
- 14.1. Market Analysis, Insights and Forecast - by End-User
- 15. Competitive Analysis
- 15.1. Company Profiles
- 15.1.1 Ingersoll Rand Inc
- 15.1.1.1. Company Overview
- 15.1.1.2. Products
- 15.1.1.3. Company Financials
- 15.1.1.4. SWOT Analysis
- 15.1.2 Ebara Corporation
- 15.1.2.1. Company Overview
- 15.1.2.2. Products
- 15.1.2.3. Company Financials
- 15.1.2.4. SWOT Analysis
- 15.1.3 Sulzer Ltd*List Not Exhaustive 6 4 Market Ranking/ Share Analysi
- 15.1.3.1. Company Overview
- 15.1.3.2. Products
- 15.1.3.3. Company Financials
- 15.1.3.4. SWOT Analysis
- 15.1.4 Bauer Compressors Inc
- 15.1.4.1. Company Overview
- 15.1.4.2. Products
- 15.1.4.3. Company Financials
- 15.1.4.4. SWOT Analysis
- 15.1.5 Atlas Copco AB
- 15.1.5.1. Company Overview
- 15.1.5.2. Products
- 15.1.5.3. Company Financials
- 15.1.5.4. SWOT Analysis
- 15.1.6 Baker Hughes Co
- 15.1.6.1. Company Overview
- 15.1.6.2. Products
- 15.1.6.3. Company Financials
- 15.1.6.4. SWOT Analysis
- 15.1.7 Ariel Corporation
- 15.1.7.1. Company Overview
- 15.1.7.2. Products
- 15.1.7.3. Company Financials
- 15.1.7.4. SWOT Analysis
- 15.1.8 Aerzener Maschinenfabrik GmbH
- 15.1.8.1. Company Overview
- 15.1.8.2. Products
- 15.1.8.3. Company Financials
- 15.1.8.4. SWOT Analysis
- 15.1.9 Burckhardt Compression Holding AG
- 15.1.9.1. Company Overview
- 15.1.9.2. Products
- 15.1.9.3. Company Financials
- 15.1.9.4. SWOT Analysis
- 15.1.10 Siemens Energy AG
- 15.1.10.1. Company Overview
- 15.1.10.2. Products
- 15.1.10.3. Company Financials
- 15.1.10.4. SWOT Analysis
- 15.1.1 Ingersoll Rand Inc
- 15.2. Market Entropy
- 15.2.1 Company's Key Areas Served
- 15.2.2 Recent Developments
- 15.3. Company Market Share Analysis 2025
- 15.3.1 Top 5 Companies Market Share Analysis
- 15.3.2 Top 3 Companies Market Share Analysis
- 15.4. List of Potential Customers
- 16. Research Methodology
List of Figures
- Figure 1: Global Compressor Market Revenue Breakdown (Million, %) by Region 2025 & 2033
- Figure 2: North America Compressor Market Revenue (Million), by End-User 2025 & 2033
- Figure 3: North America Compressor Market Revenue Share (%), by End-User 2025 & 2033
- Figure 4: North America Compressor Market Revenue (Million), by Type 2025 & 2033
- Figure 5: North America Compressor Market Revenue Share (%), by Type 2025 & 2033
- Figure 6: North America Compressor Market Revenue (Million), by Country 2025 & 2033
- Figure 7: North America Compressor Market Revenue Share (%), by Country 2025 & 2033
- Figure 8: Europe Compressor Market Revenue (Million), by End-User 2025 & 2033
- Figure 9: Europe Compressor Market Revenue Share (%), by End-User 2025 & 2033
- Figure 10: Europe Compressor Market Revenue (Million), by Type 2025 & 2033
- Figure 11: Europe Compressor Market Revenue Share (%), by Type 2025 & 2033
- Figure 12: Europe Compressor Market Revenue (Million), by Country 2025 & 2033
- Figure 13: Europe Compressor Market Revenue Share (%), by Country 2025 & 2033
- Figure 14: Asia Pacific Compressor Market Revenue (Million), by End-User 2025 & 2033
- Figure 15: Asia Pacific Compressor Market Revenue Share (%), by End-User 2025 & 2033
- Figure 16: Asia Pacific Compressor Market Revenue (Million), by Type 2025 & 2033
- Figure 17: Asia Pacific Compressor Market Revenue Share (%), by Type 2025 & 2033
- Figure 18: Asia Pacific Compressor Market Revenue (Million), by Country 2025 & 2033
- Figure 19: Asia Pacific Compressor Market Revenue Share (%), by Country 2025 & 2033
- Figure 20: Rest of Asia Pacific Compressor Market Revenue (Million), by End-User 2025 & 2033
- Figure 21: Rest of Asia Pacific Compressor Market Revenue Share (%), by End-User 2025 & 2033
- Figure 22: Rest of Asia Pacific Compressor Market Revenue (Million), by Type 2025 & 2033
- Figure 23: Rest of Asia Pacific Compressor Market Revenue Share (%), by Type 2025 & 2033
- Figure 24: Rest of Asia Pacific Compressor Market Revenue (Million), by Country 2025 & 2033
- Figure 25: Rest of Asia Pacific Compressor Market Revenue Share (%), by Country 2025 & 2033
- Figure 26: South America Compressor Market Revenue (Million), by End-User 2025 & 2033
- Figure 27: South America Compressor Market Revenue Share (%), by End-User 2025 & 2033
- Figure 28: South America Compressor Market Revenue (Million), by Type 2025 & 2033
- Figure 29: South America Compressor Market Revenue Share (%), by Type 2025 & 2033
- Figure 30: South America Compressor Market Revenue (Million), by Country 2025 & 2033
- Figure 31: South America Compressor Market Revenue Share (%), by Country 2025 & 2033
- Figure 32: Middle East and Africa Compressor Market Revenue (Million), by End-User 2025 & 2033
- Figure 33: Middle East and Africa Compressor Market Revenue Share (%), by End-User 2025 & 2033
- Figure 34: Middle East and Africa Compressor Market Revenue (Million), by Type 2025 & 2033
- Figure 35: Middle East and Africa Compressor Market Revenue Share (%), by Type 2025 & 2033
- Figure 36: Middle East and Africa Compressor Market Revenue (Million), by Country 2025 & 2033
- Figure 37: Middle East and Africa Compressor Market Revenue Share (%), by Country 2025 & 2033
- Figure 38: Egypt Compressor Market Revenue (Million), by End-User 2025 & 2033
- Figure 39: Egypt Compressor Market Revenue Share (%), by End-User 2025 & 2033
- Figure 40: Egypt Compressor Market Revenue (Million), by Type 2025 & 2033
- Figure 41: Egypt Compressor Market Revenue Share (%), by Type 2025 & 2033
- Figure 42: Egypt Compressor Market Revenue (Million), by Country 2025 & 2033
- Figure 43: Egypt Compressor Market Revenue Share (%), by Country 2025 & 2033
- Figure 44: Rest of Middle East and Africa Compressor Market Revenue (Million), by End-User 2025 & 2033
- Figure 45: Rest of Middle East and Africa Compressor Market Revenue Share (%), by End-User 2025 & 2033
- Figure 46: Rest of Middle East and Africa Compressor Market Revenue (Million), by Type 2025 & 2033
- Figure 47: Rest of Middle East and Africa Compressor Market Revenue Share (%), by Type 2025 & 2033
- Figure 48: Rest of Middle East and Africa Compressor Market Revenue (Million), by Country 2025 & 2033
- Figure 49: Rest of Middle East and Africa Compressor Market Revenue Share (%), by Country 2025 & 2033
List of Tables
- Table 1: Global Compressor Market Revenue Million Forecast, by End-User 2020 & 2033
- Table 2: Global Compressor Market Revenue Million Forecast, by Type 2020 & 2033
- Table 3: Global Compressor Market Revenue Million Forecast, by Region 2020 & 2033
- Table 4: Global Compressor Market Revenue Million Forecast, by End-User 2020 & 2033
- Table 5: Global Compressor Market Revenue Million Forecast, by Type 2020 & 2033
- Table 6: Global Compressor Market Revenue Million Forecast, by Country 2020 & 2033
- Table 7: United States Compressor Market Revenue (Million) Forecast, by Application 2020 & 2033
- Table 8: Canada Compressor Market Revenue (Million) Forecast, by Application 2020 & 2033
- Table 9: Rest of North America Compressor Market Revenue (Million) Forecast, by Application 2020 & 2033
- Table 10: Global Compressor Market Revenue Million Forecast, by End-User 2020 & 2033
- Table 11: Global Compressor Market Revenue Million Forecast, by Type 2020 & 2033
- Table 12: Global Compressor Market Revenue Million Forecast, by Country 2020 & 2033
- Table 13: Germany Compressor Market Revenue (Million) Forecast, by Application 2020 & 2033
- Table 14: France Compressor Market Revenue (Million) Forecast, by Application 2020 & 2033
- Table 15: United Kingdom Compressor Market Revenue (Million) Forecast, by Application 2020 & 2033
- Table 16: Spain Compressor Market Revenue (Million) Forecast, by Application 2020 & 2033
- Table 17: Norway Compressor Market Revenue (Million) Forecast, by Application 2020 & 2033
- Table 18: Turkey Compressor Market Revenue (Million) Forecast, by Application 2020 & 2033
- Table 19: Russia Compressor Market Revenue (Million) Forecast, by Application 2020 & 2033
- Table 20: NORDIC Compressor Market Revenue (Million) Forecast, by Application 2020 & 2033
- Table 21: Rest of Europe Compressor Market Revenue (Million) Forecast, by Application 2020 & 2033
- Table 22: Global Compressor Market Revenue Million Forecast, by End-User 2020 & 2033
- Table 23: Global Compressor Market Revenue Million Forecast, by Type 2020 & 2033
- Table 24: Global Compressor Market Revenue Million Forecast, by Country 2020 & 2033
- Table 25: China Compressor Market Revenue (Million) Forecast, by Application 2020 & 2033
- Table 26: India Compressor Market Revenue (Million) Forecast, by Application 2020 & 2033
- Table 27: Malaysia Compressor Market Revenue (Million) Forecast, by Application 2020 & 2033
- Table 28: Thailand Compressor Market Revenue (Million) Forecast, by Application 2020 & 2033
- Table 29: Australia Compressor Market Revenue (Million) Forecast, by Application 2020 & 2033
- Table 30: Indonesia Compressor Market Revenue (Million) Forecast, by Application 2020 & 2033
- Table 31: Vietnam Compressor Market Revenue (Million) Forecast, by Application 2020 & 2033
- Table 32: Global Compressor Market Revenue Million Forecast, by End-User 2020 & 2033
- Table 33: Global Compressor Market Revenue Million Forecast, by Type 2020 & 2033
- Table 34: Global Compressor Market Revenue Million Forecast, by Country 2020 & 2033
- Table 35: Global Compressor Market Revenue Million Forecast, by End-User 2020 & 2033
- Table 36: Global Compressor Market Revenue Million Forecast, by Type 2020 & 2033
- Table 37: Global Compressor Market Revenue Million Forecast, by Country 2020 & 2033
- Table 38: Brazil Compressor Market Revenue (Million) Forecast, by Application 2020 & 2033
- Table 39: Argentina Compressor Market Revenue (Million) Forecast, by Application 2020 & 2033
- Table 40: Colombia Compressor Market Revenue (Million) Forecast, by Application 2020 & 2033
- Table 41: Rest of South America Compressor Market Revenue (Million) Forecast, by Application 2020 & 2033
- Table 42: Global Compressor Market Revenue Million Forecast, by End-User 2020 & 2033
- Table 43: Global Compressor Market Revenue Million Forecast, by Type 2020 & 2033
- Table 44: Global Compressor Market Revenue Million Forecast, by Country 2020 & 2033
- Table 45: Saudi Arabia Compressor Market Revenue (Million) Forecast, by Application 2020 & 2033
- Table 46: United Arab Emirates Compressor Market Revenue (Million) Forecast, by Application 2020 & 2033
- Table 47: South Africa Compressor Market Revenue (Million) Forecast, by Application 2020 & 2033
- Table 48: Nigeria Compressor Market Revenue (Million) Forecast, by Application 2020 & 2033
- Table 49: Qatar Compressor Market Revenue (Million) Forecast, by Application 2020 & 2033
- Table 50: Global Compressor Market Revenue Million Forecast, by End-User 2020 & 2033
- Table 51: Global Compressor Market Revenue Million Forecast, by Type 2020 & 2033
- Table 52: Global Compressor Market Revenue Million Forecast, by Country 2020 & 2033
- Table 53: Global Compressor Market Revenue Million Forecast, by End-User 2020 & 2033
- Table 54: Global Compressor Market Revenue Million Forecast, by Type 2020 & 2033
- Table 55: Global Compressor Market Revenue Million Forecast, by Country 2020 & 2033
Frequently Asked Questions
1. What is the projected Compound Annual Growth Rate (CAGR) of the Compressor Market?
The projected CAGR is approximately 4.81%.
2. Which companies are prominent players in the Compressor Market?
Key companies in the market include Ingersoll Rand Inc, Ebara Corporation, Sulzer Ltd*List Not Exhaustive 6 4 Market Ranking/ Share Analysi, Bauer Compressors Inc, Atlas Copco AB, Baker Hughes Co, Ariel Corporation, Aerzener Maschinenfabrik GmbH, Burckhardt Compression Holding AG, Siemens Energy AG.
3. What are the main segments of the Compressor Market?
The market segments include End-User, Type.
4. Can you provide details about the market size?
The market size is estimated to be USD 42.04 Million as of 2022.
5. What are some drivers contributing to market growth?
4.; The Growing Demand for Natural Gas4.; Rising Pipeline Infrastructure across Globe.
6. What are the notable trends driving market growth?
Oil and Gas Segment Expected to Dominate the Market.
7. Are there any restraints impacting market growth?
4.; Increasing Adoption of Solar and Wind Energies.
8. Can you provide examples of recent developments in the market?
April 2024: The Srikail gas field in Cumilla signed a contract to receive three wellhead compressors with a capacity of 10 million cubic feet per day, along with related infrastructure, owing to a deal inked by Bangladesh Petroleum Exploration and Production Company Ltd and SC Euro Gas Systems SRL, Romania.
9. What pricing options are available for accessing the report?
Pricing options include single-user, multi-user, and enterprise licenses priced at USD 4750, USD 5250, and USD 8750 respectively.
10. Is the market size provided in terms of value or volume?
The market size is provided in terms of value, measured in Million.
11. Are there any specific market keywords associated with the report?
Yes, the market keyword associated with the report is "Compressor Market," which aids in identifying and referencing the specific market segment covered.
12. How do I determine which pricing option suits my needs best?
The pricing options vary based on user requirements and access needs. Individual users may opt for single-user licenses, while businesses requiring broader access may choose multi-user or enterprise licenses for cost-effective access to the report.
13. Are there any additional resources or data provided in the Compressor Market report?
While the report offers comprehensive insights, it's advisable to review the specific contents or supplementary materials provided to ascertain if additional resources or data are available.
14. How can I stay updated on further developments or reports in the Compressor Market?
To stay informed about further developments, trends, and reports in the Compressor Market, consider subscribing to industry newsletters, following relevant companies and organizations, or regularly checking reputable industry news sources and publications.
Methodology
Step 1 - Identification of Relevant Samples Size from Population Database


Step 2 - Approaches for Defining Global Market Size (Value, Volume* & Price*)

Note*: In applicable scenarios
Step 3 - Data Sources
Primary Research
- Web Analytics
- Survey Reports
- Research Institute
- Latest Research Reports
- Opinion Leaders
Secondary Research
- Annual Reports
- White Paper
- Latest Press Release
- Industry Association
- Paid Database
- Investor Presentations

Step 4 - Data Triangulation
Involves using different sources of information in order to increase the validity of a study
These sources are likely to be stakeholders in a program - participants, other researchers, program staff, other community members, and so on.
Then we put all data in single framework & apply various statistical tools to find out the dynamic on the market.
During the analysis stage, feedback from the stakeholder groups would be compared to determine areas of agreement as well as areas of divergence