

Key Insights
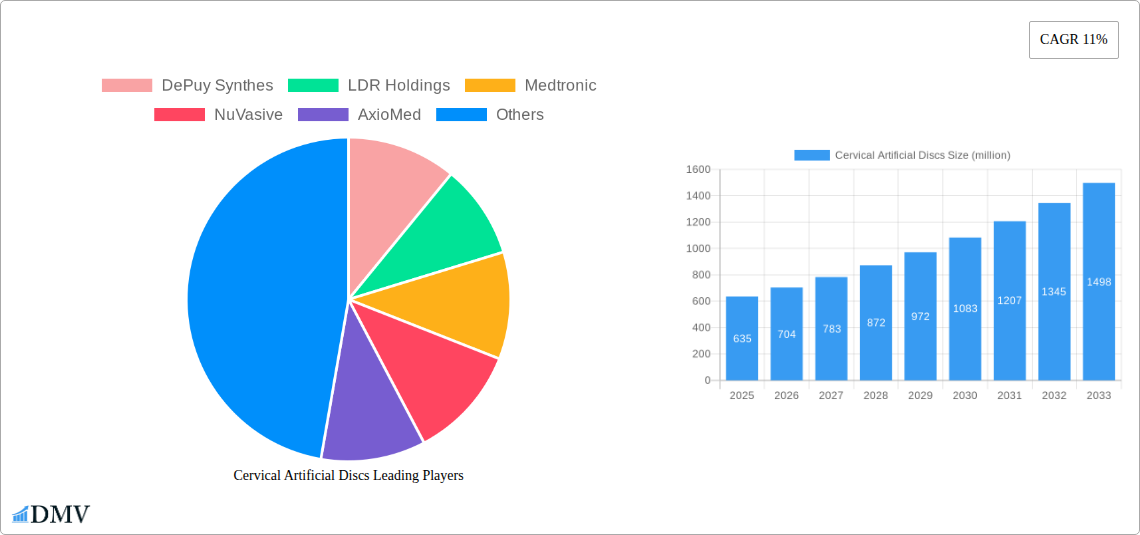
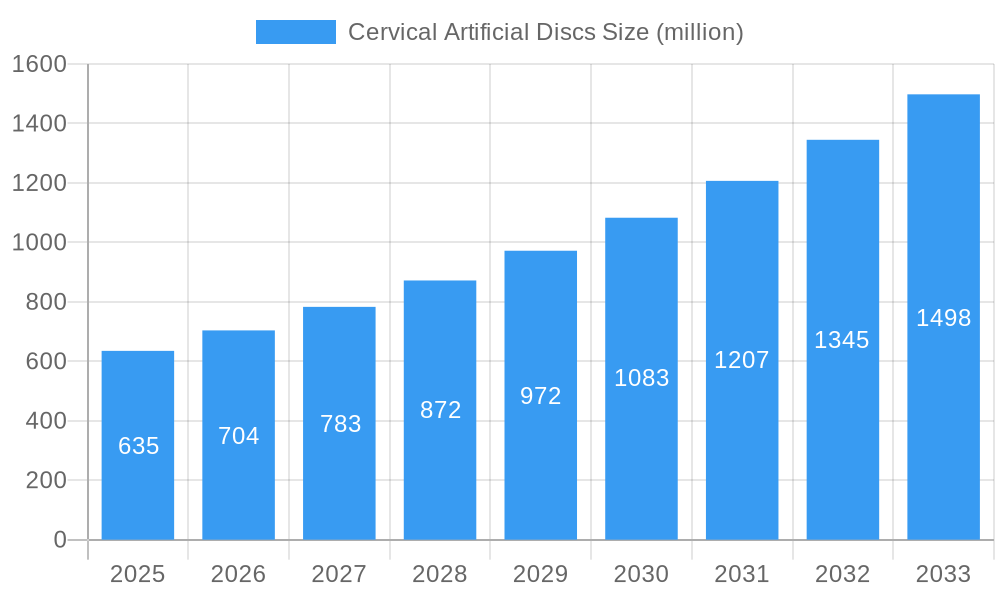
The global cervical artificial disc market, currently valued at $635 million in 2025, is projected to experience robust growth, driven by a Compound Annual Growth Rate (CAGR) of 11% from 2025 to 2033. This expansion is fueled by several key factors. The increasing prevalence of cervical degenerative disc disease (DDD), a condition significantly impacting aging populations worldwide, is a major driver. Technological advancements leading to the development of more durable and biocompatible artificial discs are also contributing to market growth. Minimally invasive surgical techniques, offering patients faster recovery times and reduced hospital stays, are further boosting adoption. Furthermore, a growing awareness among patients and healthcare professionals regarding the benefits of cervical artificial disc replacement (CAD) compared to traditional fusion surgery is fueling demand. This preference stems from CAD's potential to preserve spinal motion and improve long-term patient outcomes.
Cervical Artificial Discs Market Size (In Million)
However, the market also faces certain restraints. The relatively high cost of CAD procedures compared to other treatment options can limit accessibility, particularly in regions with limited healthcare resources. Potential complications associated with the procedure, though rare, remain a concern for some patients and physicians. Stringent regulatory approvals and the need for specialized surgical expertise are additional factors influencing market growth. Despite these challenges, the long-term outlook for the cervical artificial disc market remains positive, driven by continued innovation, increasing demand, and expanding global healthcare infrastructure. The key players in this competitive market – DePuy Synthes, LDR Holdings, Medtronic, NuVasive, AxioMed, Globus Medical, Joimax, Orthofix, Spinal Kinetics, and Vertebral Technologies – are continuously striving to improve their product offerings and expand their market presence.
Cervical Artificial Discs Company Market Share
Cervical Artificial Discs Market Report: A Comprehensive Analysis (2019-2033)
This insightful report provides a comprehensive analysis of the global Cervical Artificial Discs market, projecting a market value exceeding $XX million by 2033. The study meticulously examines market dynamics, competitive landscapes, and future growth prospects, offering invaluable insights for stakeholders across the medical device industry. Utilizing data from the historical period (2019-2024), base year (2025), and estimated year (2025), this report forecasts market trends until 2033.
Cervical Artificial Discs Market Composition & Trends
The global Cervical Artificial Discs market, valued at $XX million in 2025, is characterized by a moderately concentrated landscape with key players vying for market share. DePuy Synthes, Medtronic, and NuVasive currently hold significant portions of the market, but smaller players like LDR Holdings and Globus Medical are actively innovating to gain traction. Market share distribution fluctuates based on product innovation, regulatory approvals, and successful marketing strategies. The market is experiencing a gradual shift towards minimally invasive surgical techniques, driving demand for smaller, more efficient devices. Mergers and acquisitions (M&A) play a significant role in shaping market dynamics. Over the past five years, M&A activity within the sector has reached an estimated value of $XX million, fostering consolidation and accelerating technological advancements.
- Market Concentration: Moderately concentrated, with top 3 players accounting for approximately XX% of the market share in 2025.
- Innovation Catalysts: Minimally invasive surgery techniques, advanced biomaterials, and improved implant designs.
- Regulatory Landscape: Stringent regulatory approvals and post-market surveillance influence market entry and product lifecycle.
- Substitute Products: Traditional spinal fusion surgery remains a primary competitor.
- End-User Profiles: The primary end-users are hospitals, ambulatory surgical centers, and specialized spinal clinics.
- M&A Activities: Significant activity observed, with total deal value exceeding $XX million during 2019-2024, primarily driven by strategic acquisitions and consolidations.
Cervical Artificial Discs Industry Evolution
The Cervical Artificial Discs market exhibits a robust growth trajectory, driven by several factors. The aging global population, increased prevalence of cervical degenerative disc disease, and growing awareness about minimally invasive surgical alternatives contribute to the market’s expansion. Technological advancements, including the development of biocompatible materials, improved implant designs, and enhanced surgical techniques, are significantly influencing the market’s evolution. Adoption rates of cervical artificial discs are gradually increasing, especially in regions with advanced healthcare infrastructure. However, high procedure costs and potential risks associated with the surgery remain challenges that influence market penetration. The annual growth rate (AGR) during the forecast period (2025-2033) is projected to reach XX%, pushing the market value beyond $XX million by 2033.
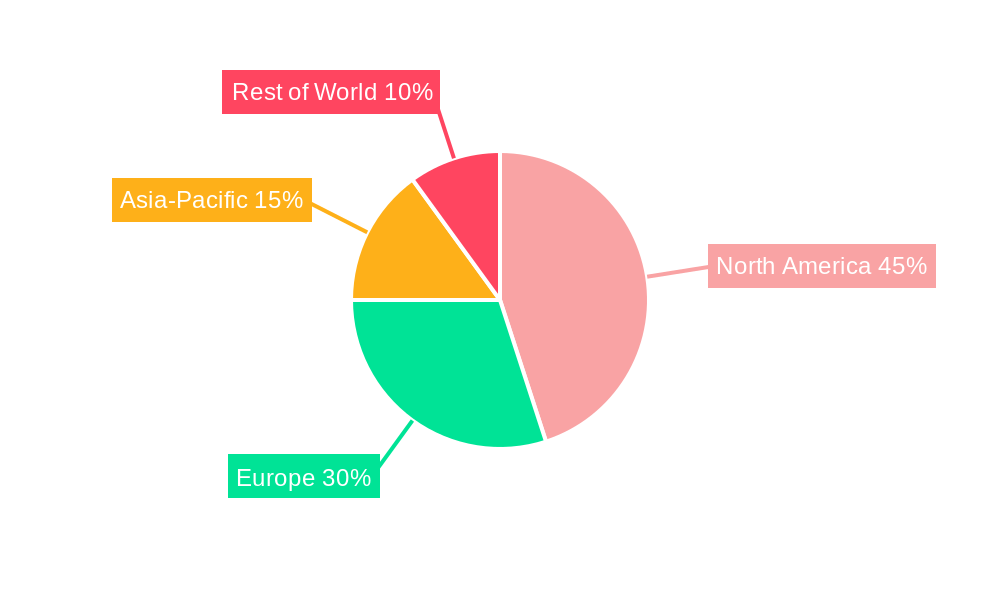
Leading Regions, Countries, or Segments in Cervical Artificial Discs
North America currently dominates the Cervical Artificial Discs market, driven by higher healthcare expenditure, advanced medical infrastructure, and a large patient pool. This dominance is fuelled by significant investments in research and development, stringent regulatory frameworks fostering innovation, and a growing preference for minimally invasive surgical procedures.
- Key Drivers for North American Dominance:
- High healthcare expenditure and insurance coverage.
- Strong regulatory support and clinical trial infrastructure.
- Advanced medical technology adoption rates.
- Growing awareness and acceptance of minimally invasive surgical procedures.
- Other Regions: European markets are exhibiting steady growth, followed by the Asia-Pacific region, which is expected to witness the fastest growth rate during the forecast period. This growth in the Asia-Pacific region is largely attributed to rising disposable incomes, an expanding elderly population, and increasing adoption of advanced surgical techniques.
Cervical Artificial Discs Product Innovations
Recent innovations in Cervical Artificial Discs include the development of smaller, more biocompatible implants designed to minimize invasiveness and improve patient outcomes. These newer designs incorporate advanced materials and features aimed at optimizing long-term stability and reducing complications. Performance metrics such as range of motion, fusion rates, and patient reported outcome measures are being continuously improved. Unique selling propositions (USPs) emphasize the enhanced functionality and biocompatibility of these newer-generation implants, positioning them as superior alternatives to traditional spinal fusion procedures.
Propelling Factors for Cervical Artificial Discs Growth
Technological advancements in biomaterials, implant design, and surgical techniques are key growth drivers. Increased awareness among patients and healthcare providers about minimally invasive spinal surgery and its benefits further fuels market expansion. Favorable regulatory environments and increased healthcare expenditure also contribute significantly to market growth.
Obstacles in the Cervical Artificial Discs Market
High procedure costs, the potential for complications and revision surgeries, and the availability of alternative treatment options represent major challenges. Stringent regulatory approval processes can delay market entry for new products. Furthermore, the potential for supply chain disruptions and competitive pressures from established players and emerging competitors impact market growth.
Future Opportunities in Cervical Artificial Discs
The market presents several promising opportunities. Expansion into untapped markets in emerging economies, the development of personalized implants, and the integration of advanced imaging and surgical technologies offer significant growth potential. Furthermore, advancements in biomaterials, focusing on improved biocompatibility and longevity, hold immense promise for improving implant performance.
Major Players in the Cervical Artificial Discs Ecosystem
- DePuy Synthes
- LDR Holdings
- Medtronic
- NuVasive
- AxioMed
- Globus Medical
- Joimax
- Orthofix
- Spinal Kinetics
- Vertebral Technologies
Key Developments in Cervical Artificial Discs Industry
- 2022-Q4: DePuy Synthes launches a new cervical disc with enhanced biocompatibility.
- 2023-Q1: Medtronic announces a strategic partnership for the development of a minimally invasive surgical platform for cervical disc replacement.
- 2023-Q3: Globus Medical secures FDA approval for a new generation of cervical artificial disc.
Strategic Cervical Artificial Discs Market Forecast
The Cervical Artificial Discs market is poised for significant growth driven by technological innovation, increasing patient demand, and expansion into new geographic markets. The continued development of minimally invasive surgical techniques, personalized implants, and advanced biomaterials will further propel market expansion. The projected annual growth rate is expected to maintain a robust trajectory, indicating a highly promising future for this sector.
Cervical Artificial Discs Segmentation
-
1. Application
- 1.1. Hospitals
- 1.2. Ambulatory Surgical Centers
-
2. Type
- 2.1. Metal
- 2.2. Biopolymer
Cervical Artificial Discs Segmentation By Geography
-
1. North America
- 1.1. United States
- 1.2. Canada
- 1.3. Mexico
-
2. South America
- 2.1. Brazil
- 2.2. Argentina
- 2.3. Rest of South America
-
3. Europe
- 3.1. United Kingdom
- 3.2. Germany
- 3.3. France
- 3.4. Italy
- 3.5. Spain
- 3.6. Russia
- 3.7. Benelux
- 3.8. Nordics
- 3.9. Rest of Europe
-
4. Middle East & Africa
- 4.1. Turkey
- 4.2. Israel
- 4.3. GCC
- 4.4. North Africa
- 4.5. South Africa
- 4.6. Rest of Middle East & Africa
-
5. Asia Pacific
- 5.1. China
- 5.2. India
- 5.3. Japan
- 5.4. South Korea
- 5.5. ASEAN
- 5.6. Oceania
- 5.7. Rest of Asia Pacific
Cervical Artificial Discs Regional Market Share
Geographic Coverage of Cervical Artificial Discs
Cervical Artificial Discs REPORT HIGHLIGHTS
| Aspects | Details |
|---|---|
| Study Period | 2020-2034 |
| Base Year | 2025 |
| Estimated Year | 2026 |
| Forecast Period | 2026-2034 |
| Historical Period | 2020-2025 |
| Growth Rate | CAGR of 11% from 2020-2034 |
| Segmentation |
|
Table of Contents
- 1. Introduction
- 1.1. Research Scope
- 1.2. Market Segmentation
- 1.3. Research Methodology
- 1.4. Definitions and Assumptions
- 2. Executive Summary
- 2.1. Introduction
- 3. Market Dynamics
- 3.1. Introduction
- 3.2. Market Drivers
- 3.3. Market Restrains
- 3.4. Market Trends
- 4. Market Factor Analysis
- 4.1. Porters Five Forces
- 4.2. Supply/Value Chain
- 4.3. PESTEL analysis
- 4.4. Market Entropy
- 4.5. Patent/Trademark Analysis
- 5. Global Cervical Artificial Discs Analysis, Insights and Forecast, 2020-2032
- 5.1. Market Analysis, Insights and Forecast - by Application
- 5.1.1. Hospitals
- 5.1.2. Ambulatory Surgical Centers
- 5.2. Market Analysis, Insights and Forecast - by Type
- 5.2.1. Metal
- 5.2.2. Biopolymer
- 5.3. Market Analysis, Insights and Forecast - by Region
- 5.3.1. North America
- 5.3.2. South America
- 5.3.3. Europe
- 5.3.4. Middle East & Africa
- 5.3.5. Asia Pacific
- 5.1. Market Analysis, Insights and Forecast - by Application
- 6. North America Cervical Artificial Discs Analysis, Insights and Forecast, 2020-2032
- 6.1. Market Analysis, Insights and Forecast - by Application
- 6.1.1. Hospitals
- 6.1.2. Ambulatory Surgical Centers
- 6.2. Market Analysis, Insights and Forecast - by Type
- 6.2.1. Metal
- 6.2.2. Biopolymer
- 6.1. Market Analysis, Insights and Forecast - by Application
- 7. South America Cervical Artificial Discs Analysis, Insights and Forecast, 2020-2032
- 7.1. Market Analysis, Insights and Forecast - by Application
- 7.1.1. Hospitals
- 7.1.2. Ambulatory Surgical Centers
- 7.2. Market Analysis, Insights and Forecast - by Type
- 7.2.1. Metal
- 7.2.2. Biopolymer
- 7.1. Market Analysis, Insights and Forecast - by Application
- 8. Europe Cervical Artificial Discs Analysis, Insights and Forecast, 2020-2032
- 8.1. Market Analysis, Insights and Forecast - by Application
- 8.1.1. Hospitals
- 8.1.2. Ambulatory Surgical Centers
- 8.2. Market Analysis, Insights and Forecast - by Type
- 8.2.1. Metal
- 8.2.2. Biopolymer
- 8.1. Market Analysis, Insights and Forecast - by Application
- 9. Middle East & Africa Cervical Artificial Discs Analysis, Insights and Forecast, 2020-2032
- 9.1. Market Analysis, Insights and Forecast - by Application
- 9.1.1. Hospitals
- 9.1.2. Ambulatory Surgical Centers
- 9.2. Market Analysis, Insights and Forecast - by Type
- 9.2.1. Metal
- 9.2.2. Biopolymer
- 9.1. Market Analysis, Insights and Forecast - by Application
- 10. Asia Pacific Cervical Artificial Discs Analysis, Insights and Forecast, 2020-2032
- 10.1. Market Analysis, Insights and Forecast - by Application
- 10.1.1. Hospitals
- 10.1.2. Ambulatory Surgical Centers
- 10.2. Market Analysis, Insights and Forecast - by Type
- 10.2.1. Metal
- 10.2.2. Biopolymer
- 10.1. Market Analysis, Insights and Forecast - by Application
- 11. Competitive Analysis
- 11.1. Global Market Share Analysis 2025
- 11.2. Company Profiles
- 11.2.1 DePuy Synthes
- 11.2.1.1. Overview
- 11.2.1.2. Products
- 11.2.1.3. SWOT Analysis
- 11.2.1.4. Recent Developments
- 11.2.1.5. Financials (Based on Availability)
- 11.2.2 LDR Holdings
- 11.2.2.1. Overview
- 11.2.2.2. Products
- 11.2.2.3. SWOT Analysis
- 11.2.2.4. Recent Developments
- 11.2.2.5. Financials (Based on Availability)
- 11.2.3 Medtronic
- 11.2.3.1. Overview
- 11.2.3.2. Products
- 11.2.3.3. SWOT Analysis
- 11.2.3.4. Recent Developments
- 11.2.3.5. Financials (Based on Availability)
- 11.2.4 NuVasive
- 11.2.4.1. Overview
- 11.2.4.2. Products
- 11.2.4.3. SWOT Analysis
- 11.2.4.4. Recent Developments
- 11.2.4.5. Financials (Based on Availability)
- 11.2.5 AxioMed
- 11.2.5.1. Overview
- 11.2.5.2. Products
- 11.2.5.3. SWOT Analysis
- 11.2.5.4. Recent Developments
- 11.2.5.5. Financials (Based on Availability)
- 11.2.6 Globus Medical
- 11.2.6.1. Overview
- 11.2.6.2. Products
- 11.2.6.3. SWOT Analysis
- 11.2.6.4. Recent Developments
- 11.2.6.5. Financials (Based on Availability)
- 11.2.7 Joimax
- 11.2.7.1. Overview
- 11.2.7.2. Products
- 11.2.7.3. SWOT Analysis
- 11.2.7.4. Recent Developments
- 11.2.7.5. Financials (Based on Availability)
- 11.2.8 Orthofix
- 11.2.8.1. Overview
- 11.2.8.2. Products
- 11.2.8.3. SWOT Analysis
- 11.2.8.4. Recent Developments
- 11.2.8.5. Financials (Based on Availability)
- 11.2.9 Spinal Kinetics
- 11.2.9.1. Overview
- 11.2.9.2. Products
- 11.2.9.3. SWOT Analysis
- 11.2.9.4. Recent Developments
- 11.2.9.5. Financials (Based on Availability)
- 11.2.10 Vertebral Technologies
- 11.2.10.1. Overview
- 11.2.10.2. Products
- 11.2.10.3. SWOT Analysis
- 11.2.10.4. Recent Developments
- 11.2.10.5. Financials (Based on Availability)
- 11.2.1 DePuy Synthes
List of Figures
- Figure 1: Global Cervical Artificial Discs Revenue Breakdown (million, %) by Region 2025 & 2033
- Figure 2: Global Cervical Artificial Discs Volume Breakdown (K, %) by Region 2025 & 2033
- Figure 3: North America Cervical Artificial Discs Revenue (million), by Application 2025 & 2033
- Figure 4: North America Cervical Artificial Discs Volume (K), by Application 2025 & 2033
- Figure 5: North America Cervical Artificial Discs Revenue Share (%), by Application 2025 & 2033
- Figure 6: North America Cervical Artificial Discs Volume Share (%), by Application 2025 & 2033
- Figure 7: North America Cervical Artificial Discs Revenue (million), by Type 2025 & 2033
- Figure 8: North America Cervical Artificial Discs Volume (K), by Type 2025 & 2033
- Figure 9: North America Cervical Artificial Discs Revenue Share (%), by Type 2025 & 2033
- Figure 10: North America Cervical Artificial Discs Volume Share (%), by Type 2025 & 2033
- Figure 11: North America Cervical Artificial Discs Revenue (million), by Country 2025 & 2033
- Figure 12: North America Cervical Artificial Discs Volume (K), by Country 2025 & 2033
- Figure 13: North America Cervical Artificial Discs Revenue Share (%), by Country 2025 & 2033
- Figure 14: North America Cervical Artificial Discs Volume Share (%), by Country 2025 & 2033
- Figure 15: South America Cervical Artificial Discs Revenue (million), by Application 2025 & 2033
- Figure 16: South America Cervical Artificial Discs Volume (K), by Application 2025 & 2033
- Figure 17: South America Cervical Artificial Discs Revenue Share (%), by Application 2025 & 2033
- Figure 18: South America Cervical Artificial Discs Volume Share (%), by Application 2025 & 2033
- Figure 19: South America Cervical Artificial Discs Revenue (million), by Type 2025 & 2033
- Figure 20: South America Cervical Artificial Discs Volume (K), by Type 2025 & 2033
- Figure 21: South America Cervical Artificial Discs Revenue Share (%), by Type 2025 & 2033
- Figure 22: South America Cervical Artificial Discs Volume Share (%), by Type 2025 & 2033
- Figure 23: South America Cervical Artificial Discs Revenue (million), by Country 2025 & 2033
- Figure 24: South America Cervical Artificial Discs Volume (K), by Country 2025 & 2033
- Figure 25: South America Cervical Artificial Discs Revenue Share (%), by Country 2025 & 2033
- Figure 26: South America Cervical Artificial Discs Volume Share (%), by Country 2025 & 2033
- Figure 27: Europe Cervical Artificial Discs Revenue (million), by Application 2025 & 2033
- Figure 28: Europe Cervical Artificial Discs Volume (K), by Application 2025 & 2033
- Figure 29: Europe Cervical Artificial Discs Revenue Share (%), by Application 2025 & 2033
- Figure 30: Europe Cervical Artificial Discs Volume Share (%), by Application 2025 & 2033
- Figure 31: Europe Cervical Artificial Discs Revenue (million), by Type 2025 & 2033
- Figure 32: Europe Cervical Artificial Discs Volume (K), by Type 2025 & 2033
- Figure 33: Europe Cervical Artificial Discs Revenue Share (%), by Type 2025 & 2033
- Figure 34: Europe Cervical Artificial Discs Volume Share (%), by Type 2025 & 2033
- Figure 35: Europe Cervical Artificial Discs Revenue (million), by Country 2025 & 2033
- Figure 36: Europe Cervical Artificial Discs Volume (K), by Country 2025 & 2033
- Figure 37: Europe Cervical Artificial Discs Revenue Share (%), by Country 2025 & 2033
- Figure 38: Europe Cervical Artificial Discs Volume Share (%), by Country 2025 & 2033
- Figure 39: Middle East & Africa Cervical Artificial Discs Revenue (million), by Application 2025 & 2033
- Figure 40: Middle East & Africa Cervical Artificial Discs Volume (K), by Application 2025 & 2033
- Figure 41: Middle East & Africa Cervical Artificial Discs Revenue Share (%), by Application 2025 & 2033
- Figure 42: Middle East & Africa Cervical Artificial Discs Volume Share (%), by Application 2025 & 2033
- Figure 43: Middle East & Africa Cervical Artificial Discs Revenue (million), by Type 2025 & 2033
- Figure 44: Middle East & Africa Cervical Artificial Discs Volume (K), by Type 2025 & 2033
- Figure 45: Middle East & Africa Cervical Artificial Discs Revenue Share (%), by Type 2025 & 2033
- Figure 46: Middle East & Africa Cervical Artificial Discs Volume Share (%), by Type 2025 & 2033
- Figure 47: Middle East & Africa Cervical Artificial Discs Revenue (million), by Country 2025 & 2033
- Figure 48: Middle East & Africa Cervical Artificial Discs Volume (K), by Country 2025 & 2033
- Figure 49: Middle East & Africa Cervical Artificial Discs Revenue Share (%), by Country 2025 & 2033
- Figure 50: Middle East & Africa Cervical Artificial Discs Volume Share (%), by Country 2025 & 2033
- Figure 51: Asia Pacific Cervical Artificial Discs Revenue (million), by Application 2025 & 2033
- Figure 52: Asia Pacific Cervical Artificial Discs Volume (K), by Application 2025 & 2033
- Figure 53: Asia Pacific Cervical Artificial Discs Revenue Share (%), by Application 2025 & 2033
- Figure 54: Asia Pacific Cervical Artificial Discs Volume Share (%), by Application 2025 & 2033
- Figure 55: Asia Pacific Cervical Artificial Discs Revenue (million), by Type 2025 & 2033
- Figure 56: Asia Pacific Cervical Artificial Discs Volume (K), by Type 2025 & 2033
- Figure 57: Asia Pacific Cervical Artificial Discs Revenue Share (%), by Type 2025 & 2033
- Figure 58: Asia Pacific Cervical Artificial Discs Volume Share (%), by Type 2025 & 2033
- Figure 59: Asia Pacific Cervical Artificial Discs Revenue (million), by Country 2025 & 2033
- Figure 60: Asia Pacific Cervical Artificial Discs Volume (K), by Country 2025 & 2033
- Figure 61: Asia Pacific Cervical Artificial Discs Revenue Share (%), by Country 2025 & 2033
- Figure 62: Asia Pacific Cervical Artificial Discs Volume Share (%), by Country 2025 & 2033
List of Tables
- Table 1: Global Cervical Artificial Discs Revenue million Forecast, by Application 2020 & 2033
- Table 2: Global Cervical Artificial Discs Volume K Forecast, by Application 2020 & 2033
- Table 3: Global Cervical Artificial Discs Revenue million Forecast, by Type 2020 & 2033
- Table 4: Global Cervical Artificial Discs Volume K Forecast, by Type 2020 & 2033
- Table 5: Global Cervical Artificial Discs Revenue million Forecast, by Region 2020 & 2033
- Table 6: Global Cervical Artificial Discs Volume K Forecast, by Region 2020 & 2033
- Table 7: Global Cervical Artificial Discs Revenue million Forecast, by Application 2020 & 2033
- Table 8: Global Cervical Artificial Discs Volume K Forecast, by Application 2020 & 2033
- Table 9: Global Cervical Artificial Discs Revenue million Forecast, by Type 2020 & 2033
- Table 10: Global Cervical Artificial Discs Volume K Forecast, by Type 2020 & 2033
- Table 11: Global Cervical Artificial Discs Revenue million Forecast, by Country 2020 & 2033
- Table 12: Global Cervical Artificial Discs Volume K Forecast, by Country 2020 & 2033
- Table 13: United States Cervical Artificial Discs Revenue (million) Forecast, by Application 2020 & 2033
- Table 14: United States Cervical Artificial Discs Volume (K) Forecast, by Application 2020 & 2033
- Table 15: Canada Cervical Artificial Discs Revenue (million) Forecast, by Application 2020 & 2033
- Table 16: Canada Cervical Artificial Discs Volume (K) Forecast, by Application 2020 & 2033
- Table 17: Mexico Cervical Artificial Discs Revenue (million) Forecast, by Application 2020 & 2033
- Table 18: Mexico Cervical Artificial Discs Volume (K) Forecast, by Application 2020 & 2033
- Table 19: Global Cervical Artificial Discs Revenue million Forecast, by Application 2020 & 2033
- Table 20: Global Cervical Artificial Discs Volume K Forecast, by Application 2020 & 2033
- Table 21: Global Cervical Artificial Discs Revenue million Forecast, by Type 2020 & 2033
- Table 22: Global Cervical Artificial Discs Volume K Forecast, by Type 2020 & 2033
- Table 23: Global Cervical Artificial Discs Revenue million Forecast, by Country 2020 & 2033
- Table 24: Global Cervical Artificial Discs Volume K Forecast, by Country 2020 & 2033
- Table 25: Brazil Cervical Artificial Discs Revenue (million) Forecast, by Application 2020 & 2033
- Table 26: Brazil Cervical Artificial Discs Volume (K) Forecast, by Application 2020 & 2033
- Table 27: Argentina Cervical Artificial Discs Revenue (million) Forecast, by Application 2020 & 2033
- Table 28: Argentina Cervical Artificial Discs Volume (K) Forecast, by Application 2020 & 2033
- Table 29: Rest of South America Cervical Artificial Discs Revenue (million) Forecast, by Application 2020 & 2033
- Table 30: Rest of South America Cervical Artificial Discs Volume (K) Forecast, by Application 2020 & 2033
- Table 31: Global Cervical Artificial Discs Revenue million Forecast, by Application 2020 & 2033
- Table 32: Global Cervical Artificial Discs Volume K Forecast, by Application 2020 & 2033
- Table 33: Global Cervical Artificial Discs Revenue million Forecast, by Type 2020 & 2033
- Table 34: Global Cervical Artificial Discs Volume K Forecast, by Type 2020 & 2033
- Table 35: Global Cervical Artificial Discs Revenue million Forecast, by Country 2020 & 2033
- Table 36: Global Cervical Artificial Discs Volume K Forecast, by Country 2020 & 2033
- Table 37: United Kingdom Cervical Artificial Discs Revenue (million) Forecast, by Application 2020 & 2033
- Table 38: United Kingdom Cervical Artificial Discs Volume (K) Forecast, by Application 2020 & 2033
- Table 39: Germany Cervical Artificial Discs Revenue (million) Forecast, by Application 2020 & 2033
- Table 40: Germany Cervical Artificial Discs Volume (K) Forecast, by Application 2020 & 2033
- Table 41: France Cervical Artificial Discs Revenue (million) Forecast, by Application 2020 & 2033
- Table 42: France Cervical Artificial Discs Volume (K) Forecast, by Application 2020 & 2033
- Table 43: Italy Cervical Artificial Discs Revenue (million) Forecast, by Application 2020 & 2033
- Table 44: Italy Cervical Artificial Discs Volume (K) Forecast, by Application 2020 & 2033
- Table 45: Spain Cervical Artificial Discs Revenue (million) Forecast, by Application 2020 & 2033
- Table 46: Spain Cervical Artificial Discs Volume (K) Forecast, by Application 2020 & 2033
- Table 47: Russia Cervical Artificial Discs Revenue (million) Forecast, by Application 2020 & 2033
- Table 48: Russia Cervical Artificial Discs Volume (K) Forecast, by Application 2020 & 2033
- Table 49: Benelux Cervical Artificial Discs Revenue (million) Forecast, by Application 2020 & 2033
- Table 50: Benelux Cervical Artificial Discs Volume (K) Forecast, by Application 2020 & 2033
- Table 51: Nordics Cervical Artificial Discs Revenue (million) Forecast, by Application 2020 & 2033
- Table 52: Nordics Cervical Artificial Discs Volume (K) Forecast, by Application 2020 & 2033
- Table 53: Rest of Europe Cervical Artificial Discs Revenue (million) Forecast, by Application 2020 & 2033
- Table 54: Rest of Europe Cervical Artificial Discs Volume (K) Forecast, by Application 2020 & 2033
- Table 55: Global Cervical Artificial Discs Revenue million Forecast, by Application 2020 & 2033
- Table 56: Global Cervical Artificial Discs Volume K Forecast, by Application 2020 & 2033
- Table 57: Global Cervical Artificial Discs Revenue million Forecast, by Type 2020 & 2033
- Table 58: Global Cervical Artificial Discs Volume K Forecast, by Type 2020 & 2033
- Table 59: Global Cervical Artificial Discs Revenue million Forecast, by Country 2020 & 2033
- Table 60: Global Cervical Artificial Discs Volume K Forecast, by Country 2020 & 2033
- Table 61: Turkey Cervical Artificial Discs Revenue (million) Forecast, by Application 2020 & 2033
- Table 62: Turkey Cervical Artificial Discs Volume (K) Forecast, by Application 2020 & 2033
- Table 63: Israel Cervical Artificial Discs Revenue (million) Forecast, by Application 2020 & 2033
- Table 64: Israel Cervical Artificial Discs Volume (K) Forecast, by Application 2020 & 2033
- Table 65: GCC Cervical Artificial Discs Revenue (million) Forecast, by Application 2020 & 2033
- Table 66: GCC Cervical Artificial Discs Volume (K) Forecast, by Application 2020 & 2033
- Table 67: North Africa Cervical Artificial Discs Revenue (million) Forecast, by Application 2020 & 2033
- Table 68: North Africa Cervical Artificial Discs Volume (K) Forecast, by Application 2020 & 2033
- Table 69: South Africa Cervical Artificial Discs Revenue (million) Forecast, by Application 2020 & 2033
- Table 70: South Africa Cervical Artificial Discs Volume (K) Forecast, by Application 2020 & 2033
- Table 71: Rest of Middle East & Africa Cervical Artificial Discs Revenue (million) Forecast, by Application 2020 & 2033
- Table 72: Rest of Middle East & Africa Cervical Artificial Discs Volume (K) Forecast, by Application 2020 & 2033
- Table 73: Global Cervical Artificial Discs Revenue million Forecast, by Application 2020 & 2033
- Table 74: Global Cervical Artificial Discs Volume K Forecast, by Application 2020 & 2033
- Table 75: Global Cervical Artificial Discs Revenue million Forecast, by Type 2020 & 2033
- Table 76: Global Cervical Artificial Discs Volume K Forecast, by Type 2020 & 2033
- Table 77: Global Cervical Artificial Discs Revenue million Forecast, by Country 2020 & 2033
- Table 78: Global Cervical Artificial Discs Volume K Forecast, by Country 2020 & 2033
- Table 79: China Cervical Artificial Discs Revenue (million) Forecast, by Application 2020 & 2033
- Table 80: China Cervical Artificial Discs Volume (K) Forecast, by Application 2020 & 2033
- Table 81: India Cervical Artificial Discs Revenue (million) Forecast, by Application 2020 & 2033
- Table 82: India Cervical Artificial Discs Volume (K) Forecast, by Application 2020 & 2033
- Table 83: Japan Cervical Artificial Discs Revenue (million) Forecast, by Application 2020 & 2033
- Table 84: Japan Cervical Artificial Discs Volume (K) Forecast, by Application 2020 & 2033
- Table 85: South Korea Cervical Artificial Discs Revenue (million) Forecast, by Application 2020 & 2033
- Table 86: South Korea Cervical Artificial Discs Volume (K) Forecast, by Application 2020 & 2033
- Table 87: ASEAN Cervical Artificial Discs Revenue (million) Forecast, by Application 2020 & 2033
- Table 88: ASEAN Cervical Artificial Discs Volume (K) Forecast, by Application 2020 & 2033
- Table 89: Oceania Cervical Artificial Discs Revenue (million) Forecast, by Application 2020 & 2033
- Table 90: Oceania Cervical Artificial Discs Volume (K) Forecast, by Application 2020 & 2033
- Table 91: Rest of Asia Pacific Cervical Artificial Discs Revenue (million) Forecast, by Application 2020 & 2033
- Table 92: Rest of Asia Pacific Cervical Artificial Discs Volume (K) Forecast, by Application 2020 & 2033
Frequently Asked Questions
1. What is the projected Compound Annual Growth Rate (CAGR) of the Cervical Artificial Discs?
The projected CAGR is approximately 11%.
2. Which companies are prominent players in the Cervical Artificial Discs?
Key companies in the market include DePuy Synthes, LDR Holdings, Medtronic, NuVasive, AxioMed, Globus Medical, Joimax, Orthofix, Spinal Kinetics, Vertebral Technologies.
3. What are the main segments of the Cervical Artificial Discs?
The market segments include Application, Type.
4. Can you provide details about the market size?
The market size is estimated to be USD 635 million as of 2022.
5. What are some drivers contributing to market growth?
N/A
6. What are the notable trends driving market growth?
N/A
7. Are there any restraints impacting market growth?
N/A
8. Can you provide examples of recent developments in the market?
N/A
9. What pricing options are available for accessing the report?
Pricing options include single-user, multi-user, and enterprise licenses priced at USD 3950.00, USD 5925.00, and USD 7900.00 respectively.
10. Is the market size provided in terms of value or volume?
The market size is provided in terms of value, measured in million and volume, measured in K.
11. Are there any specific market keywords associated with the report?
Yes, the market keyword associated with the report is "Cervical Artificial Discs," which aids in identifying and referencing the specific market segment covered.
12. How do I determine which pricing option suits my needs best?
The pricing options vary based on user requirements and access needs. Individual users may opt for single-user licenses, while businesses requiring broader access may choose multi-user or enterprise licenses for cost-effective access to the report.
13. Are there any additional resources or data provided in the Cervical Artificial Discs report?
While the report offers comprehensive insights, it's advisable to review the specific contents or supplementary materials provided to ascertain if additional resources or data are available.
14. How can I stay updated on further developments or reports in the Cervical Artificial Discs?
To stay informed about further developments, trends, and reports in the Cervical Artificial Discs, consider subscribing to industry newsletters, following relevant companies and organizations, or regularly checking reputable industry news sources and publications.
Methodology
Step 1 - Identification of Relevant Samples Size from Population Database


Step 2 - Approaches for Defining Global Market Size (Value, Volume* & Price*)

Note*: In applicable scenarios
Step 3 - Data Sources
Primary Research
- Web Analytics
- Survey Reports
- Research Institute
- Latest Research Reports
- Opinion Leaders
Secondary Research
- Annual Reports
- White Paper
- Latest Press Release
- Industry Association
- Paid Database
- Investor Presentations

Step 4 - Data Triangulation
Involves using different sources of information in order to increase the validity of a study
These sources are likely to be stakeholders in a program - participants, other researchers, program staff, other community members, and so on.
Then we put all data in single framework & apply various statistical tools to find out the dynamic on the market.
During the analysis stage, feedback from the stakeholder groups would be compared to determine areas of agreement as well as areas of divergence