

Key Insights
The global Elastography Imaging market is projected to reach $12.13 billion by 2025, exhibiting a robust CAGR of 9.05% over the forecast period. This significant growth is driven by the increasing demand for non-invasive diagnostic techniques, advancements in medical imaging technology, and a growing awareness of elastography's superior diagnostic capabilities compared to conventional methods. The ability of elastography to assess tissue stiffness, which is crucial for diagnosing and staging various diseases like liver fibrosis, breast cancer, and prostate cancer, underpins its expanding adoption across diverse medical specialties. Furthermore, the increasing prevalence of chronic diseases and the aging global population are contributing to a higher demand for accurate and early disease detection, positioning elastography as a pivotal tool in modern healthcare. The market is witnessing a surge in research and development activities focused on enhancing image quality, improving workflow efficiency, and expanding the application spectrum of elastography technologies.
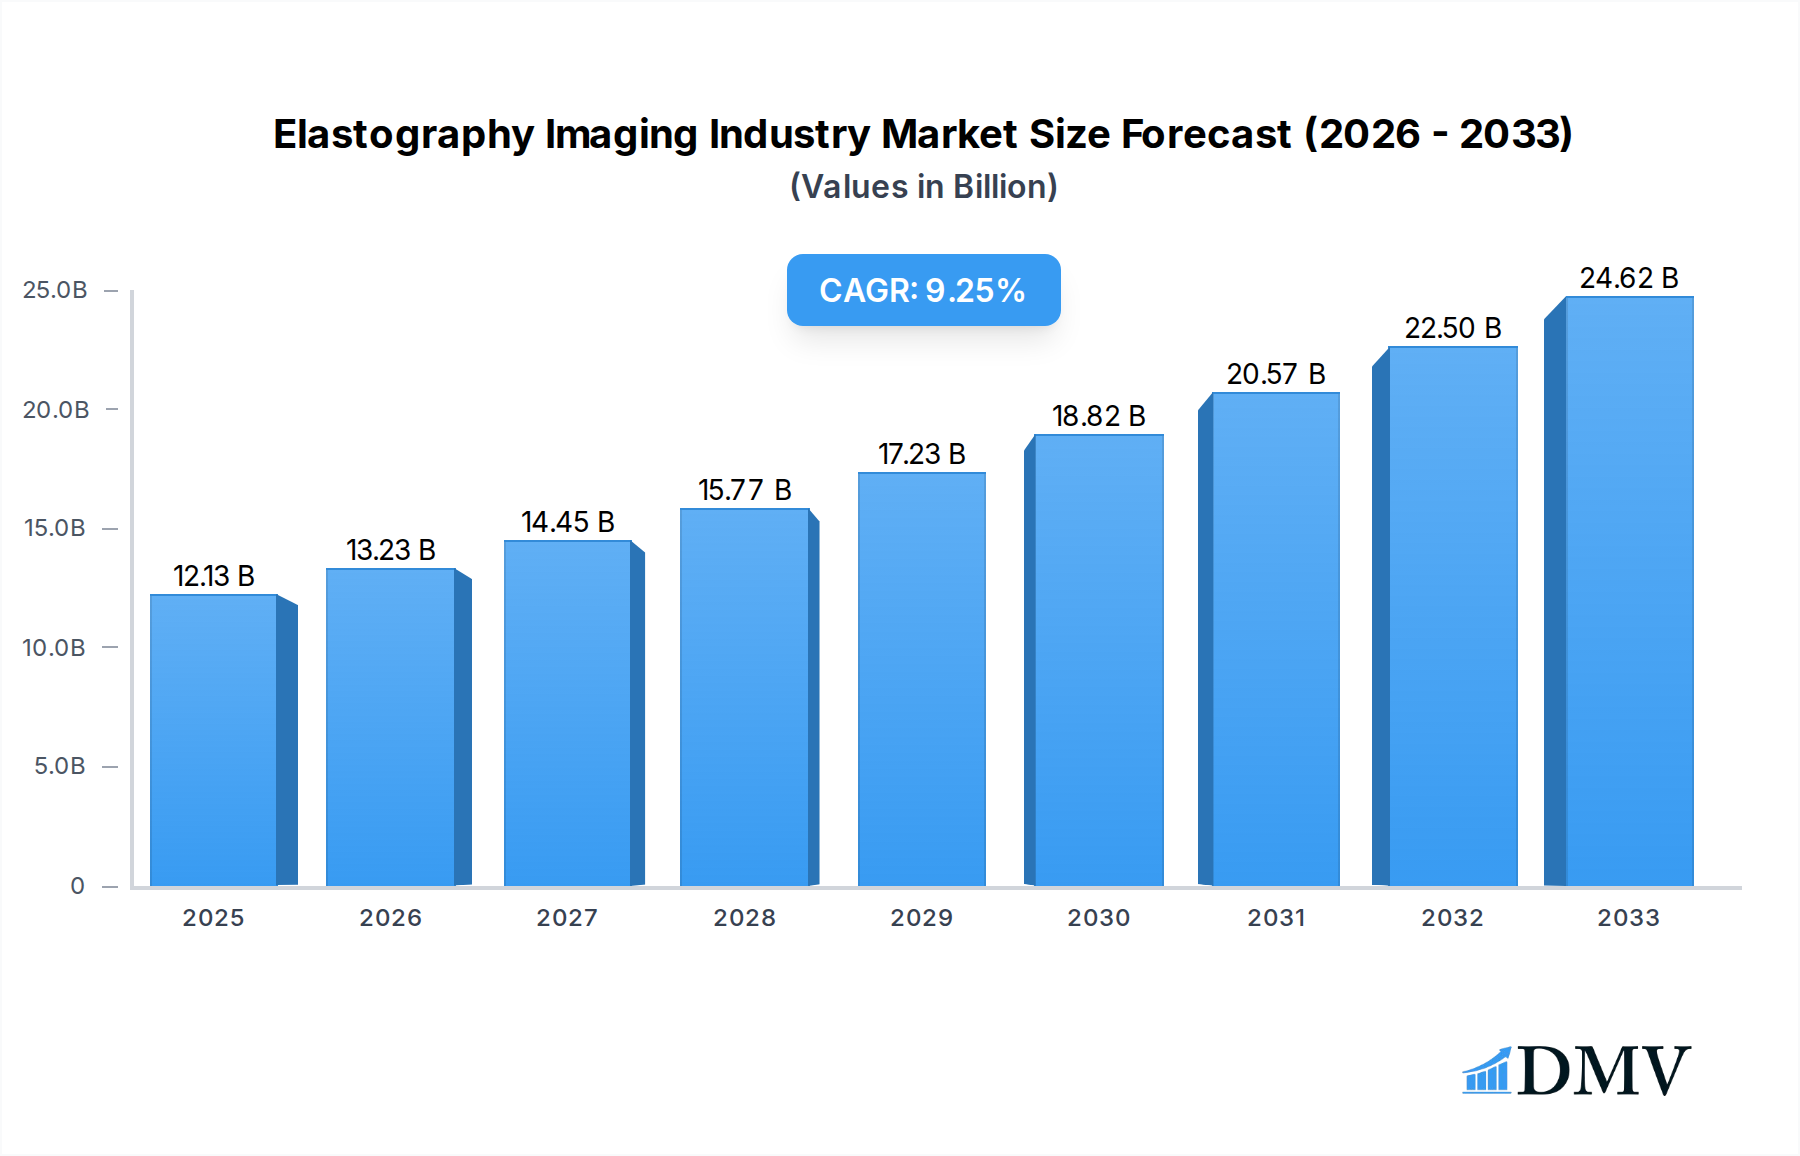
Elastography Imaging Industry Market Size (In Billion)
The market is segmented across various modalities, including Ultrasound Elastography and Magnetic Resonance Elastography, with Ultrasound Elastography holding a dominant share due to its cost-effectiveness and widespread availability. Key applications driving market expansion include Cardiology, Radiology, Urology, Vascular, and Obstetrics/Gynecology, reflecting the broad utility of elastography in diagnosing a spectrum of conditions. Hospitals and diagnostic centers are the primary end-users, investing in these advanced imaging solutions to improve patient outcomes and diagnostic accuracy. Geographically, North America and Europe are expected to lead the market, owing to well-established healthcare infrastructure, high adoption rates of advanced medical technologies, and significant investments in healthcare R&D. However, the Asia Pacific region is poised for rapid growth, fueled by expanding healthcare access, increasing disposable incomes, and a rising burden of target diseases. Emerging economies are also expected to contribute significantly as awareness and adoption of elastography technologies grow.

Elastography Imaging Industry Company Market Share
Elastography Imaging Industry Market Composition & Trends
The global Elastography Imaging market is poised for significant expansion, driven by advancements in medical imaging technology and an increasing demand for non-invasive diagnostic tools. Market concentration currently features key players such as GE Healthcare, Koninklijke Philips N.V., and Siemens AG, alongside innovative companies like Resoundant Inc. and Supersonic Imagine. The market's innovation catalysts are primarily rooted in the development of higher resolution imaging, faster acquisition times, and improved quantification of tissue stiffness. Regulatory landscapes, while generally supportive of technological advancements, can also present hurdles in terms of approval processes for novel elastography techniques. Substitute products, primarily traditional biopsy methods, are steadily being displaced by the accuracy and patient comfort offered by elastography. End-user profiles are diverse, encompassing major hospitals, specialized surgical and diagnostic centers, and burgeoning ambulatory surgical centers. Merger and acquisition (M&A) activities, while not at peak levels, are strategic, focusing on consolidating market share and acquiring intellectual property. The estimated M&A deal value for the period 2019-2024 is projected to be in the range of $500 million to $1.5 billion, with a notable surge anticipated in the forecast period.
- Market Share Distribution: While precise figures vary, top-tier companies like GE Healthcare and Philips command a substantial portion of the market, estimated between 20-30% each.
- Innovation Catalysts: Real-time Tissue Elastography (RTE), Shear Wave Elastography (SWE), and Magnetic Resonance Elastography (MRE) advancements are key drivers.
- End-User Adoption: Increasing integration of elastography into routine clinical workflows across various specialties.
- M&A Focus: Acquisition of emerging elastography technologies and companies with strong patent portfolios.
Elastography Imaging Industry Industry Evolution
The Elastography Imaging industry has undergone a remarkable transformation, evolving from niche applications to mainstream diagnostic modalities. Over the historical period of 2019–2024, the market witnessed a Compound Annual Growth Rate (CAGR) of approximately 8.5%, propelled by increasing awareness of its diagnostic capabilities and a growing preference for non-invasive procedures. The base year of 2025 marks a pivotal point, with projections indicating a sustained CAGR of 9.2% through 2033. This robust growth trajectory is fueled by continuous technological innovation, expanding clinical applications, and a rising prevalence of chronic diseases requiring advanced imaging for diagnosis and monitoring. Initially, ultrasound elastography dominated the market due to its accessibility and cost-effectiveness. However, Magnetic Resonance Elastography (MRE) has been steadily gaining traction, offering deeper tissue penetration and higher contrast for certain applications, particularly in liver fibrosis assessment. The evolution of algorithms for real-time image processing and quantitative stiffness measurements has significantly enhanced the diagnostic accuracy and clinical utility of elastography. Shifting consumer demands, driven by patient preference for less invasive diagnostic routes and shorter recovery times compared to traditional biopsies, have also played a crucial role in market expansion. Furthermore, increased healthcare spending globally and a focus on early disease detection have created a fertile ground for the widespread adoption of elastography systems. The market has also benefited from strategic collaborations between technology providers and research institutions, fostering the development of novel applications and refining existing ones. The increasing integration of Artificial Intelligence (AI) and machine learning into elastography platforms promises further enhancements in image interpretation and diagnostic efficiency, solidifying its position as an indispensable tool in modern healthcare. The projected market size for 2025 is estimated at $3.2 billion, with an anticipated rise to over $6.5 billion by 2033, reflecting sustained market dynamism and innovation.
Leading Regions, Countries, or Segments in Elastography Imaging Industry
North America, particularly the United States, currently stands as the dominant region in the Elastography Imaging market, driven by a confluence of factors including high healthcare expenditure, advanced technological adoption, and a strong regulatory framework that encourages innovation. The US accounts for an estimated 35% of the global market share, with Canada also contributing significantly. Key segments fueling this dominance include Radiology and Cardiology applications, where the non-invasive nature of elastography offers substantial advantages over traditional methods. The widespread integration of Ultrasound Elastography, especially for liver fibrosis assessment, and the growing adoption of Magnetic Resonance Elastography (MRE) for neurological and abdominal imaging have cemented North America's leadership.
- Key Drivers in North America:
- High Reimbursement Rates: Favorable reimbursement policies for advanced imaging procedures.
- Technological Infrastructure: Extensive presence of cutting-edge healthcare facilities and research institutions.
- Awareness and Education: High physician and patient awareness regarding the benefits of elastography.
- Investment in R&D: Significant investment in research and development of new elastography technologies.
Europe is a close second, with Germany, the UK, and France leading the charge. The European market is characterized by a strong emphasis on early disease detection and preventative healthcare. Stringent regulatory standards, while sometimes a challenge, also drive the development of highly accurate and reliable elastography solutions. The adoption of Ultrasound Elastography for a wide range of applications, including breast imaging, thyroid nodule assessment, and liver disease diagnosis, is particularly robust.
Asia Pacific is emerging as the fastest-growing region, propelled by rapid economic development, expanding healthcare infrastructure, and a burgeoning population with a rising incidence of chronic diseases. Countries like China, Japan, and South Korea are investing heavily in advanced medical technologies, including elastography. The increasing affordability of elastography systems and the growing number of trained medical professionals are further accelerating market penetration in this region. The focus here is shifting towards integrating elastography across various specialties, including Obstetrics/Gynecology and Urology, alongside established applications in Radiology.
In terms of modality, Ultrasound Elastography is the most prevalent, accounting for approximately 75% of the market share due to its portability, cost-effectiveness, and versatility. Magnetic Resonance Elastography (MRE), while currently holding a smaller share, is experiencing a higher growth rate and is expected to capture a significant portion of the market in specialized applications. Among end-users, Hospitals remain the largest segment, driven by the comprehensive diagnostic needs of inpatient and outpatient populations. However, Ambulatory Surgical Centers and Surgical & Diagnostic Centers are demonstrating faster growth rates, reflecting a trend towards outpatient procedures and decentralized healthcare delivery.
Elastography Imaging Industry Product Innovations
The Elastography Imaging industry is experiencing a wave of transformative product innovations focused on enhancing diagnostic accuracy and patient outcomes. Companies are developing advanced ultrasound systems that incorporate sophisticated real-time tissue elastography (RTE) and shear wave measurement (SWM) capabilities, allowing for color-coding and precise quantification of tissue stiffness. Magnetic Resonance Elastography (MRE) is also seeing significant advancements, offering non-invasive assessment of tissue stiffness in deep organs with unprecedented resolution. These innovations are critical for improved diagnoses of hepatic diseases like fibrosis and cirrhosis, as highlighted by Fujifilm Healthcare Europe's Arietta series. Furthermore, the integration of AI-powered algorithms is leading to automated analysis and predictive modeling, reducing interpretation variability and accelerating diagnosis. The introduction of high-frequency ultrasound probes and advanced transducer technologies is enabling visualization of finer tissue structures, expanding the diagnostic utility of elastography across a broader spectrum of medical conditions.
Propelling Factors for Elastography Imaging Industry Growth
The Elastography Imaging industry's growth is propelled by several key factors. Technologically, continuous advancements in ultrasound and MRI technologies, leading to higher resolution, faster acquisition, and improved quantitative accuracy, are paramount. Economically, increasing global healthcare expenditure and a growing demand for non-invasive diagnostic methods are driving market expansion. Regulatory support for innovative medical devices and the rising prevalence of chronic diseases such as liver fibrosis, cancer, and cardiovascular conditions requiring precise diagnostic tools further fuel adoption. The increasing awareness among healthcare professionals and patients about the benefits of elastography over traditional invasive procedures also significantly contributes to its market ascent.
Obstacles in the Elastography Imaging Industry Market
Despite its promising growth, the Elastography Imaging industry faces several obstacles. Regulatory challenges, including lengthy approval processes for new technologies and variations in regional guidelines, can slow down market entry. The high initial cost of advanced elastography systems can be a barrier for smaller healthcare facilities in resource-constrained regions. Furthermore, a shortage of skilled professionals trained in operating and interpreting elastography data can hinder widespread adoption. Supply chain disruptions for critical components and the competitive pressure from established imaging modalities, while diminishing, still pose a challenge.
Future Opportunities in Elastography Imaging Industry
Emerging opportunities in the Elastography Imaging industry are vast. The development of miniaturized and portable elastography devices presents a significant opportunity for point-of-care diagnostics and remote patient monitoring. The integration of Artificial Intelligence (AI) and machine learning for automated image analysis and predictive diagnostics will unlock new levels of efficiency and accuracy. Expanding applications into less-explored areas like musculoskeletal imaging and neurological disorders offers substantial market potential. Furthermore, the increasing adoption of AI-driven elastography in emerging economies, coupled with a growing demand for personalized medicine, will pave the way for innovative solutions and market penetration.
Major Players in the Elastography Imaging Industry Ecosystem
- Esaote SpA
- Hologic Inc
- GE Healthcare
- Resoundant Inc
- Koninklijke Philips N V
- Mindray Medical International Limited
- Siemens AG
- Canon Medical Systems Corporation
- Samsung Medison
- Supersonic Imagine
- Fujifilm Holdings Corporation
Key Developments in Elastography Imaging Industry Industry
- November 2022: PENTAX Medical launched its new Performance Endoscopic Ultrasound (EUS) system in Canada. The system comprises the ARIETTA 65 PX ultrasound scanner and J10 Series Ultrasound Gastroscopes, offering high image quality, real-time tissue elastography, and improved therapeutic access.
- May 2022: Mindray launched Resona I9 Advanced Technologies, featuring HiFR Sound Touch Elastography, enabling smoother transition times and faster refresh rates for more consistent acquisition and assessment in live 2D shear wave imaging.
- March 2022: Fujifilm Healthcare Europe introduced the Arietta ultrasound series, including Arietta 850 DeepInsight and Arietta 650 DeepInsight. These models support comprehensive diagnoses of hepatic diseases using Real-time Tissue Elastography (RTE) and Shear Wave Measurement (SWM) for quantifying tissue stiffness.
Strategic Elastography Imaging Industry Market Forecast
The Elastography Imaging industry market is projected for robust growth, driven by strategic advancements and a clear demand for non-invasive diagnostic solutions. The forecast period (2025–2033) anticipates continued innovation in modalities like ultrasound and MRE, with an increasing emphasis on AI integration for enhanced diagnostic capabilities and workflow efficiency. Expanding clinical applications across cardiology, radiology, urology, and obstetrics/gynecology will broaden the market reach. Favorable economic trends, including rising healthcare investments globally, and a sustained focus on preventative medicine will further propel adoption. The market's future potential lies in its ability to offer more accurate, patient-friendly, and cost-effective diagnostic alternatives to traditional invasive procedures, solidifying its indispensable role in modern healthcare.
Elastography Imaging Industry Segmentation
-
1. Modality
- 1.1. Utrasound Elastography
- 1.2. Magnetic Resonance Elastography
-
2. Application
- 2.1. Cardiology
- 2.2. Radiology
- 2.3. Urology
- 2.4. Vascular
- 2.5. Obstetrics/Gynecology
- 2.6. Other Ap
-
3. End-User
- 3.1. Hospitals
- 3.2. Ambulatory Surgical Centers
- 3.3. Surgical & Diagnostic centers
Elastography Imaging Industry Segmentation By Geography
-
1. North America
- 1.1. United States
- 1.2. Canada
- 1.3. Mexico
-
2. Europe
- 2.1. Germany
- 2.2. United Kingdom
- 2.3. France
- 2.4. Italy
- 2.5. Spain
- 2.6. Rest of Europe
-
3. Asia Pacific
- 3.1. China
- 3.2. Japan
- 3.3. India
- 3.4. Australia
- 3.5. South Korea
- 3.6. Rest of Asia Pacific
-
4. Middle East and Africa
- 4.1. GCC
- 4.2. South Africa
- 4.3. Rest of Middle East and Africa
-
5. South America
- 5.1. Brazil
- 5.2. Argentina
- 5.3. Rest of South America

Elastography Imaging Industry Regional Market Share
Geographic Coverage of Elastography Imaging Industry
Elastography Imaging Industry REPORT HIGHLIGHTS
| Aspects | Details |
|---|---|
| Study Period | 2020-2034 |
| Base Year | 2025 |
| Estimated Year | 2026 |
| Forecast Period | 2026-2034 |
| Historical Period | 2020-2025 |
| Growth Rate | CAGR of 9.05% from 2020-2034 |
| Segmentation |
|
Table of Contents
- 1. Introduction
- 1.1. Research Scope
- 1.2. Market Segmentation
- 1.3. Research Objective
- 1.4. Definitions and Assumptions
- 2. Executive Summary
- 2.1. Market Snapshot
- 3. Market Dynamics
- 3.1. Market Drivers
- 3.2. Market Restrains
- 3.3. Market Trends
- 3.4. Market Opportunities
- 4. Market Factor Analysis
- 4.1. Porters Five Forces
- 4.1.1. Bargaining Power of Suppliers
- 4.1.2. Bargaining Power of Buyers
- 4.1.3. Threat of New Entrants
- 4.1.4. Threat of Substitutes
- 4.1.5. Competitive Rivalry
- 4.2. PESTEL analysis
- 4.3. BCG Analysis
- 4.3.1. Stars (High Growth, High Market Share)
- 4.3.2. Cash Cows (Low Growth, High Market Share)
- 4.3.3. Question Mark (High Growth, Low Market Share)
- 4.3.4. Dogs (Low Growth, Low Market Share)
- 4.4. Ansoff Matrix Analysis
- 4.5. Supply Chain Analysis
- 4.6. Regulatory Landscape
- 4.7. Current Market Potential and Opportunity Assessment (TAM–SAM–SOM Framework)
- 4.8. DMV Analyst Note
- 4.1. Porters Five Forces
- 5. Market Analysis, Insights and Forecast 2021-2033
- 5.1. Market Analysis, Insights and Forecast - by Modality
- 5.1.1. Utrasound Elastography
- 5.1.2. Magnetic Resonance Elastography
- 5.2. Market Analysis, Insights and Forecast - by Application
- 5.2.1. Cardiology
- 5.2.2. Radiology
- 5.2.3. Urology
- 5.2.4. Vascular
- 5.2.5. Obstetrics/Gynecology
- 5.2.6. Other Ap
- 5.3. Market Analysis, Insights and Forecast - by End-User
- 5.3.1. Hospitals
- 5.3.2. Ambulatory Surgical Centers
- 5.3.3. Surgical & Diagnostic centers
- 5.4. Market Analysis, Insights and Forecast - by Region
- 5.4.1. North America
- 5.4.2. Europe
- 5.4.3. Asia Pacific
- 5.4.4. Middle East and Africa
- 5.4.5. South America
- 5.1. Market Analysis, Insights and Forecast - by Modality
- 6. Global Elastography Imaging Industry Analysis, Insights and Forecast, 2021-2033
- 6.1. Market Analysis, Insights and Forecast - by Modality
- 6.1.1. Utrasound Elastography
- 6.1.2. Magnetic Resonance Elastography
- 6.2. Market Analysis, Insights and Forecast - by Application
- 6.2.1. Cardiology
- 6.2.2. Radiology
- 6.2.3. Urology
- 6.2.4. Vascular
- 6.2.5. Obstetrics/Gynecology
- 6.2.6. Other Ap
- 6.3. Market Analysis, Insights and Forecast - by End-User
- 6.3.1. Hospitals
- 6.3.2. Ambulatory Surgical Centers
- 6.3.3. Surgical & Diagnostic centers
- 6.1. Market Analysis, Insights and Forecast - by Modality
- 7. North America Elastography Imaging Industry Analysis, Insights and Forecast, 2020-2032
- 7.1. Market Analysis, Insights and Forecast - by Modality
- 7.1.1. Utrasound Elastography
- 7.1.2. Magnetic Resonance Elastography
- 7.2. Market Analysis, Insights and Forecast - by Application
- 7.2.1. Cardiology
- 7.2.2. Radiology
- 7.2.3. Urology
- 7.2.4. Vascular
- 7.2.5. Obstetrics/Gynecology
- 7.2.6. Other Ap
- 7.3. Market Analysis, Insights and Forecast - by End-User
- 7.3.1. Hospitals
- 7.3.2. Ambulatory Surgical Centers
- 7.3.3. Surgical & Diagnostic centers
- 7.1. Market Analysis, Insights and Forecast - by Modality
- 8. Europe Elastography Imaging Industry Analysis, Insights and Forecast, 2020-2032
- 8.1. Market Analysis, Insights and Forecast - by Modality
- 8.1.1. Utrasound Elastography
- 8.1.2. Magnetic Resonance Elastography
- 8.2. Market Analysis, Insights and Forecast - by Application
- 8.2.1. Cardiology
- 8.2.2. Radiology
- 8.2.3. Urology
- 8.2.4. Vascular
- 8.2.5. Obstetrics/Gynecology
- 8.2.6. Other Ap
- 8.3. Market Analysis, Insights and Forecast - by End-User
- 8.3.1. Hospitals
- 8.3.2. Ambulatory Surgical Centers
- 8.3.3. Surgical & Diagnostic centers
- 8.1. Market Analysis, Insights and Forecast - by Modality
- 9. Asia Pacific Elastography Imaging Industry Analysis, Insights and Forecast, 2020-2032
- 9.1. Market Analysis, Insights and Forecast - by Modality
- 9.1.1. Utrasound Elastography
- 9.1.2. Magnetic Resonance Elastography
- 9.2. Market Analysis, Insights and Forecast - by Application
- 9.2.1. Cardiology
- 9.2.2. Radiology
- 9.2.3. Urology
- 9.2.4. Vascular
- 9.2.5. Obstetrics/Gynecology
- 9.2.6. Other Ap
- 9.3. Market Analysis, Insights and Forecast - by End-User
- 9.3.1. Hospitals
- 9.3.2. Ambulatory Surgical Centers
- 9.3.3. Surgical & Diagnostic centers
- 9.1. Market Analysis, Insights and Forecast - by Modality
- 10. Middle East and Africa Elastography Imaging Industry Analysis, Insights and Forecast, 2020-2032
- 10.1. Market Analysis, Insights and Forecast - by Modality
- 10.1.1. Utrasound Elastography
- 10.1.2. Magnetic Resonance Elastography
- 10.2. Market Analysis, Insights and Forecast - by Application
- 10.2.1. Cardiology
- 10.2.2. Radiology
- 10.2.3. Urology
- 10.2.4. Vascular
- 10.2.5. Obstetrics/Gynecology
- 10.2.6. Other Ap
- 10.3. Market Analysis, Insights and Forecast - by End-User
- 10.3.1. Hospitals
- 10.3.2. Ambulatory Surgical Centers
- 10.3.3. Surgical & Diagnostic centers
- 10.1. Market Analysis, Insights and Forecast - by Modality
- 11. South America Elastography Imaging Industry Analysis, Insights and Forecast, 2020-2032
- 11.1. Market Analysis, Insights and Forecast - by Modality
- 11.1.1. Utrasound Elastography
- 11.1.2. Magnetic Resonance Elastography
- 11.2. Market Analysis, Insights and Forecast - by Application
- 11.2.1. Cardiology
- 11.2.2. Radiology
- 11.2.3. Urology
- 11.2.4. Vascular
- 11.2.5. Obstetrics/Gynecology
- 11.2.6. Other Ap
- 11.3. Market Analysis, Insights and Forecast - by End-User
- 11.3.1. Hospitals
- 11.3.2. Ambulatory Surgical Centers
- 11.3.3. Surgical & Diagnostic centers
- 11.1. Market Analysis, Insights and Forecast - by Modality
- 12. Competitive Analysis
- 12.1. Company Profiles
- 12.1.1 Esaote SpA
- 12.1.1.1. Company Overview
- 12.1.1.2. Products
- 12.1.1.3. Company Financials
- 12.1.1.4. SWOT Analysis
- 12.1.2 Hologic Inc
- 12.1.2.1. Company Overview
- 12.1.2.2. Products
- 12.1.2.3. Company Financials
- 12.1.2.4. SWOT Analysis
- 12.1.3 GE Healthcare
- 12.1.3.1. Company Overview
- 12.1.3.2. Products
- 12.1.3.3. Company Financials
- 12.1.3.4. SWOT Analysis
- 12.1.4 Resoundant Inc
- 12.1.4.1. Company Overview
- 12.1.4.2. Products
- 12.1.4.3. Company Financials
- 12.1.4.4. SWOT Analysis
- 12.1.5 Koninklijke Philips N V
- 12.1.5.1. Company Overview
- 12.1.5.2. Products
- 12.1.5.3. Company Financials
- 12.1.5.4. SWOT Analysis
- 12.1.6 Mindray Medical International Limited
- 12.1.6.1. Company Overview
- 12.1.6.2. Products
- 12.1.6.3. Company Financials
- 12.1.6.4. SWOT Analysis
- 12.1.7 Siemens AG*List Not Exhaustive
- 12.1.7.1. Company Overview
- 12.1.7.2. Products
- 12.1.7.3. Company Financials
- 12.1.7.4. SWOT Analysis
- 12.1.8 Canon Medical Systems Corporation
- 12.1.8.1. Company Overview
- 12.1.8.2. Products
- 12.1.8.3. Company Financials
- 12.1.8.4. SWOT Analysis
- 12.1.9 Samsung Medison
- 12.1.9.1. Company Overview
- 12.1.9.2. Products
- 12.1.9.3. Company Financials
- 12.1.9.4. SWOT Analysis
- 12.1.10 Supersonic Imagine
- 12.1.10.1. Company Overview
- 12.1.10.2. Products
- 12.1.10.3. Company Financials
- 12.1.10.4. SWOT Analysis
- 12.1.11 Fujifilm Holdings Corporation
- 12.1.11.1. Company Overview
- 12.1.11.2. Products
- 12.1.11.3. Company Financials
- 12.1.11.4. SWOT Analysis
- 12.1.1 Esaote SpA
- 12.2. Market Entropy
- 12.2.1 Company's Key Areas Served
- 12.2.2 Recent Developments
- 12.3. Company Market Share Analysis 2025
- 12.3.1 Top 5 Companies Market Share Analysis
- 12.3.2 Top 3 Companies Market Share Analysis
- 12.4. List of Potential Customers
- 13. Research Methodology
List of Figures
- Figure 1: Global Elastography Imaging Industry Revenue Breakdown (billion, %) by Region 2025 & 2033
- Figure 2: North America Elastography Imaging Industry Revenue (billion), by Modality 2025 & 2033
- Figure 3: North America Elastography Imaging Industry Revenue Share (%), by Modality 2025 & 2033
- Figure 4: North America Elastography Imaging Industry Revenue (billion), by Application 2025 & 2033
- Figure 5: North America Elastography Imaging Industry Revenue Share (%), by Application 2025 & 2033
- Figure 6: North America Elastography Imaging Industry Revenue (billion), by End-User 2025 & 2033
- Figure 7: North America Elastography Imaging Industry Revenue Share (%), by End-User 2025 & 2033
- Figure 8: North America Elastography Imaging Industry Revenue (billion), by Country 2025 & 2033
- Figure 9: North America Elastography Imaging Industry Revenue Share (%), by Country 2025 & 2033
- Figure 10: Europe Elastography Imaging Industry Revenue (billion), by Modality 2025 & 2033
- Figure 11: Europe Elastography Imaging Industry Revenue Share (%), by Modality 2025 & 2033
- Figure 12: Europe Elastography Imaging Industry Revenue (billion), by Application 2025 & 2033
- Figure 13: Europe Elastography Imaging Industry Revenue Share (%), by Application 2025 & 2033
- Figure 14: Europe Elastography Imaging Industry Revenue (billion), by End-User 2025 & 2033
- Figure 15: Europe Elastography Imaging Industry Revenue Share (%), by End-User 2025 & 2033
- Figure 16: Europe Elastography Imaging Industry Revenue (billion), by Country 2025 & 2033
- Figure 17: Europe Elastography Imaging Industry Revenue Share (%), by Country 2025 & 2033
- Figure 18: Asia Pacific Elastography Imaging Industry Revenue (billion), by Modality 2025 & 2033
- Figure 19: Asia Pacific Elastography Imaging Industry Revenue Share (%), by Modality 2025 & 2033
- Figure 20: Asia Pacific Elastography Imaging Industry Revenue (billion), by Application 2025 & 2033
- Figure 21: Asia Pacific Elastography Imaging Industry Revenue Share (%), by Application 2025 & 2033
- Figure 22: Asia Pacific Elastography Imaging Industry Revenue (billion), by End-User 2025 & 2033
- Figure 23: Asia Pacific Elastography Imaging Industry Revenue Share (%), by End-User 2025 & 2033
- Figure 24: Asia Pacific Elastography Imaging Industry Revenue (billion), by Country 2025 & 2033
- Figure 25: Asia Pacific Elastography Imaging Industry Revenue Share (%), by Country 2025 & 2033
- Figure 26: Middle East and Africa Elastography Imaging Industry Revenue (billion), by Modality 2025 & 2033
- Figure 27: Middle East and Africa Elastography Imaging Industry Revenue Share (%), by Modality 2025 & 2033
- Figure 28: Middle East and Africa Elastography Imaging Industry Revenue (billion), by Application 2025 & 2033
- Figure 29: Middle East and Africa Elastography Imaging Industry Revenue Share (%), by Application 2025 & 2033
- Figure 30: Middle East and Africa Elastography Imaging Industry Revenue (billion), by End-User 2025 & 2033
- Figure 31: Middle East and Africa Elastography Imaging Industry Revenue Share (%), by End-User 2025 & 2033
- Figure 32: Middle East and Africa Elastography Imaging Industry Revenue (billion), by Country 2025 & 2033
- Figure 33: Middle East and Africa Elastography Imaging Industry Revenue Share (%), by Country 2025 & 2033
- Figure 34: South America Elastography Imaging Industry Revenue (billion), by Modality 2025 & 2033
- Figure 35: South America Elastography Imaging Industry Revenue Share (%), by Modality 2025 & 2033
- Figure 36: South America Elastography Imaging Industry Revenue (billion), by Application 2025 & 2033
- Figure 37: South America Elastography Imaging Industry Revenue Share (%), by Application 2025 & 2033
- Figure 38: South America Elastography Imaging Industry Revenue (billion), by End-User 2025 & 2033
- Figure 39: South America Elastography Imaging Industry Revenue Share (%), by End-User 2025 & 2033
- Figure 40: South America Elastography Imaging Industry Revenue (billion), by Country 2025 & 2033
- Figure 41: South America Elastography Imaging Industry Revenue Share (%), by Country 2025 & 2033
List of Tables
- Table 1: Global Elastography Imaging Industry Revenue billion Forecast, by Modality 2020 & 2033
- Table 2: Global Elastography Imaging Industry Revenue billion Forecast, by Application 2020 & 2033
- Table 3: Global Elastography Imaging Industry Revenue billion Forecast, by End-User 2020 & 2033
- Table 4: Global Elastography Imaging Industry Revenue billion Forecast, by Region 2020 & 2033
- Table 5: Global Elastography Imaging Industry Revenue billion Forecast, by Modality 2020 & 2033
- Table 6: Global Elastography Imaging Industry Revenue billion Forecast, by Application 2020 & 2033
- Table 7: Global Elastography Imaging Industry Revenue billion Forecast, by End-User 2020 & 2033
- Table 8: Global Elastography Imaging Industry Revenue billion Forecast, by Country 2020 & 2033
- Table 9: United States Elastography Imaging Industry Revenue (billion) Forecast, by Application 2020 & 2033
- Table 10: Canada Elastography Imaging Industry Revenue (billion) Forecast, by Application 2020 & 2033
- Table 11: Mexico Elastography Imaging Industry Revenue (billion) Forecast, by Application 2020 & 2033
- Table 12: Global Elastography Imaging Industry Revenue billion Forecast, by Modality 2020 & 2033
- Table 13: Global Elastography Imaging Industry Revenue billion Forecast, by Application 2020 & 2033
- Table 14: Global Elastography Imaging Industry Revenue billion Forecast, by End-User 2020 & 2033
- Table 15: Global Elastography Imaging Industry Revenue billion Forecast, by Country 2020 & 2033
- Table 16: Germany Elastography Imaging Industry Revenue (billion) Forecast, by Application 2020 & 2033
- Table 17: United Kingdom Elastography Imaging Industry Revenue (billion) Forecast, by Application 2020 & 2033
- Table 18: France Elastography Imaging Industry Revenue (billion) Forecast, by Application 2020 & 2033
- Table 19: Italy Elastography Imaging Industry Revenue (billion) Forecast, by Application 2020 & 2033
- Table 20: Spain Elastography Imaging Industry Revenue (billion) Forecast, by Application 2020 & 2033
- Table 21: Rest of Europe Elastography Imaging Industry Revenue (billion) Forecast, by Application 2020 & 2033
- Table 22: Global Elastography Imaging Industry Revenue billion Forecast, by Modality 2020 & 2033
- Table 23: Global Elastography Imaging Industry Revenue billion Forecast, by Application 2020 & 2033
- Table 24: Global Elastography Imaging Industry Revenue billion Forecast, by End-User 2020 & 2033
- Table 25: Global Elastography Imaging Industry Revenue billion Forecast, by Country 2020 & 2033
- Table 26: China Elastography Imaging Industry Revenue (billion) Forecast, by Application 2020 & 2033
- Table 27: Japan Elastography Imaging Industry Revenue (billion) Forecast, by Application 2020 & 2033
- Table 28: India Elastography Imaging Industry Revenue (billion) Forecast, by Application 2020 & 2033
- Table 29: Australia Elastography Imaging Industry Revenue (billion) Forecast, by Application 2020 & 2033
- Table 30: South Korea Elastography Imaging Industry Revenue (billion) Forecast, by Application 2020 & 2033
- Table 31: Rest of Asia Pacific Elastography Imaging Industry Revenue (billion) Forecast, by Application 2020 & 2033
- Table 32: Global Elastography Imaging Industry Revenue billion Forecast, by Modality 2020 & 2033
- Table 33: Global Elastography Imaging Industry Revenue billion Forecast, by Application 2020 & 2033
- Table 34: Global Elastography Imaging Industry Revenue billion Forecast, by End-User 2020 & 2033
- Table 35: Global Elastography Imaging Industry Revenue billion Forecast, by Country 2020 & 2033
- Table 36: GCC Elastography Imaging Industry Revenue (billion) Forecast, by Application 2020 & 2033
- Table 37: South Africa Elastography Imaging Industry Revenue (billion) Forecast, by Application 2020 & 2033
- Table 38: Rest of Middle East and Africa Elastography Imaging Industry Revenue (billion) Forecast, by Application 2020 & 2033
- Table 39: Global Elastography Imaging Industry Revenue billion Forecast, by Modality 2020 & 2033
- Table 40: Global Elastography Imaging Industry Revenue billion Forecast, by Application 2020 & 2033
- Table 41: Global Elastography Imaging Industry Revenue billion Forecast, by End-User 2020 & 2033
- Table 42: Global Elastography Imaging Industry Revenue billion Forecast, by Country 2020 & 2033
- Table 43: Brazil Elastography Imaging Industry Revenue (billion) Forecast, by Application 2020 & 2033
- Table 44: Argentina Elastography Imaging Industry Revenue (billion) Forecast, by Application 2020 & 2033
- Table 45: Rest of South America Elastography Imaging Industry Revenue (billion) Forecast, by Application 2020 & 2033
Frequently Asked Questions
1. What is the projected Compound Annual Growth Rate (CAGR) of the Elastography Imaging Industry?
The projected CAGR is approximately 9.05%.
2. Which companies are prominent players in the Elastography Imaging Industry?
Key companies in the market include Esaote SpA, Hologic Inc, GE Healthcare, Resoundant Inc, Koninklijke Philips N V, Mindray Medical International Limited, Siemens AG*List Not Exhaustive, Canon Medical Systems Corporation, Samsung Medison, Supersonic Imagine, Fujifilm Holdings Corporation.
3. What are the main segments of the Elastography Imaging Industry?
The market segments include Modality, Application, End-User.
4. Can you provide details about the market size?
The market size is estimated to be USD 12.13 billion as of 2022.
5. What are some drivers contributing to market growth?
Rising Incidence of Chronic Ailments and Breast Cancer; Growing Demand for Minimally Invasive Surgeries.
6. What are the notable trends driving market growth?
Ultrasound Modality Segment Expects to Register a High CAGR in the Forecast Period.
7. Are there any restraints impacting market growth?
Adverse Scenario of Reimbursement; High Price of Imaging Devices for Elastography.
8. Can you provide examples of recent developments in the market?
November 2022: PENTAX Medical launched its new Performance Endoscopic Ultrasound (EUS) system in Canada. The system consists of a combination of its new ARIETTA 65 PX ultrasound scanner and its best-in-class J10 Series Ultrasound Gastroscopes. The J10 Series Ultrasound Gastroscope and ARIETTA 65 PX offer high image quality, real-time tissue elastography, and better therapeutic access.
9. What pricing options are available for accessing the report?
Pricing options include single-user, multi-user, and enterprise licenses priced at USD 4750, USD 5250, and USD 8750 respectively.
10. Is the market size provided in terms of value or volume?
The market size is provided in terms of value, measured in billion.
11. Are there any specific market keywords associated with the report?
Yes, the market keyword associated with the report is "Elastography Imaging Industry," which aids in identifying and referencing the specific market segment covered.
12. How do I determine which pricing option suits my needs best?
The pricing options vary based on user requirements and access needs. Individual users may opt for single-user licenses, while businesses requiring broader access may choose multi-user or enterprise licenses for cost-effective access to the report.
13. Are there any additional resources or data provided in the Elastography Imaging Industry report?
While the report offers comprehensive insights, it's advisable to review the specific contents or supplementary materials provided to ascertain if additional resources or data are available.
14. How can I stay updated on further developments or reports in the Elastography Imaging Industry?
To stay informed about further developments, trends, and reports in the Elastography Imaging Industry, consider subscribing to industry newsletters, following relevant companies and organizations, or regularly checking reputable industry news sources and publications.
Methodology
Step 1 - Identification of Relevant Samples Size from Population Database


Step 2 - Approaches for Defining Global Market Size (Value, Volume* & Price*)

Note*: In applicable scenarios
Step 3 - Data Sources
Primary Research
- Web Analytics
- Survey Reports
- Research Institute
- Latest Research Reports
- Opinion Leaders
Secondary Research
- Annual Reports
- White Paper
- Latest Press Release
- Industry Association
- Paid Database
- Investor Presentations

Step 4 - Data Triangulation
Involves using different sources of information in order to increase the validity of a study
These sources are likely to be stakeholders in a program - participants, other researchers, program staff, other community members, and so on.
Then we put all data in single framework & apply various statistical tools to find out the dynamic on the market.
During the analysis stage, feedback from the stakeholder groups would be compared to determine areas of agreement as well as areas of divergence