

Key Insights
The global Hemostats market is poised for significant expansion, projected to reach USD 3.03 billion in 2025, with a robust CAGR of 6.03% expected to drive substantial growth throughout the forecast period of 2025-2033. This upward trajectory is primarily fueled by an increasing prevalence of chronic diseases and surgical procedures, particularly those involving trauma, surgery, hemophilia, myocardial infarction, and thrombosis. The rising incidence of these conditions necessitates effective blood loss management solutions, thereby boosting demand for hemostatic agents. Furthermore, advancements in product development, including the introduction of innovative infusible and advanced hemostatic products offering enhanced efficacy and patient safety, are key growth enablers. The growing adoption of minimally invasive surgical techniques also contributes to the market's expansion, as these procedures often require specialized hemostatic agents for precise and effective bleeding control.
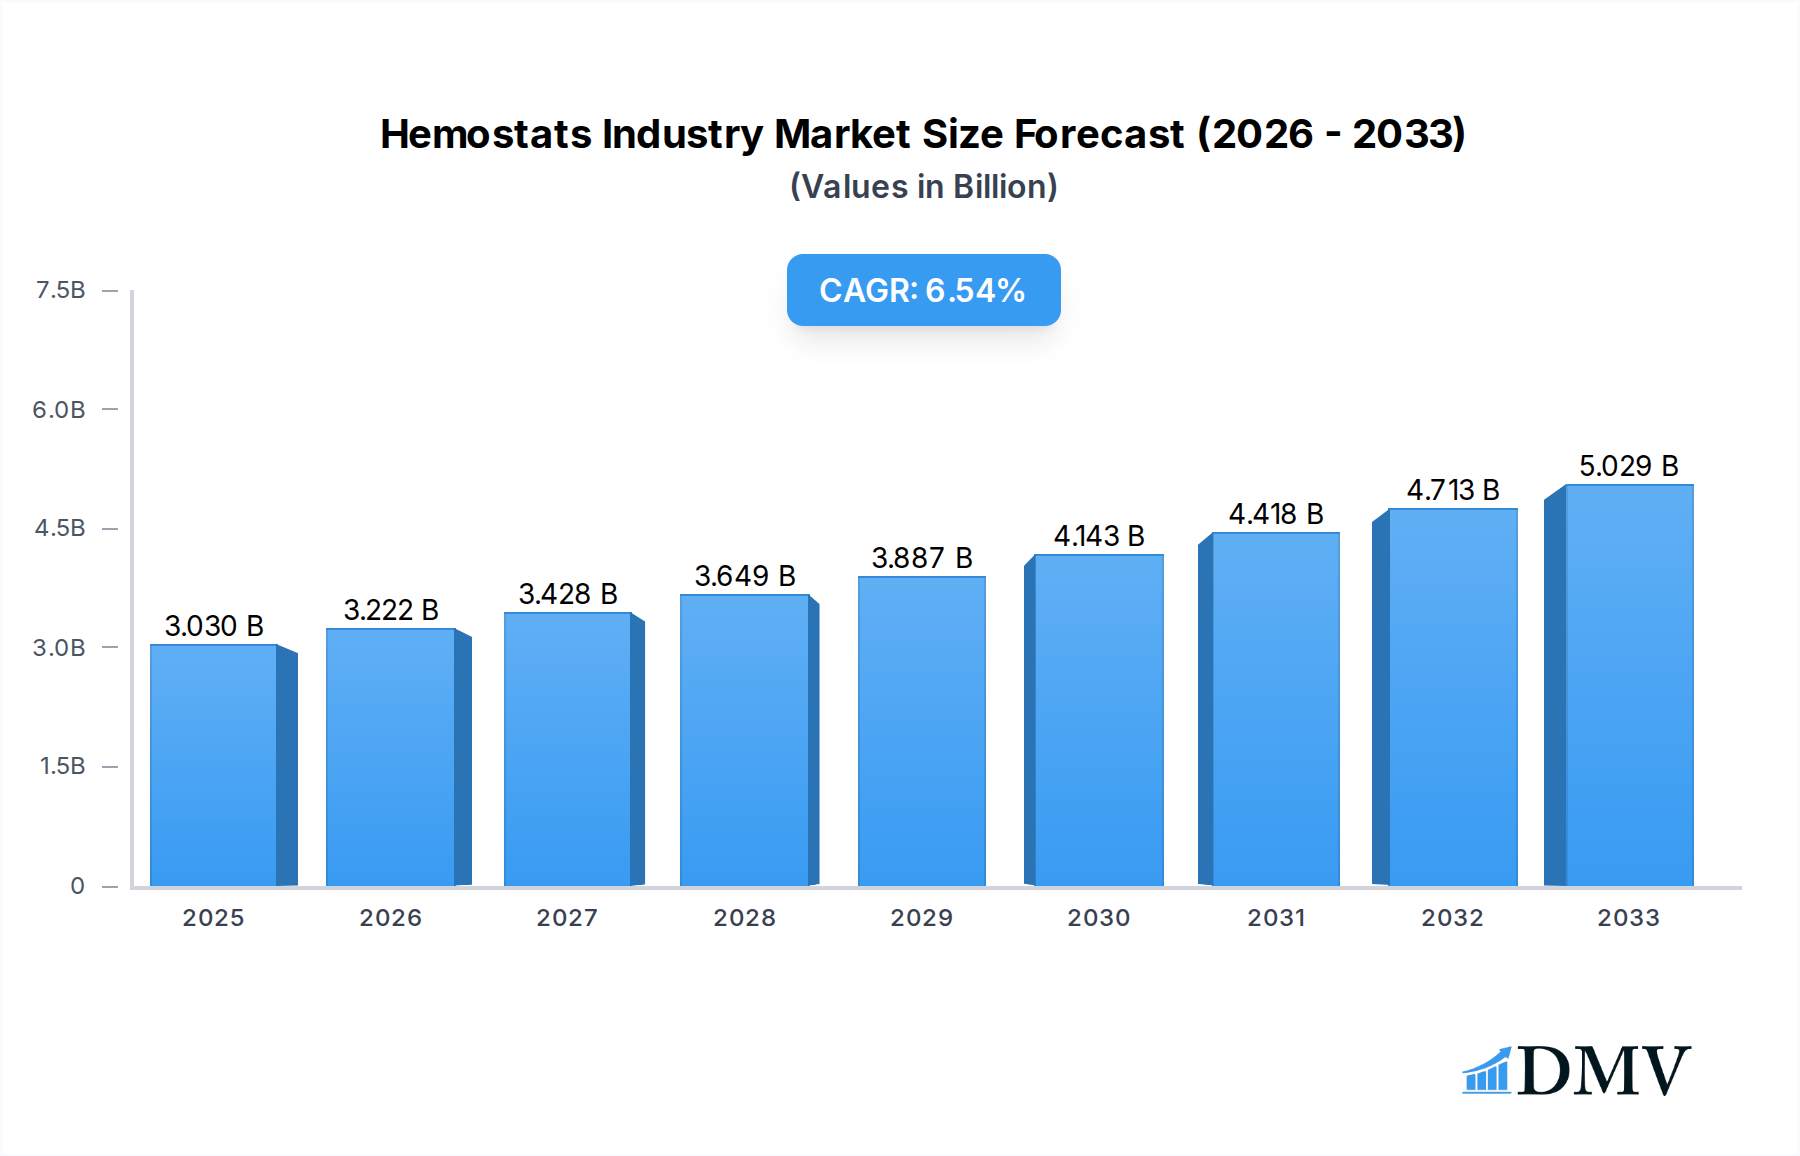
Hemostats Industry Market Size (In Billion)
The market is segmented across various product types, including topical, infusible, and advanced hemostats, catering to diverse medical needs. Geographically, North America currently holds a dominant share, driven by a well-established healthcare infrastructure and high healthcare spending. However, the Asia Pacific region is anticipated to witness the fastest growth, propelled by a rapidly expanding patient pool, increasing healthcare investments, and a growing awareness of advanced hemostatic solutions. Major players like C R Bard Inc (BD), Abbott Laboratories, CSL Behring LLC, Grifols S A, and Johnson & Johnson are actively involved in research and development, mergers, and acquisitions to expand their product portfolios and geographical reach, further shaping the competitive landscape. Despite the promising outlook, certain restraints such as the high cost of advanced hemostatic products and regulatory hurdles in some emerging economies could pose challenges to market growth.

Hemostats Industry Company Market Share
Hemostats Industry Market Composition & Trends
The global Hemostats industry is characterized by a moderately consolidated market landscape, with key players like C R Bard Inc (BD), Abbott Laboratories, CSL Behring LLC, Grifols S A, Johnson & Johnson, and Medtronic plc holding significant market share. The market is driven by continuous innovation in hemostatic agents, fueled by a growing demand for advanced solutions in surgical procedures and trauma management. Regulatory scrutiny from bodies like the FDA and EMA plays a crucial role in product approvals, ensuring efficacy and safety. Substitute products, while present in the form of traditional gauze and sutures, are increasingly being outperformed by specialized hemostatic agents. End-user profiles are dominated by hospitals, followed by clinics, with a growing emphasis on the development of homecare solutions. Mergers and acquisitions are sporadic but impactful, shaping market dynamics. For instance, the acquisition of Dexur by a private equity firm in 2023 for an estimated $1.5 billion reflects the strategic interest in data-driven healthcare solutions within this sector. The market share distribution is heavily skewed towards advanced hemostats, accounting for approximately 65% of the market value.
- Market Concentration: Moderately consolidated with top 5 players holding over 70% of market share.
- Innovation Catalysts: Advancements in biomaterials, nanotechnology, and drug-eluting hemostats.
- Regulatory Landscape: Stringent approval processes by FDA, EMA, and other regional bodies.
- Substitute Products: Traditional gauze, sutures, and manual compression, facing increasing competition.
- End-User Profiles: Primarily hospitals (80%), followed by outpatient surgical centers and specialized clinics.
- M&A Activities: Strategic acquisitions to expand product portfolios and market reach.
Hemostats Industry Industry Evolution
The Hemostats industry has witnessed a remarkable evolutionary trajectory, driven by an escalating global demand for efficient bleeding control solutions across a myriad of medical applications. Historically, the market's growth was primarily propelled by the increasing prevalence of surgical procedures, both elective and emergency, across various specialties like general surgery, cardiovascular, orthopedic, and neurosurgery. This upward trend in surgical interventions directly translated into a higher demand for hemostatic agents, as surgeons sought to minimize blood loss, reduce operative times, and improve patient outcomes. The historical period, from 2019 to 2024, saw a steady compound annual growth rate (CAGR) of approximately 6.5%, with the market size reaching an estimated $7.8 billion in 2024.
Technological advancements have been the linchpin of this evolution. Initially, the market was dominated by relatively simple topical hemostats such as gelatin sponges and oxidized cellulose. However, the pursuit of superior hemostasis and reduced complication rates has spurred the development of more sophisticated products. The introduction of absorbable hemostats, like those based on collagen and chitin, marked a significant leap forward, offering better tissue integration and faster resorption. Subsequently, the advent of advanced hemostats, incorporating active components like thrombin and fibrinogen, and leveraging technologies such as nanotechnology for targeted delivery, has revolutionized bleeding control. These advanced formulations provide rapid and robust clot formation, often exceeding the efficacy of traditional methods, especially in challenging surgical environments with coagulopathic patients or significant oozing.
Shifting consumer demands, particularly from healthcare providers, have also played a pivotal role. Surgeons and hospital administrators are increasingly prioritizing hemostatic solutions that offer not only effective bleeding control but also ease of use, biocompatibility, and cost-effectiveness. This has led to a greater emphasis on user-friendly application devices and products with minimal adverse reactions. The growing awareness and adoption of hemostatic techniques in less traditional areas, such as trauma care and emergency medicine, have further expanded the market. Furthermore, the increasing incidence of chronic diseases, leading to higher rates of complex surgeries and potential bleeding complications, has provided a sustained impetus for market expansion. The market is projected to experience a CAGR of around 7.2% from 2025 to 2033, reaching an estimated $14.2 billion by the end of the forecast period. This robust growth reflects the ongoing innovation pipeline and the indispensable role of hemostats in modern healthcare.
Leading Regions, Countries, or Segments in Hemostats Industry
The global Hemostats industry exhibits distinct regional dominance and segment leadership, driven by a confluence of factors including healthcare infrastructure, prevalence of target diseases, regulatory frameworks, and technological adoption rates. North America, spearheaded by the United States, currently stands as the leading region in the hemostats market, projected to account for approximately 35% of the global market share in 2025. This leadership is underpinned by several key drivers.
- Advanced Healthcare Infrastructure and High Surgical Volume: North America boasts world-class healthcare facilities with a high volume of complex surgical procedures performed annually across various specialties. This includes cardiovascular surgery, orthopedic procedures, and general surgery, all of which have a significant demand for effective hemostatic agents. The estimated number of surgeries performed in the US alone exceeds 50 million annually, directly contributing to hemostat consumption.
- High R&D Investment and Technological Adoption: The region is a hub for medical device innovation and research. Companies are heavily investing in the development of advanced hemostats, including biomimetic and nanotechnology-based solutions, which are readily adopted by healthcare providers due to their superior efficacy and improved patient outcomes. The estimated investment in hemostat R&D in North America exceeds $500 million annually.
- Favorable Reimbursement Policies: Robust reimbursement policies from government and private payers in the US and Canada facilitate the adoption of advanced and often more expensive hemostatic products, making them accessible to a wider patient population undergoing various procedures.
- Prevalence of Target Applications: The high incidence of conditions like trauma, cardiovascular diseases, and hemophilia in North America drives significant demand for hemostatic solutions in these specific applications. For instance, trauma-related injuries account for an estimated 30% of hemostat usage in emergency settings.
Within the product segment, Advanced Hemostats are currently leading the market, accounting for an estimated 65% of the market value in 2025. This dominance is attributed to their superior performance in complex surgical scenarios and their ability to address challenging bleeding situations more effectively than traditional topical or infusible agents. The application segment of Surgery is the largest driver of hemostat demand, representing over 50% of the market share, followed by Trauma care. In terms of end-users, Hospitals remain the primary consumers, accounting for approximately 80% of the market, due to their central role in performing surgeries and managing critical care. The projected market size for advanced hemostats is expected to reach $8.9 billion by 2025.
- Key Drivers in North America: High surgical volumes, significant R&D investment, advanced healthcare infrastructure, and favorable reimbursement policies.
- Dominant Product Segment: Advanced Hemostats, driven by technological innovation and efficacy.
- Leading Application: Surgery, encompassing a wide range of medical procedures.
- Primary End User: Hospitals, due to their extensive surgical capabilities and patient care needs.
Hemostats Industry Product Innovations
The Hemostats industry is witnessing continuous product innovation, driven by the need for enhanced efficacy, improved biocompatibility, and ease of application. Recent advancements include the development of bio-absorbable hemostatic sealants that conform to tissue surfaces, providing sustained hemostasis. Furthermore, nanotechnology is being leveraged to create targeted hemostatic agents that can rapidly initiate clot formation at the bleeding site, minimizing systemic exposure. Performance metrics such as sealing pressure, clotting time, and tissue integration are key benchmarks for these innovations. For instance, newer generation hemostats demonstrate clotting times reduced by up to 50% compared to traditional agents, with an absorption rate of over 95% within 14 days, minimizing foreign body reactions.
Propelling Factors for Hemostats Industry Growth
Several key factors are propelling the growth of the Hemostats industry. The increasing global prevalence of chronic diseases like cardiovascular disorders and cancer, which often necessitate complex surgical interventions, is a major driver. Advancements in surgical techniques, including minimally invasive procedures, demand highly effective and precise hemostatic agents. Furthermore, a rising number of trauma cases globally, particularly in developing economies, is fueling the demand for rapid and effective bleeding control solutions. The growing awareness among healthcare professionals and patients about the benefits of advanced hemostats in reducing blood loss, shortening hospital stays, and improving patient outcomes further stimulates market expansion. The estimated market growth rate is approximately 7.2% annually.
- Increasing Surgical Procedures: Driven by aging populations and rising chronic disease incidence.
- Technological Advancements: Development of sophisticated biomaterials and drug-delivery systems.
- Trauma Care Demand: Growing need for rapid bleeding control in emergency settings.
- Awareness and Education: Increased understanding of hemostat benefits among healthcare providers.
Obstacles in the Hemostats Industry Market
Despite robust growth prospects, the Hemostats industry faces certain obstacles. Stringent regulatory approval processes for new hemostatic agents can lead to prolonged development timelines and significant R&D costs, estimated to be in the range of $50 million to $100 million per product. The high cost of advanced hemostatic products can be a barrier to adoption in price-sensitive markets or for patients with limited insurance coverage. Moreover, supply chain disruptions, as witnessed during global health crises, can impact the availability and cost of raw materials crucial for hemostat manufacturing. Competitive pressure from established players and the threat of biosimilar or generic alternatives also pose challenges.
- Regulatory Hurdles: Lengthy and expensive approval processes.
- High Product Cost: Limiting accessibility in certain markets.
- Supply Chain Vulnerabilities: Potential disruptions impacting raw material availability.
- Intense Competition: Pressure from established manufacturers and new entrants.
Future Opportunities in Hemostats Industry
The Hemostats industry is ripe with future opportunities. The development of smart hemostats that can monitor bleeding and deliver therapeutic agents on demand represents a significant innovation frontier. Expansion into emerging markets, with their growing healthcare expenditure and increasing adoption of advanced medical technologies, presents substantial growth potential. Furthermore, the application of hemostatic agents in non-surgical fields, such as wound healing and tissue regeneration, is an underexplored area with immense promise. The increasing focus on point-of-care diagnostics for coagulation disorders could also drive innovation in companion hemostatic products.
- Smart Hemostats: Integration of monitoring and therapeutic capabilities.
- Emerging Market Expansion: Tapping into growing healthcare sectors in Asia, Africa, and Latin America.
- Non-Surgical Applications: Wound healing, regenerative medicine.
- Personalized Medicine: Development of tailored hemostatic solutions based on patient-specific needs.
Major Players in the Hemostats Industry Ecosystem
- C R Bard Inc (BD)
- Abbott Laboratories
- CSL Behring LLC
- Grifols S A
- Johnson & Johnson
- Tricol Biomedical
- Baxter International Inc
- Medtronic plc
- Pfizer Inc
- Dexur
Key Developments in Hemostats Industry Industry
- May 2022: Precision BioLogic Inc. launched its new cryocheck Chromogenic Factor IX assay in Canada, the European Union, and the United Kingdom, Australia, and New Zealand, enhancing diagnostic capabilities for hemostasis disorders.
- February 2022: Futura Surgicare Pvt Ltd expanded its product portfolio by launching hemostatic products under the brand Hemostax (Oxidised Regenerated Cellulose) under a new vertical, Dolphin Hemostats. Hemostax Standard is an absorbable hemostat designed to help surgeons control bleeding more efficiently.
Strategic Hemostats Industry Market Forecast
The Hemostats industry is poised for sustained and robust growth through 2033, driven by a confluence of strategic factors. The continuous pipeline of innovative products, particularly in the advanced hemostats segment, will be a key growth catalyst. The increasing global burden of chronic diseases necessitating surgical interventions, coupled with advancements in minimally invasive surgical techniques, will ensure a persistent demand for effective bleeding control. Furthermore, the growing emphasis on improved patient outcomes, reduced hospital stays, and faster recovery times directly translates into higher adoption rates for sophisticated hemostatic solutions. Emerging market penetration, alongside the potential for novel applications in regenerative medicine and advanced wound care, presents significant untapped opportunities. The market is projected to grow at a CAGR of approximately 7.2% over the forecast period, reaching an estimated $14.2 billion by 2033, indicating substantial market potential and strategic opportunities for stakeholders.
Hemostats Industry Segmentation
-
1. Product
- 1.1. Topical
- 1.2. Infusibl
- 1.3. Advanced
-
2. Application
- 2.1. Trauma
- 2.2. Surgery
- 2.3. Hemophilia
- 2.4. Myocardial Infarction
- 2.5. Thrombosis
- 2.6. Others
-
3. End User
- 3.1. Hospitals
- 3.2. Clinics
- 3.3. Others
Hemostats Industry Segmentation By Geography
-
1. North America
- 1.1. United States
- 1.2. Canada
- 1.3. Mexico
-
2. Europe
- 2.1. Germany
- 2.2. United Kingdom
- 2.3. France
- 2.4. Italy
- 2.5. Spain
- 2.6. Rest of Europe
-
3. Asia Pacific
- 3.1. China
- 3.2. Japan
- 3.3. India
- 3.4. Australia
- 3.5. South Korea
- 3.6. Rest of Asia Pacific
-
4. Middle East and Africa
- 4.1. GCC
- 4.2. South Africa
- 4.3. Rest of Middle East and Africa
-
5. South America
- 5.1. Brazil
- 5.2. Argentina
- 5.3. Rest of South America

Hemostats Industry Regional Market Share
Geographic Coverage of Hemostats Industry
Hemostats Industry REPORT HIGHLIGHTS
| Aspects | Details |
|---|---|
| Study Period | 2020-2034 |
| Base Year | 2025 |
| Estimated Year | 2026 |
| Forecast Period | 2026-2034 |
| Historical Period | 2020-2025 |
| Growth Rate | CAGR of 5.23% from 2020-2034 |
| Segmentation |
|
Table of Contents
- 1. Introduction
- 1.1. Research Scope
- 1.2. Market Segmentation
- 1.3. Research Objective
- 1.4. Definitions and Assumptions
- 2. Executive Summary
- 2.1. Market Snapshot
- 3. Market Dynamics
- 3.1. Market Drivers
- 3.2. Market Restrains
- 3.3. Market Trends
- 3.4. Market Opportunities
- 4. Market Factor Analysis
- 4.1. Porters Five Forces
- 4.1.1. Bargaining Power of Suppliers
- 4.1.2. Bargaining Power of Buyers
- 4.1.3. Threat of New Entrants
- 4.1.4. Threat of Substitutes
- 4.1.5. Competitive Rivalry
- 4.2. PESTEL analysis
- 4.3. BCG Analysis
- 4.3.1. Stars (High Growth, High Market Share)
- 4.3.2. Cash Cows (Low Growth, High Market Share)
- 4.3.3. Question Mark (High Growth, Low Market Share)
- 4.3.4. Dogs (Low Growth, Low Market Share)
- 4.4. Ansoff Matrix Analysis
- 4.5. Supply Chain Analysis
- 4.6. Regulatory Landscape
- 4.7. Current Market Potential and Opportunity Assessment (TAM–SAM–SOM Framework)
- 4.8. DMV Analyst Note
- 4.1. Porters Five Forces
- 5. Market Analysis, Insights and Forecast 2021-2033
- 5.1. Market Analysis, Insights and Forecast - by Product
- 5.1.1. Topical
- 5.1.2. Infusibl
- 5.1.3. Advanced
- 5.2. Market Analysis, Insights and Forecast - by Application
- 5.2.1. Trauma
- 5.2.2. Surgery
- 5.2.3. Hemophilia
- 5.2.4. Myocardial Infarction
- 5.2.5. Thrombosis
- 5.2.6. Others
- 5.3. Market Analysis, Insights and Forecast - by End User
- 5.3.1. Hospitals
- 5.3.2. Clinics
- 5.3.3. Others
- 5.4. Market Analysis, Insights and Forecast - by Region
- 5.4.1. North America
- 5.4.2. Europe
- 5.4.3. Asia Pacific
- 5.4.4. Middle East and Africa
- 5.4.5. South America
- 5.1. Market Analysis, Insights and Forecast - by Product
- 6. Global Hemostats Industry Analysis, Insights and Forecast, 2021-2033
- 6.1. Market Analysis, Insights and Forecast - by Product
- 6.1.1. Topical
- 6.1.2. Infusibl
- 6.1.3. Advanced
- 6.2. Market Analysis, Insights and Forecast - by Application
- 6.2.1. Trauma
- 6.2.2. Surgery
- 6.2.3. Hemophilia
- 6.2.4. Myocardial Infarction
- 6.2.5. Thrombosis
- 6.2.6. Others
- 6.3. Market Analysis, Insights and Forecast - by End User
- 6.3.1. Hospitals
- 6.3.2. Clinics
- 6.3.3. Others
- 6.1. Market Analysis, Insights and Forecast - by Product
- 7. North America Hemostats Industry Analysis, Insights and Forecast, 2020-2032
- 7.1. Market Analysis, Insights and Forecast - by Product
- 7.1.1. Topical
- 7.1.2. Infusibl
- 7.1.3. Advanced
- 7.2. Market Analysis, Insights and Forecast - by Application
- 7.2.1. Trauma
- 7.2.2. Surgery
- 7.2.3. Hemophilia
- 7.2.4. Myocardial Infarction
- 7.2.5. Thrombosis
- 7.2.6. Others
- 7.3. Market Analysis, Insights and Forecast - by End User
- 7.3.1. Hospitals
- 7.3.2. Clinics
- 7.3.3. Others
- 7.1. Market Analysis, Insights and Forecast - by Product
- 8. Europe Hemostats Industry Analysis, Insights and Forecast, 2020-2032
- 8.1. Market Analysis, Insights and Forecast - by Product
- 8.1.1. Topical
- 8.1.2. Infusibl
- 8.1.3. Advanced
- 8.2. Market Analysis, Insights and Forecast - by Application
- 8.2.1. Trauma
- 8.2.2. Surgery
- 8.2.3. Hemophilia
- 8.2.4. Myocardial Infarction
- 8.2.5. Thrombosis
- 8.2.6. Others
- 8.3. Market Analysis, Insights and Forecast - by End User
- 8.3.1. Hospitals
- 8.3.2. Clinics
- 8.3.3. Others
- 8.1. Market Analysis, Insights and Forecast - by Product
- 9. Asia Pacific Hemostats Industry Analysis, Insights and Forecast, 2020-2032
- 9.1. Market Analysis, Insights and Forecast - by Product
- 9.1.1. Topical
- 9.1.2. Infusibl
- 9.1.3. Advanced
- 9.2. Market Analysis, Insights and Forecast - by Application
- 9.2.1. Trauma
- 9.2.2. Surgery
- 9.2.3. Hemophilia
- 9.2.4. Myocardial Infarction
- 9.2.5. Thrombosis
- 9.2.6. Others
- 9.3. Market Analysis, Insights and Forecast - by End User
- 9.3.1. Hospitals
- 9.3.2. Clinics
- 9.3.3. Others
- 9.1. Market Analysis, Insights and Forecast - by Product
- 10. Middle East and Africa Hemostats Industry Analysis, Insights and Forecast, 2020-2032
- 10.1. Market Analysis, Insights and Forecast - by Product
- 10.1.1. Topical
- 10.1.2. Infusibl
- 10.1.3. Advanced
- 10.2. Market Analysis, Insights and Forecast - by Application
- 10.2.1. Trauma
- 10.2.2. Surgery
- 10.2.3. Hemophilia
- 10.2.4. Myocardial Infarction
- 10.2.5. Thrombosis
- 10.2.6. Others
- 10.3. Market Analysis, Insights and Forecast - by End User
- 10.3.1. Hospitals
- 10.3.2. Clinics
- 10.3.3. Others
- 10.1. Market Analysis, Insights and Forecast - by Product
- 11. South America Hemostats Industry Analysis, Insights and Forecast, 2020-2032
- 11.1. Market Analysis, Insights and Forecast - by Product
- 11.1.1. Topical
- 11.1.2. Infusibl
- 11.1.3. Advanced
- 11.2. Market Analysis, Insights and Forecast - by Application
- 11.2.1. Trauma
- 11.2.2. Surgery
- 11.2.3. Hemophilia
- 11.2.4. Myocardial Infarction
- 11.2.5. Thrombosis
- 11.2.6. Others
- 11.3. Market Analysis, Insights and Forecast - by End User
- 11.3.1. Hospitals
- 11.3.2. Clinics
- 11.3.3. Others
- 11.1. Market Analysis, Insights and Forecast - by Product
- 12. Competitive Analysis
- 12.1. Company Profiles
- 12.1.1 C R Bard Inc (BD)
- 12.1.1.1. Company Overview
- 12.1.1.2. Products
- 12.1.1.3. Company Financials
- 12.1.1.4. SWOT Analysis
- 12.1.2 Abbott Laboratories
- 12.1.2.1. Company Overview
- 12.1.2.2. Products
- 12.1.2.3. Company Financials
- 12.1.2.4. SWOT Analysis
- 12.1.3 CSL Behring LLC
- 12.1.3.1. Company Overview
- 12.1.3.2. Products
- 12.1.3.3. Company Financials
- 12.1.3.4. SWOT Analysis
- 12.1.4 Grifols S A
- 12.1.4.1. Company Overview
- 12.1.4.2. Products
- 12.1.4.3. Company Financials
- 12.1.4.4. SWOT Analysis
- 12.1.5 Dexur
- 12.1.5.1. Company Overview
- 12.1.5.2. Products
- 12.1.5.3. Company Financials
- 12.1.5.4. SWOT Analysis
- 12.1.6 Johnson & Johnson
- 12.1.6.1. Company Overview
- 12.1.6.2. Products
- 12.1.6.3. Company Financials
- 12.1.6.4. SWOT Analysis
- 12.1.7 Tricol Biomedical
- 12.1.7.1. Company Overview
- 12.1.7.2. Products
- 12.1.7.3. Company Financials
- 12.1.7.4. SWOT Analysis
- 12.1.8 Baxter International Inc
- 12.1.8.1. Company Overview
- 12.1.8.2. Products
- 12.1.8.3. Company Financials
- 12.1.8.4. SWOT Analysis
- 12.1.9 Medtronic plc
- 12.1.9.1. Company Overview
- 12.1.9.2. Products
- 12.1.9.3. Company Financials
- 12.1.9.4. SWOT Analysis
- 12.1.10 Pfizer Inc
- 12.1.10.1. Company Overview
- 12.1.10.2. Products
- 12.1.10.3. Company Financials
- 12.1.10.4. SWOT Analysis
- 12.1.1 C R Bard Inc (BD)
- 12.2. Market Entropy
- 12.2.1 Company's Key Areas Served
- 12.2.2 Recent Developments
- 12.3. Company Market Share Analysis 2025
- 12.3.1 Top 5 Companies Market Share Analysis
- 12.3.2 Top 3 Companies Market Share Analysis
- 12.4. List of Potential Customers
- 13. Research Methodology
List of Figures
- Figure 1: Global Hemostats Industry Revenue Breakdown (billion, %) by Region 2025 & 2033
- Figure 2: Global Hemostats Industry Volume Breakdown (K Unit, %) by Region 2025 & 2033
- Figure 3: North America Hemostats Industry Revenue (billion), by Product 2025 & 2033
- Figure 4: North America Hemostats Industry Volume (K Unit), by Product 2025 & 2033
- Figure 5: North America Hemostats Industry Revenue Share (%), by Product 2025 & 2033
- Figure 6: North America Hemostats Industry Volume Share (%), by Product 2025 & 2033
- Figure 7: North America Hemostats Industry Revenue (billion), by Application 2025 & 2033
- Figure 8: North America Hemostats Industry Volume (K Unit), by Application 2025 & 2033
- Figure 9: North America Hemostats Industry Revenue Share (%), by Application 2025 & 2033
- Figure 10: North America Hemostats Industry Volume Share (%), by Application 2025 & 2033
- Figure 11: North America Hemostats Industry Revenue (billion), by End User 2025 & 2033
- Figure 12: North America Hemostats Industry Volume (K Unit), by End User 2025 & 2033
- Figure 13: North America Hemostats Industry Revenue Share (%), by End User 2025 & 2033
- Figure 14: North America Hemostats Industry Volume Share (%), by End User 2025 & 2033
- Figure 15: North America Hemostats Industry Revenue (billion), by Country 2025 & 2033
- Figure 16: North America Hemostats Industry Volume (K Unit), by Country 2025 & 2033
- Figure 17: North America Hemostats Industry Revenue Share (%), by Country 2025 & 2033
- Figure 18: North America Hemostats Industry Volume Share (%), by Country 2025 & 2033
- Figure 19: Europe Hemostats Industry Revenue (billion), by Product 2025 & 2033
- Figure 20: Europe Hemostats Industry Volume (K Unit), by Product 2025 & 2033
- Figure 21: Europe Hemostats Industry Revenue Share (%), by Product 2025 & 2033
- Figure 22: Europe Hemostats Industry Volume Share (%), by Product 2025 & 2033
- Figure 23: Europe Hemostats Industry Revenue (billion), by Application 2025 & 2033
- Figure 24: Europe Hemostats Industry Volume (K Unit), by Application 2025 & 2033
- Figure 25: Europe Hemostats Industry Revenue Share (%), by Application 2025 & 2033
- Figure 26: Europe Hemostats Industry Volume Share (%), by Application 2025 & 2033
- Figure 27: Europe Hemostats Industry Revenue (billion), by End User 2025 & 2033
- Figure 28: Europe Hemostats Industry Volume (K Unit), by End User 2025 & 2033
- Figure 29: Europe Hemostats Industry Revenue Share (%), by End User 2025 & 2033
- Figure 30: Europe Hemostats Industry Volume Share (%), by End User 2025 & 2033
- Figure 31: Europe Hemostats Industry Revenue (billion), by Country 2025 & 2033
- Figure 32: Europe Hemostats Industry Volume (K Unit), by Country 2025 & 2033
- Figure 33: Europe Hemostats Industry Revenue Share (%), by Country 2025 & 2033
- Figure 34: Europe Hemostats Industry Volume Share (%), by Country 2025 & 2033
- Figure 35: Asia Pacific Hemostats Industry Revenue (billion), by Product 2025 & 2033
- Figure 36: Asia Pacific Hemostats Industry Volume (K Unit), by Product 2025 & 2033
- Figure 37: Asia Pacific Hemostats Industry Revenue Share (%), by Product 2025 & 2033
- Figure 38: Asia Pacific Hemostats Industry Volume Share (%), by Product 2025 & 2033
- Figure 39: Asia Pacific Hemostats Industry Revenue (billion), by Application 2025 & 2033
- Figure 40: Asia Pacific Hemostats Industry Volume (K Unit), by Application 2025 & 2033
- Figure 41: Asia Pacific Hemostats Industry Revenue Share (%), by Application 2025 & 2033
- Figure 42: Asia Pacific Hemostats Industry Volume Share (%), by Application 2025 & 2033
- Figure 43: Asia Pacific Hemostats Industry Revenue (billion), by End User 2025 & 2033
- Figure 44: Asia Pacific Hemostats Industry Volume (K Unit), by End User 2025 & 2033
- Figure 45: Asia Pacific Hemostats Industry Revenue Share (%), by End User 2025 & 2033
- Figure 46: Asia Pacific Hemostats Industry Volume Share (%), by End User 2025 & 2033
- Figure 47: Asia Pacific Hemostats Industry Revenue (billion), by Country 2025 & 2033
- Figure 48: Asia Pacific Hemostats Industry Volume (K Unit), by Country 2025 & 2033
- Figure 49: Asia Pacific Hemostats Industry Revenue Share (%), by Country 2025 & 2033
- Figure 50: Asia Pacific Hemostats Industry Volume Share (%), by Country 2025 & 2033
- Figure 51: Middle East and Africa Hemostats Industry Revenue (billion), by Product 2025 & 2033
- Figure 52: Middle East and Africa Hemostats Industry Volume (K Unit), by Product 2025 & 2033
- Figure 53: Middle East and Africa Hemostats Industry Revenue Share (%), by Product 2025 & 2033
- Figure 54: Middle East and Africa Hemostats Industry Volume Share (%), by Product 2025 & 2033
- Figure 55: Middle East and Africa Hemostats Industry Revenue (billion), by Application 2025 & 2033
- Figure 56: Middle East and Africa Hemostats Industry Volume (K Unit), by Application 2025 & 2033
- Figure 57: Middle East and Africa Hemostats Industry Revenue Share (%), by Application 2025 & 2033
- Figure 58: Middle East and Africa Hemostats Industry Volume Share (%), by Application 2025 & 2033
- Figure 59: Middle East and Africa Hemostats Industry Revenue (billion), by End User 2025 & 2033
- Figure 60: Middle East and Africa Hemostats Industry Volume (K Unit), by End User 2025 & 2033
- Figure 61: Middle East and Africa Hemostats Industry Revenue Share (%), by End User 2025 & 2033
- Figure 62: Middle East and Africa Hemostats Industry Volume Share (%), by End User 2025 & 2033
- Figure 63: Middle East and Africa Hemostats Industry Revenue (billion), by Country 2025 & 2033
- Figure 64: Middle East and Africa Hemostats Industry Volume (K Unit), by Country 2025 & 2033
- Figure 65: Middle East and Africa Hemostats Industry Revenue Share (%), by Country 2025 & 2033
- Figure 66: Middle East and Africa Hemostats Industry Volume Share (%), by Country 2025 & 2033
- Figure 67: South America Hemostats Industry Revenue (billion), by Product 2025 & 2033
- Figure 68: South America Hemostats Industry Volume (K Unit), by Product 2025 & 2033
- Figure 69: South America Hemostats Industry Revenue Share (%), by Product 2025 & 2033
- Figure 70: South America Hemostats Industry Volume Share (%), by Product 2025 & 2033
- Figure 71: South America Hemostats Industry Revenue (billion), by Application 2025 & 2033
- Figure 72: South America Hemostats Industry Volume (K Unit), by Application 2025 & 2033
- Figure 73: South America Hemostats Industry Revenue Share (%), by Application 2025 & 2033
- Figure 74: South America Hemostats Industry Volume Share (%), by Application 2025 & 2033
- Figure 75: South America Hemostats Industry Revenue (billion), by End User 2025 & 2033
- Figure 76: South America Hemostats Industry Volume (K Unit), by End User 2025 & 2033
- Figure 77: South America Hemostats Industry Revenue Share (%), by End User 2025 & 2033
- Figure 78: South America Hemostats Industry Volume Share (%), by End User 2025 & 2033
- Figure 79: South America Hemostats Industry Revenue (billion), by Country 2025 & 2033
- Figure 80: South America Hemostats Industry Volume (K Unit), by Country 2025 & 2033
- Figure 81: South America Hemostats Industry Revenue Share (%), by Country 2025 & 2033
- Figure 82: South America Hemostats Industry Volume Share (%), by Country 2025 & 2033
List of Tables
- Table 1: Global Hemostats Industry Revenue billion Forecast, by Product 2020 & 2033
- Table 2: Global Hemostats Industry Volume K Unit Forecast, by Product 2020 & 2033
- Table 3: Global Hemostats Industry Revenue billion Forecast, by Application 2020 & 2033
- Table 4: Global Hemostats Industry Volume K Unit Forecast, by Application 2020 & 2033
- Table 5: Global Hemostats Industry Revenue billion Forecast, by End User 2020 & 2033
- Table 6: Global Hemostats Industry Volume K Unit Forecast, by End User 2020 & 2033
- Table 7: Global Hemostats Industry Revenue billion Forecast, by Region 2020 & 2033
- Table 8: Global Hemostats Industry Volume K Unit Forecast, by Region 2020 & 2033
- Table 9: Global Hemostats Industry Revenue billion Forecast, by Product 2020 & 2033
- Table 10: Global Hemostats Industry Volume K Unit Forecast, by Product 2020 & 2033
- Table 11: Global Hemostats Industry Revenue billion Forecast, by Application 2020 & 2033
- Table 12: Global Hemostats Industry Volume K Unit Forecast, by Application 2020 & 2033
- Table 13: Global Hemostats Industry Revenue billion Forecast, by End User 2020 & 2033
- Table 14: Global Hemostats Industry Volume K Unit Forecast, by End User 2020 & 2033
- Table 15: Global Hemostats Industry Revenue billion Forecast, by Country 2020 & 2033
- Table 16: Global Hemostats Industry Volume K Unit Forecast, by Country 2020 & 2033
- Table 17: United States Hemostats Industry Revenue (billion) Forecast, by Application 2020 & 2033
- Table 18: United States Hemostats Industry Volume (K Unit) Forecast, by Application 2020 & 2033
- Table 19: Canada Hemostats Industry Revenue (billion) Forecast, by Application 2020 & 2033
- Table 20: Canada Hemostats Industry Volume (K Unit) Forecast, by Application 2020 & 2033
- Table 21: Mexico Hemostats Industry Revenue (billion) Forecast, by Application 2020 & 2033
- Table 22: Mexico Hemostats Industry Volume (K Unit) Forecast, by Application 2020 & 2033
- Table 23: Global Hemostats Industry Revenue billion Forecast, by Product 2020 & 2033
- Table 24: Global Hemostats Industry Volume K Unit Forecast, by Product 2020 & 2033
- Table 25: Global Hemostats Industry Revenue billion Forecast, by Application 2020 & 2033
- Table 26: Global Hemostats Industry Volume K Unit Forecast, by Application 2020 & 2033
- Table 27: Global Hemostats Industry Revenue billion Forecast, by End User 2020 & 2033
- Table 28: Global Hemostats Industry Volume K Unit Forecast, by End User 2020 & 2033
- Table 29: Global Hemostats Industry Revenue billion Forecast, by Country 2020 & 2033
- Table 30: Global Hemostats Industry Volume K Unit Forecast, by Country 2020 & 2033
- Table 31: Germany Hemostats Industry Revenue (billion) Forecast, by Application 2020 & 2033
- Table 32: Germany Hemostats Industry Volume (K Unit) Forecast, by Application 2020 & 2033
- Table 33: United Kingdom Hemostats Industry Revenue (billion) Forecast, by Application 2020 & 2033
- Table 34: United Kingdom Hemostats Industry Volume (K Unit) Forecast, by Application 2020 & 2033
- Table 35: France Hemostats Industry Revenue (billion) Forecast, by Application 2020 & 2033
- Table 36: France Hemostats Industry Volume (K Unit) Forecast, by Application 2020 & 2033
- Table 37: Italy Hemostats Industry Revenue (billion) Forecast, by Application 2020 & 2033
- Table 38: Italy Hemostats Industry Volume (K Unit) Forecast, by Application 2020 & 2033
- Table 39: Spain Hemostats Industry Revenue (billion) Forecast, by Application 2020 & 2033
- Table 40: Spain Hemostats Industry Volume (K Unit) Forecast, by Application 2020 & 2033
- Table 41: Rest of Europe Hemostats Industry Revenue (billion) Forecast, by Application 2020 & 2033
- Table 42: Rest of Europe Hemostats Industry Volume (K Unit) Forecast, by Application 2020 & 2033
- Table 43: Global Hemostats Industry Revenue billion Forecast, by Product 2020 & 2033
- Table 44: Global Hemostats Industry Volume K Unit Forecast, by Product 2020 & 2033
- Table 45: Global Hemostats Industry Revenue billion Forecast, by Application 2020 & 2033
- Table 46: Global Hemostats Industry Volume K Unit Forecast, by Application 2020 & 2033
- Table 47: Global Hemostats Industry Revenue billion Forecast, by End User 2020 & 2033
- Table 48: Global Hemostats Industry Volume K Unit Forecast, by End User 2020 & 2033
- Table 49: Global Hemostats Industry Revenue billion Forecast, by Country 2020 & 2033
- Table 50: Global Hemostats Industry Volume K Unit Forecast, by Country 2020 & 2033
- Table 51: China Hemostats Industry Revenue (billion) Forecast, by Application 2020 & 2033
- Table 52: China Hemostats Industry Volume (K Unit) Forecast, by Application 2020 & 2033
- Table 53: Japan Hemostats Industry Revenue (billion) Forecast, by Application 2020 & 2033
- Table 54: Japan Hemostats Industry Volume (K Unit) Forecast, by Application 2020 & 2033
- Table 55: India Hemostats Industry Revenue (billion) Forecast, by Application 2020 & 2033
- Table 56: India Hemostats Industry Volume (K Unit) Forecast, by Application 2020 & 2033
- Table 57: Australia Hemostats Industry Revenue (billion) Forecast, by Application 2020 & 2033
- Table 58: Australia Hemostats Industry Volume (K Unit) Forecast, by Application 2020 & 2033
- Table 59: South Korea Hemostats Industry Revenue (billion) Forecast, by Application 2020 & 2033
- Table 60: South Korea Hemostats Industry Volume (K Unit) Forecast, by Application 2020 & 2033
- Table 61: Rest of Asia Pacific Hemostats Industry Revenue (billion) Forecast, by Application 2020 & 2033
- Table 62: Rest of Asia Pacific Hemostats Industry Volume (K Unit) Forecast, by Application 2020 & 2033
- Table 63: Global Hemostats Industry Revenue billion Forecast, by Product 2020 & 2033
- Table 64: Global Hemostats Industry Volume K Unit Forecast, by Product 2020 & 2033
- Table 65: Global Hemostats Industry Revenue billion Forecast, by Application 2020 & 2033
- Table 66: Global Hemostats Industry Volume K Unit Forecast, by Application 2020 & 2033
- Table 67: Global Hemostats Industry Revenue billion Forecast, by End User 2020 & 2033
- Table 68: Global Hemostats Industry Volume K Unit Forecast, by End User 2020 & 2033
- Table 69: Global Hemostats Industry Revenue billion Forecast, by Country 2020 & 2033
- Table 70: Global Hemostats Industry Volume K Unit Forecast, by Country 2020 & 2033
- Table 71: GCC Hemostats Industry Revenue (billion) Forecast, by Application 2020 & 2033
- Table 72: GCC Hemostats Industry Volume (K Unit) Forecast, by Application 2020 & 2033
- Table 73: South Africa Hemostats Industry Revenue (billion) Forecast, by Application 2020 & 2033
- Table 74: South Africa Hemostats Industry Volume (K Unit) Forecast, by Application 2020 & 2033
- Table 75: Rest of Middle East and Africa Hemostats Industry Revenue (billion) Forecast, by Application 2020 & 2033
- Table 76: Rest of Middle East and Africa Hemostats Industry Volume (K Unit) Forecast, by Application 2020 & 2033
- Table 77: Global Hemostats Industry Revenue billion Forecast, by Product 2020 & 2033
- Table 78: Global Hemostats Industry Volume K Unit Forecast, by Product 2020 & 2033
- Table 79: Global Hemostats Industry Revenue billion Forecast, by Application 2020 & 2033
- Table 80: Global Hemostats Industry Volume K Unit Forecast, by Application 2020 & 2033
- Table 81: Global Hemostats Industry Revenue billion Forecast, by End User 2020 & 2033
- Table 82: Global Hemostats Industry Volume K Unit Forecast, by End User 2020 & 2033
- Table 83: Global Hemostats Industry Revenue billion Forecast, by Country 2020 & 2033
- Table 84: Global Hemostats Industry Volume K Unit Forecast, by Country 2020 & 2033
- Table 85: Brazil Hemostats Industry Revenue (billion) Forecast, by Application 2020 & 2033
- Table 86: Brazil Hemostats Industry Volume (K Unit) Forecast, by Application 2020 & 2033
- Table 87: Argentina Hemostats Industry Revenue (billion) Forecast, by Application 2020 & 2033
- Table 88: Argentina Hemostats Industry Volume (K Unit) Forecast, by Application 2020 & 2033
- Table 89: Rest of South America Hemostats Industry Revenue (billion) Forecast, by Application 2020 & 2033
- Table 90: Rest of South America Hemostats Industry Volume (K Unit) Forecast, by Application 2020 & 2033
Frequently Asked Questions
1. What is the projected Compound Annual Growth Rate (CAGR) of the Hemostats Industry?
The projected CAGR is approximately 5.23%.
2. Which companies are prominent players in the Hemostats Industry?
Key companies in the market include C R Bard Inc (BD), Abbott Laboratories, CSL Behring LLC, Grifols S A, Dexur, Johnson & Johnson, Tricol Biomedical, Baxter International Inc, Medtronic plc, Pfizer Inc.
3. What are the main segments of the Hemostats Industry?
The market segments include Product, Application, End User.
4. Can you provide details about the market size?
The market size is estimated to be USD 3.9 billion as of 2022.
5. What are some drivers contributing to market growth?
Increasing Number Of Trauma And Surgical Cases; Technological Advancements.
6. What are the notable trends driving market growth?
Surgery Segment is Expected to Hold a Significant Market Share.
7. Are there any restraints impacting market growth?
Stringent Regulatory Policies and Increasing Use of Off-Label Products.
8. Can you provide examples of recent developments in the market?
In May 2022, Precision BioLogic Inc., a developer of hemostasis diagnostic products, reported the launch of its new cryocheck Chromogenic Factor IX assay in Canada, the European Union, and the United Kingdom, Australia, and New Zealand.
9. What pricing options are available for accessing the report?
Pricing options include single-user, multi-user, and enterprise licenses priced at USD 4750, USD 5250, and USD 8750 respectively.
10. Is the market size provided in terms of value or volume?
The market size is provided in terms of value, measured in billion and volume, measured in K Unit.
11. Are there any specific market keywords associated with the report?
Yes, the market keyword associated with the report is "Hemostats Industry," which aids in identifying and referencing the specific market segment covered.
12. How do I determine which pricing option suits my needs best?
The pricing options vary based on user requirements and access needs. Individual users may opt for single-user licenses, while businesses requiring broader access may choose multi-user or enterprise licenses for cost-effective access to the report.
13. Are there any additional resources or data provided in the Hemostats Industry report?
While the report offers comprehensive insights, it's advisable to review the specific contents or supplementary materials provided to ascertain if additional resources or data are available.
14. How can I stay updated on further developments or reports in the Hemostats Industry?
To stay informed about further developments, trends, and reports in the Hemostats Industry, consider subscribing to industry newsletters, following relevant companies and organizations, or regularly checking reputable industry news sources and publications.
Methodology
Step 1 - Identification of Relevant Samples Size from Population Database


Step 2 - Approaches for Defining Global Market Size (Value, Volume* & Price*)

Note*: In applicable scenarios
Step 3 - Data Sources
Primary Research
- Web Analytics
- Survey Reports
- Research Institute
- Latest Research Reports
- Opinion Leaders
Secondary Research
- Annual Reports
- White Paper
- Latest Press Release
- Industry Association
- Paid Database
- Investor Presentations

Step 4 - Data Triangulation
Involves using different sources of information in order to increase the validity of a study
These sources are likely to be stakeholders in a program - participants, other researchers, program staff, other community members, and so on.
Then we put all data in single framework & apply various statistical tools to find out the dynamic on the market.
During the analysis stage, feedback from the stakeholder groups would be compared to determine areas of agreement as well as areas of divergence