

Key Insights
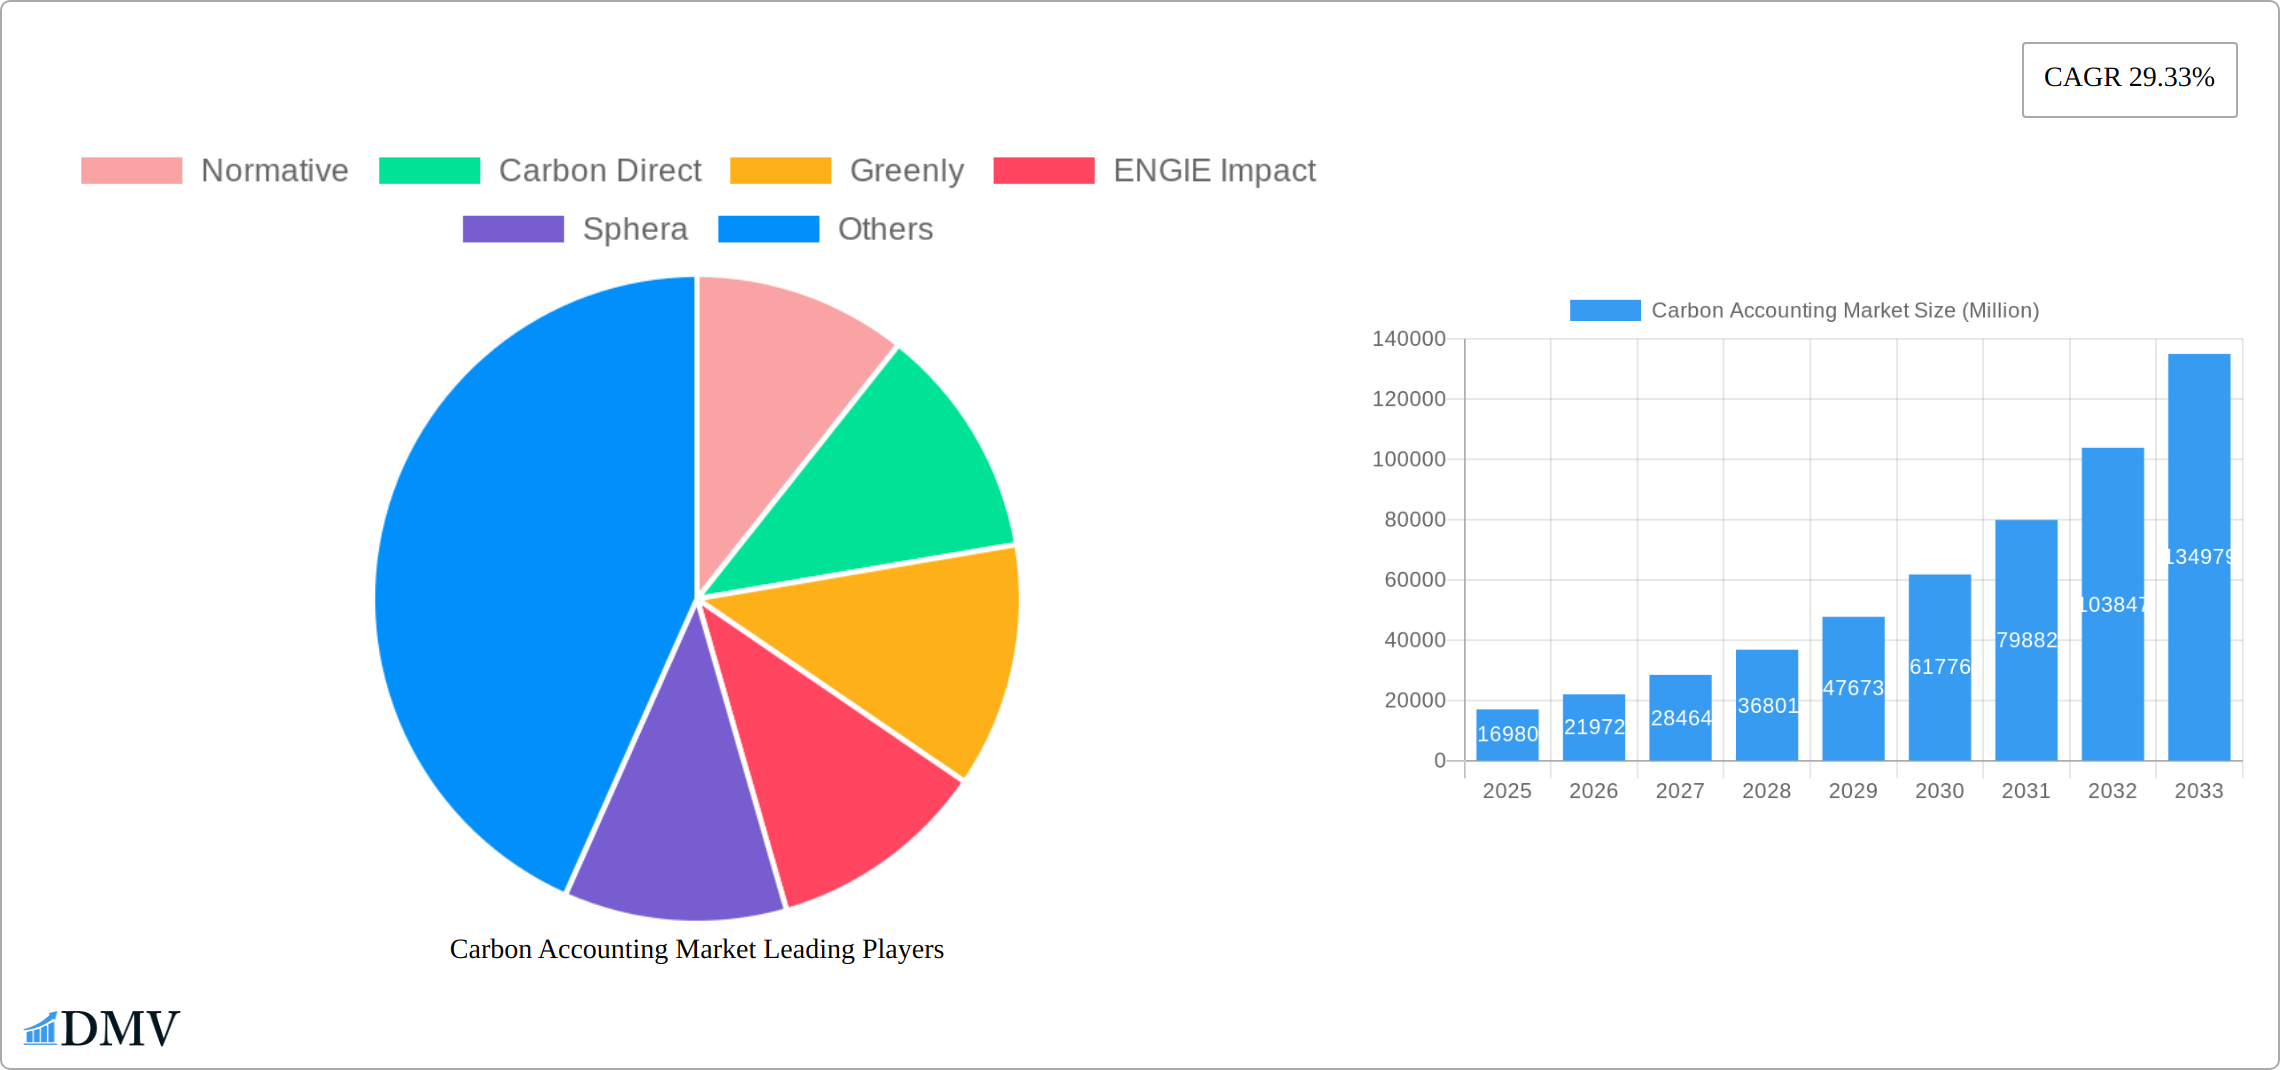
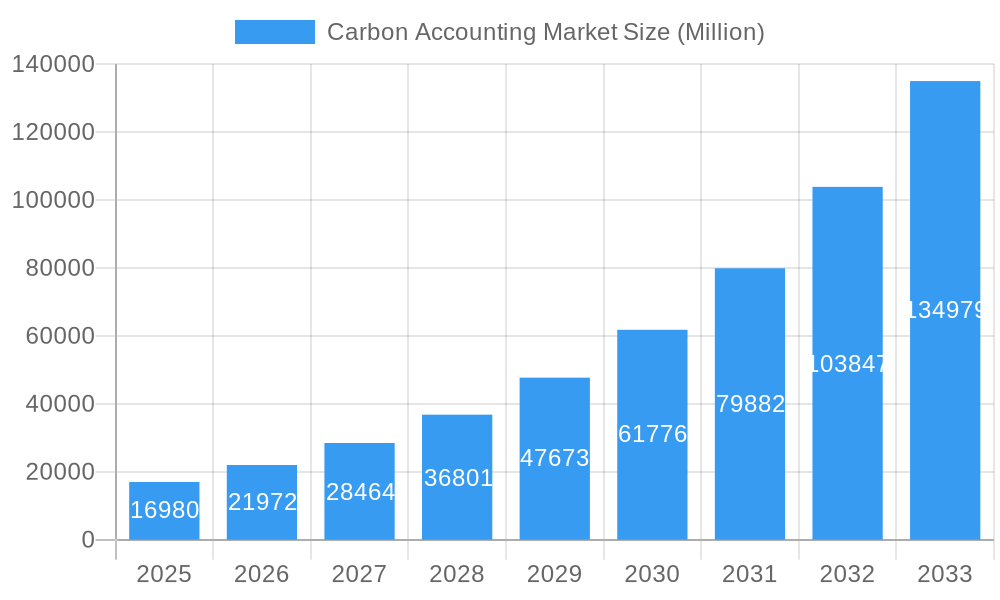
The carbon accounting market is experiencing robust growth, projected to reach \$16.98 billion in 2025 and exhibiting a Compound Annual Growth Rate (CAGR) of 29.33% from 2025 to 2033. This expansion is driven by increasing regulatory pressure on businesses to monitor and reduce their carbon footprint, coupled with growing investor and consumer demand for environmental, social, and governance (ESG) transparency. Key drivers include the rising adoption of sustainability initiatives across various sectors, including oil and gas, power utilities, and construction, as companies strive to meet ambitious emission reduction targets and enhance their brand reputation. The market's segmentation by end-user (Oil & Gas, Power Utilities, Construction & Infrastructure, Telecommunications, Food & Beverages, and Others) and deployment type (Cloud-based and On-Premise) reflects the diverse applications of carbon accounting solutions. The cloud-based segment is anticipated to dominate due to its scalability, cost-effectiveness, and accessibility. Geographic expansion is another significant factor, with North America and Europe currently leading the market, followed by the rapidly developing Asia-Pacific region. However, challenges remain, including the complexity of carbon accounting methodologies and the need for robust data collection and verification processes.
Carbon Accounting Market Market Size (In Billion)
Technological advancements in data analytics and AI-powered solutions are streamlining carbon accounting processes, increasing accuracy, and reducing the time and resources required. This is further facilitating wider adoption across industries and geographical regions. The competitive landscape is dynamic, with established players such as IBM and Diligent Corporation alongside emerging specialized carbon accounting software providers like Normative, Carbon Direct, and Persefoni AI. The market's future trajectory hinges on the evolving regulatory landscape, continued technological innovation, and the increasing sophistication of carbon accounting methodologies, all of which will influence investment in and adoption of these crucial tools for environmental sustainability.
Carbon Accounting Market Company Market Share
Carbon Accounting Market: A Comprehensive Report (2019-2033)
This insightful report provides a detailed analysis of the Carbon Accounting Market, offering a comprehensive overview of its current state, future trajectory, and key players. With a study period spanning 2019-2033, a base year of 2025, and an estimated and forecast period of 2025-2033, this report is an invaluable resource for stakeholders seeking to understand and capitalize on this rapidly evolving market. The historical period covered is 2019-2024. The market size in 2025 is estimated at USD xx Million.
Carbon Accounting Market Composition & Trends
The Carbon Accounting Market is experiencing significant growth driven by stringent environmental regulations, increasing corporate social responsibility (CSR) initiatives, and the growing need for accurate carbon footprint measurement. Market concentration is moderate, with several major players vying for market share. Innovation is primarily fueled by advancements in data analytics, AI, and cloud computing, enabling more precise and efficient carbon accounting solutions. The regulatory landscape is constantly evolving, with new regulations and reporting standards driving demand for robust carbon accounting solutions. Substitute products are limited, primarily focused on manual calculation methods which are less efficient and accurate. Mergers and acquisitions (M&A) activity is relatively high, indicating market consolidation and strategic expansion by key players.
- Market Share Distribution (2024): Normative (15%), Carbon Direct (12%), Greenly (10%), ENGIE Impact (8%), Others (55%).
- M&A Deal Value (2019-2024): USD xx Million.
Carbon Accounting Market Industry Evolution
The Carbon Accounting Market has witnessed substantial growth over the past five years (2019-2024), with a Compound Annual Growth Rate (CAGR) of xx%. This growth is attributed to a confluence of factors, including increasing awareness of climate change, stricter environmental regulations like the EU's Taxonomy and the SEC's climate-related disclosures, and rising demand for transparent sustainability reporting. Technological advancements, particularly in AI and machine learning, are enhancing the accuracy and efficiency of carbon accounting processes. Consumer demand for sustainable products and services is driving businesses to adopt carbon accounting solutions to measure and reduce their environmental impact. The market is expected to continue its robust growth trajectory, with a projected CAGR of xx% from 2025 to 2033, driven by increasing regulatory pressure, technological advancements, and growing adoption across various industries.
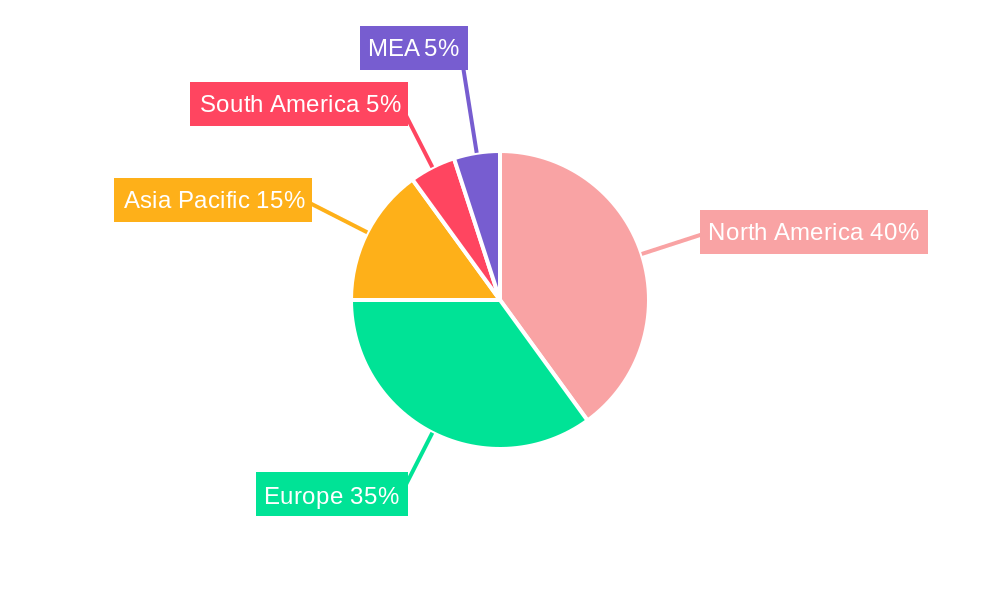
Leading Regions, Countries, or Segments in Carbon Accounting Market
The North American region currently holds the largest market share, followed by Europe. This dominance is primarily due to stringent environmental regulations, strong corporate sustainability initiatives, and a higher level of awareness regarding climate change. Within end-users, the Oil and Gas, and Power Utilities sectors are leading adopters due to their significant carbon footprints and regulatory scrutiny. The Cloud-Based segment dominates the market due to its scalability, accessibility, and cost-effectiveness.
- Key Drivers:
- North America: Stringent regulations (e.g., SEC climate disclosures), high corporate social responsibility awareness, significant investments in clean energy technologies.
- Europe: EU Taxonomy, carbon pricing mechanisms, strong focus on sustainability across various industries.
- Oil and Gas: Regulatory compliance needs, pressure from investors, growing focus on carbon reduction strategies.
- Cloud-Based: Scalability, cost-effectiveness, ease of integration with existing systems.
Carbon Accounting Market Product Innovations
The carbon accounting market is experiencing rapid innovation, driven by the increasing demand for accurate and efficient emissions tracking. Recent advancements leverage artificial intelligence (AI) for sophisticated data analysis, automating data collection processes previously reliant on manual entry and spreadsheets. This automation significantly reduces the time and resources required for accurate carbon accounting, allowing businesses to focus on emission reduction strategies rather than data management. User-friendly interfaces are becoming the standard, simplifying adoption even for organizations with limited internal expertise. These innovative solutions increasingly incorporate functionalities crucial for comprehensive carbon accounting, including precise Scope 1, 2, and 3 emissions calculations, real-time data visualization dashboards for immediate insights, and robust scenario planning tools to model the impact of various emission reduction strategies. Unique selling propositions frequently highlight streamlined data integration capabilities, minimizing manual effort and maximizing efficiency. The resulting insightful reports empower data-driven decision-making, accelerating the transition to a low-carbon economy.
Propelling Factors for Carbon Accounting Market Growth
Several factors are driving the growth of the carbon accounting market. Stringent environmental regulations worldwide are making carbon accounting mandatory or highly recommended for many businesses. Increasing investor pressure for transparent ESG (environmental, social, and governance) reporting compels companies to adopt carbon accounting solutions. Technological advancements, such as AI and cloud computing, are improving the accuracy, efficiency, and cost-effectiveness of carbon accounting. Furthermore, the growing awareness among consumers about climate change and corporate social responsibility is pushing companies to proactively manage their carbon footprint.
Obstacles in the Carbon Accounting Market
Despite the significant growth and potential of the carbon accounting market, several challenges persist. The inherent complexity of carbon accounting methodologies and the diverse data sources required pose a significant barrier to entry, particularly for small and medium-sized enterprises (SMEs) lacking dedicated resources. The lack of universally standardized data formats and reporting frameworks across different jurisdictions creates interoperability issues, hindering seamless data exchange and comparison. High implementation costs for comprehensive carbon accounting solutions, particularly those integrating advanced features like AI-powered analysis and scenario planning, can deter adoption. Furthermore, the increasingly competitive market landscape, with numerous new entrants vying for market share, puts pressure on pricing and profit margins for established players.
Future Opportunities in Carbon Accounting Market
Future opportunities lie in the expansion into emerging markets, particularly in developing countries with increasing industrialization and environmental concerns. The integration of carbon accounting with other ESG data management platforms and the development of more sophisticated analytical tools, including predictive modelling and scenario planning, are key opportunities. Furthermore, leveraging blockchain technology for enhanced data security and transparency can provide a competitive edge. The increasing demand for Scope 3 emissions accounting will also create significant market opportunities.
Major Players in the Carbon Accounting Market Ecosystem
- Normative
- Carbon Direct
- Greenly
- ENGIE Impact
- Sphera
- SINAI Technologies
- Persefoni AI
- Emitwise
- International Business Machines Corporation
- Diligent Corporation
Key Developments in Carbon Accounting Market Industry
- March 2024: Greenly secured USD 52 Million in Series B funding to fuel further development of its carbon accounting methodologies and expand its global reach, indicating significant investor confidence in the sector's growth potential.
- March 2024: Green Project Technologies launched a white-label carbon accounting solution, a strategic move to expand market access and integration within the broader ESG service provider ecosystem. This signifies a growing trend towards collaborative solutions and partnerships in the carbon accounting market.
Strategic Carbon Accounting Market Forecast
The Carbon Accounting Market is poised for continued strong growth, driven by escalating regulatory requirements, rising corporate sustainability initiatives, and technological advancements. The increasing demand for accurate and transparent carbon footprint measurement will fuel market expansion across various sectors. The integration of AI and machine learning will further enhance the precision and efficiency of carbon accounting solutions, creating new opportunities for market players. The market is projected to reach USD xx Million by 2033.
Carbon Accounting Market Segmentation
-
1. Type
- 1.1. Cloud Based
- 1.2. On Premise
-
2. End Users
- 2.1. Oil and Gas
- 2.2. Power Utilities
- 2.3. Construction and Infrastructure
- 2.4. Telecommunication
- 2.5. Food and Beverages
- 2.6. Other End Users
Carbon Accounting Market Segmentation By Geography
-
1. North America
- 1.1. United States
- 1.2. Canada
- 1.3. Rest of North America
-
2. Europe
- 2.1. Germany
- 2.2. France
- 2.3. United Kingdom
- 2.4. Italy
- 2.5. Spain
- 2.6. NORDIC
- 2.7. Russia
- 2.8. Turkey
- 2.9. Rest of Europe
-
3. Asia Pacific
- 3.1. China
- 3.2. India
- 3.3. Australia
- 3.4. Japan
- 3.5. South Korea
- 3.6. Malaysia
- 3.7. Thailand
- 3.8. Indonesia
- 3.9. Vietnam
- 3.10. Rest of Asia Pacific
-
4. Middle East and Africa
- 4.1. Saudi Arabia
- 4.2. United Arab Emirates
- 4.3. Nigeria
- 4.4. Egypt
- 4.5. Qatar
- 4.6. South Africa
- 4.7. Rest of Middle East and Africa
-
5. South America
- 5.1. Brazil
- 5.2. Argentina
- 5.3. Colombia
- 5.4. Rest of South America
Carbon Accounting Market Regional Market Share
Geographic Coverage of Carbon Accounting Market
Carbon Accounting Market REPORT HIGHLIGHTS
| Aspects | Details |
|---|---|
| Study Period | 2020-2034 |
| Base Year | 2025 |
| Estimated Year | 2026 |
| Forecast Period | 2026-2034 |
| Historical Period | 2020-2025 |
| Growth Rate | CAGR of 29.33% from 2020-2034 |
| Segmentation |
|
Table of Contents
- 1. Introduction
- 1.1. Research Scope
- 1.2. Market Segmentation
- 1.3. Research Objective
- 1.4. Definitions and Assumptions
- 2. Executive Summary
- 2.1. Market Snapshot
- 3. Market Dynamics
- 3.1. Market Drivers
- 3.2. Market Restrains
- 3.3. Market Trends
- 3.4. Market Opportunities
- 4. Market Factor Analysis
- 4.1. Porters Five Forces
- 4.1.1. Bargaining Power of Suppliers
- 4.1.2. Bargaining Power of Buyers
- 4.1.3. Threat of New Entrants
- 4.1.4. Threat of Substitutes
- 4.1.5. Competitive Rivalry
- 4.2. PESTEL analysis
- 4.3. BCG Analysis
- 4.3.1. Stars (High Growth, High Market Share)
- 4.3.2. Cash Cows (Low Growth, High Market Share)
- 4.3.3. Question Mark (High Growth, Low Market Share)
- 4.3.4. Dogs (Low Growth, Low Market Share)
- 4.4. Ansoff Matrix Analysis
- 4.5. Supply Chain Analysis
- 4.6. Regulatory Landscape
- 4.7. Current Market Potential and Opportunity Assessment (TAM–SAM–SOM Framework)
- 4.8. DMV Analyst Note
- 4.1. Porters Five Forces
- 5. Market Analysis, Insights and Forecast 2021-2033
- 5.1. Market Analysis, Insights and Forecast - by Type
- 5.1.1. Cloud Based
- 5.1.2. On Premise
- 5.2. Market Analysis, Insights and Forecast - by End Users
- 5.2.1. Oil and Gas
- 5.2.2. Power Utilities
- 5.2.3. Construction and Infrastructure
- 5.2.4. Telecommunication
- 5.2.5. Food and Beverages
- 5.2.6. Other End Users
- 5.3. Market Analysis, Insights and Forecast - by Region
- 5.3.1. North America
- 5.3.2. Europe
- 5.3.3. Asia Pacific
- 5.3.4. Middle East and Africa
- 5.3.5. South America
- 5.1. Market Analysis, Insights and Forecast - by Type
- 6. Global Carbon Accounting Market Analysis, Insights and Forecast, 2021-2033
- 6.1. Market Analysis, Insights and Forecast - by Type
- 6.1.1. Cloud Based
- 6.1.2. On Premise
- 6.2. Market Analysis, Insights and Forecast - by End Users
- 6.2.1. Oil and Gas
- 6.2.2. Power Utilities
- 6.2.3. Construction and Infrastructure
- 6.2.4. Telecommunication
- 6.2.5. Food and Beverages
- 6.2.6. Other End Users
- 6.1. Market Analysis, Insights and Forecast - by Type
- 7. North America Carbon Accounting Market Analysis, Insights and Forecast, 2020-2032
- 7.1. Market Analysis, Insights and Forecast - by Type
- 7.1.1. Cloud Based
- 7.1.2. On Premise
- 7.2. Market Analysis, Insights and Forecast - by End Users
- 7.2.1. Oil and Gas
- 7.2.2. Power Utilities
- 7.2.3. Construction and Infrastructure
- 7.2.4. Telecommunication
- 7.2.5. Food and Beverages
- 7.2.6. Other End Users
- 7.1. Market Analysis, Insights and Forecast - by Type
- 8. Europe Carbon Accounting Market Analysis, Insights and Forecast, 2020-2032
- 8.1. Market Analysis, Insights and Forecast - by Type
- 8.1.1. Cloud Based
- 8.1.2. On Premise
- 8.2. Market Analysis, Insights and Forecast - by End Users
- 8.2.1. Oil and Gas
- 8.2.2. Power Utilities
- 8.2.3. Construction and Infrastructure
- 8.2.4. Telecommunication
- 8.2.5. Food and Beverages
- 8.2.6. Other End Users
- 8.1. Market Analysis, Insights and Forecast - by Type
- 9. Asia Pacific Carbon Accounting Market Analysis, Insights and Forecast, 2020-2032
- 9.1. Market Analysis, Insights and Forecast - by Type
- 9.1.1. Cloud Based
- 9.1.2. On Premise
- 9.2. Market Analysis, Insights and Forecast - by End Users
- 9.2.1. Oil and Gas
- 9.2.2. Power Utilities
- 9.2.3. Construction and Infrastructure
- 9.2.4. Telecommunication
- 9.2.5. Food and Beverages
- 9.2.6. Other End Users
- 9.1. Market Analysis, Insights and Forecast - by Type
- 10. Middle East and Africa Carbon Accounting Market Analysis, Insights and Forecast, 2020-2032
- 10.1. Market Analysis, Insights and Forecast - by Type
- 10.1.1. Cloud Based
- 10.1.2. On Premise
- 10.2. Market Analysis, Insights and Forecast - by End Users
- 10.2.1. Oil and Gas
- 10.2.2. Power Utilities
- 10.2.3. Construction and Infrastructure
- 10.2.4. Telecommunication
- 10.2.5. Food and Beverages
- 10.2.6. Other End Users
- 10.1. Market Analysis, Insights and Forecast - by Type
- 11. South America Carbon Accounting Market Analysis, Insights and Forecast, 2020-2032
- 11.1. Market Analysis, Insights and Forecast - by Type
- 11.1.1. Cloud Based
- 11.1.2. On Premise
- 11.2. Market Analysis, Insights and Forecast - by End Users
- 11.2.1. Oil and Gas
- 11.2.2. Power Utilities
- 11.2.3. Construction and Infrastructure
- 11.2.4. Telecommunication
- 11.2.5. Food and Beverages
- 11.2.6. Other End Users
- 11.1. Market Analysis, Insights and Forecast - by Type
- 12. Competitive Analysis
- 12.1. Company Profiles
- 12.1.1 Normative
- 12.1.1.1. Company Overview
- 12.1.1.2. Products
- 12.1.1.3. Company Financials
- 12.1.1.4. SWOT Analysis
- 12.1.2 Carbon Direct
- 12.1.2.1. Company Overview
- 12.1.2.2. Products
- 12.1.2.3. Company Financials
- 12.1.2.4. SWOT Analysis
- 12.1.3 Greenly
- 12.1.3.1. Company Overview
- 12.1.3.2. Products
- 12.1.3.3. Company Financials
- 12.1.3.4. SWOT Analysis
- 12.1.4 ENGIE Impact
- 12.1.4.1. Company Overview
- 12.1.4.2. Products
- 12.1.4.3. Company Financials
- 12.1.4.4. SWOT Analysis
- 12.1.5 Sphera
- 12.1.5.1. Company Overview
- 12.1.5.2. Products
- 12.1.5.3. Company Financials
- 12.1.5.4. SWOT Analysis
- 12.1.6 SINAI Technologies
- 12.1.6.1. Company Overview
- 12.1.6.2. Products
- 12.1.6.3. Company Financials
- 12.1.6.4. SWOT Analysis
- 12.1.7 Persefoni AI
- 12.1.7.1. Company Overview
- 12.1.7.2. Products
- 12.1.7.3. Company Financials
- 12.1.7.4. SWOT Analysis
- 12.1.8 Emitwise
- 12.1.8.1. Company Overview
- 12.1.8.2. Products
- 12.1.8.3. Company Financials
- 12.1.8.4. SWOT Analysis
- 12.1.9 International Business Machines Corporation
- 12.1.9.1. Company Overview
- 12.1.9.2. Products
- 12.1.9.3. Company Financials
- 12.1.9.4. SWOT Analysis
- 12.1.10 Diligent Corporation
- 12.1.10.1. Company Overview
- 12.1.10.2. Products
- 12.1.10.3. Company Financials
- 12.1.10.4. SWOT Analysis
- 12.1.1 Normative
- 12.2. Market Entropy
- 12.2.1 Company's Key Areas Served
- 12.2.2 Recent Developments
- 12.3. Company Market Share Analysis 2025
- 12.3.1 Top 5 Companies Market Share Analysis
- 12.3.2 Top 3 Companies Market Share Analysis
- 12.4. List of Potential Customers
- 13. Research Methodology
List of Figures
- Figure 1: Global Carbon Accounting Market Revenue Breakdown (Million, %) by Region 2025 & 2033
- Figure 2: North America Carbon Accounting Market Revenue (Million), by Type 2025 & 2033
- Figure 3: North America Carbon Accounting Market Revenue Share (%), by Type 2025 & 2033
- Figure 4: North America Carbon Accounting Market Revenue (Million), by End Users 2025 & 2033
- Figure 5: North America Carbon Accounting Market Revenue Share (%), by End Users 2025 & 2033
- Figure 6: North America Carbon Accounting Market Revenue (Million), by Country 2025 & 2033
- Figure 7: North America Carbon Accounting Market Revenue Share (%), by Country 2025 & 2033
- Figure 8: Europe Carbon Accounting Market Revenue (Million), by Type 2025 & 2033
- Figure 9: Europe Carbon Accounting Market Revenue Share (%), by Type 2025 & 2033
- Figure 10: Europe Carbon Accounting Market Revenue (Million), by End Users 2025 & 2033
- Figure 11: Europe Carbon Accounting Market Revenue Share (%), by End Users 2025 & 2033
- Figure 12: Europe Carbon Accounting Market Revenue (Million), by Country 2025 & 2033
- Figure 13: Europe Carbon Accounting Market Revenue Share (%), by Country 2025 & 2033
- Figure 14: Asia Pacific Carbon Accounting Market Revenue (Million), by Type 2025 & 2033
- Figure 15: Asia Pacific Carbon Accounting Market Revenue Share (%), by Type 2025 & 2033
- Figure 16: Asia Pacific Carbon Accounting Market Revenue (Million), by End Users 2025 & 2033
- Figure 17: Asia Pacific Carbon Accounting Market Revenue Share (%), by End Users 2025 & 2033
- Figure 18: Asia Pacific Carbon Accounting Market Revenue (Million), by Country 2025 & 2033
- Figure 19: Asia Pacific Carbon Accounting Market Revenue Share (%), by Country 2025 & 2033
- Figure 20: Middle East and Africa Carbon Accounting Market Revenue (Million), by Type 2025 & 2033
- Figure 21: Middle East and Africa Carbon Accounting Market Revenue Share (%), by Type 2025 & 2033
- Figure 22: Middle East and Africa Carbon Accounting Market Revenue (Million), by End Users 2025 & 2033
- Figure 23: Middle East and Africa Carbon Accounting Market Revenue Share (%), by End Users 2025 & 2033
- Figure 24: Middle East and Africa Carbon Accounting Market Revenue (Million), by Country 2025 & 2033
- Figure 25: Middle East and Africa Carbon Accounting Market Revenue Share (%), by Country 2025 & 2033
- Figure 26: South America Carbon Accounting Market Revenue (Million), by Type 2025 & 2033
- Figure 27: South America Carbon Accounting Market Revenue Share (%), by Type 2025 & 2033
- Figure 28: South America Carbon Accounting Market Revenue (Million), by End Users 2025 & 2033
- Figure 29: South America Carbon Accounting Market Revenue Share (%), by End Users 2025 & 2033
- Figure 30: South America Carbon Accounting Market Revenue (Million), by Country 2025 & 2033
- Figure 31: South America Carbon Accounting Market Revenue Share (%), by Country 2025 & 2033
List of Tables
- Table 1: Global Carbon Accounting Market Revenue Million Forecast, by Type 2020 & 2033
- Table 2: Global Carbon Accounting Market Revenue Million Forecast, by End Users 2020 & 2033
- Table 3: Global Carbon Accounting Market Revenue Million Forecast, by Region 2020 & 2033
- Table 4: Global Carbon Accounting Market Revenue Million Forecast, by Type 2020 & 2033
- Table 5: Global Carbon Accounting Market Revenue Million Forecast, by End Users 2020 & 2033
- Table 6: Global Carbon Accounting Market Revenue Million Forecast, by Country 2020 & 2033
- Table 7: United States Carbon Accounting Market Revenue (Million) Forecast, by Application 2020 & 2033
- Table 8: Canada Carbon Accounting Market Revenue (Million) Forecast, by Application 2020 & 2033
- Table 9: Rest of North America Carbon Accounting Market Revenue (Million) Forecast, by Application 2020 & 2033
- Table 10: Global Carbon Accounting Market Revenue Million Forecast, by Type 2020 & 2033
- Table 11: Global Carbon Accounting Market Revenue Million Forecast, by End Users 2020 & 2033
- Table 12: Global Carbon Accounting Market Revenue Million Forecast, by Country 2020 & 2033
- Table 13: Germany Carbon Accounting Market Revenue (Million) Forecast, by Application 2020 & 2033
- Table 14: France Carbon Accounting Market Revenue (Million) Forecast, by Application 2020 & 2033
- Table 15: United Kingdom Carbon Accounting Market Revenue (Million) Forecast, by Application 2020 & 2033
- Table 16: Italy Carbon Accounting Market Revenue (Million) Forecast, by Application 2020 & 2033
- Table 17: Spain Carbon Accounting Market Revenue (Million) Forecast, by Application 2020 & 2033
- Table 18: NORDIC Carbon Accounting Market Revenue (Million) Forecast, by Application 2020 & 2033
- Table 19: Russia Carbon Accounting Market Revenue (Million) Forecast, by Application 2020 & 2033
- Table 20: Turkey Carbon Accounting Market Revenue (Million) Forecast, by Application 2020 & 2033
- Table 21: Rest of Europe Carbon Accounting Market Revenue (Million) Forecast, by Application 2020 & 2033
- Table 22: Global Carbon Accounting Market Revenue Million Forecast, by Type 2020 & 2033
- Table 23: Global Carbon Accounting Market Revenue Million Forecast, by End Users 2020 & 2033
- Table 24: Global Carbon Accounting Market Revenue Million Forecast, by Country 2020 & 2033
- Table 25: China Carbon Accounting Market Revenue (Million) Forecast, by Application 2020 & 2033
- Table 26: India Carbon Accounting Market Revenue (Million) Forecast, by Application 2020 & 2033
- Table 27: Australia Carbon Accounting Market Revenue (Million) Forecast, by Application 2020 & 2033
- Table 28: Japan Carbon Accounting Market Revenue (Million) Forecast, by Application 2020 & 2033
- Table 29: South Korea Carbon Accounting Market Revenue (Million) Forecast, by Application 2020 & 2033
- Table 30: Malaysia Carbon Accounting Market Revenue (Million) Forecast, by Application 2020 & 2033
- Table 31: Thailand Carbon Accounting Market Revenue (Million) Forecast, by Application 2020 & 2033
- Table 32: Indonesia Carbon Accounting Market Revenue (Million) Forecast, by Application 2020 & 2033
- Table 33: Vietnam Carbon Accounting Market Revenue (Million) Forecast, by Application 2020 & 2033
- Table 34: Rest of Asia Pacific Carbon Accounting Market Revenue (Million) Forecast, by Application 2020 & 2033
- Table 35: Global Carbon Accounting Market Revenue Million Forecast, by Type 2020 & 2033
- Table 36: Global Carbon Accounting Market Revenue Million Forecast, by End Users 2020 & 2033
- Table 37: Global Carbon Accounting Market Revenue Million Forecast, by Country 2020 & 2033
- Table 38: Saudi Arabia Carbon Accounting Market Revenue (Million) Forecast, by Application 2020 & 2033
- Table 39: United Arab Emirates Carbon Accounting Market Revenue (Million) Forecast, by Application 2020 & 2033
- Table 40: Nigeria Carbon Accounting Market Revenue (Million) Forecast, by Application 2020 & 2033
- Table 41: Egypt Carbon Accounting Market Revenue (Million) Forecast, by Application 2020 & 2033
- Table 42: Qatar Carbon Accounting Market Revenue (Million) Forecast, by Application 2020 & 2033
- Table 43: South Africa Carbon Accounting Market Revenue (Million) Forecast, by Application 2020 & 2033
- Table 44: Rest of Middle East and Africa Carbon Accounting Market Revenue (Million) Forecast, by Application 2020 & 2033
- Table 45: Global Carbon Accounting Market Revenue Million Forecast, by Type 2020 & 2033
- Table 46: Global Carbon Accounting Market Revenue Million Forecast, by End Users 2020 & 2033
- Table 47: Global Carbon Accounting Market Revenue Million Forecast, by Country 2020 & 2033
- Table 48: Brazil Carbon Accounting Market Revenue (Million) Forecast, by Application 2020 & 2033
- Table 49: Argentina Carbon Accounting Market Revenue (Million) Forecast, by Application 2020 & 2033
- Table 50: Colombia Carbon Accounting Market Revenue (Million) Forecast, by Application 2020 & 2033
- Table 51: Rest of South America Carbon Accounting Market Revenue (Million) Forecast, by Application 2020 & 2033
Frequently Asked Questions
1. What is the projected Compound Annual Growth Rate (CAGR) of the Carbon Accounting Market?
The projected CAGR is approximately 29.33%.
2. Which companies are prominent players in the Carbon Accounting Market?
Key companies in the market include Normative, Carbon Direct, Greenly, ENGIE Impact, Sphera, SINAI Technologies, Persefoni AI, Emitwise, International Business Machines Corporation, Diligent Corporation.
3. What are the main segments of the Carbon Accounting Market?
The market segments include Type, End Users.
4. Can you provide details about the market size?
The market size is estimated to be USD 16.98 Million as of 2022.
5. What are some drivers contributing to market growth?
4.; Corporate Sustainability Goals4.; Stringent Regultions and Compliance.
6. What are the notable trends driving market growth?
The Power Utilities Segment to Witness Significant Growth.
7. Are there any restraints impacting market growth?
4.; High Complexity in Carbon Accounting.
8. Can you provide examples of recent developments in the market?
March 2024: Greenly, a significant carbon accounting startup, announced that it secured funding for its series B round. The company raised USD 52 million in its Series B round. Investors aim to develop more precise carbon accounting methodologies and accurately deploy these solutions to increase the company’s market share globally.
9. What pricing options are available for accessing the report?
Pricing options include single-user, multi-user, and enterprise licenses priced at USD 4750, USD 5250, and USD 8750 respectively.
10. Is the market size provided in terms of value or volume?
The market size is provided in terms of value, measured in Million.
11. Are there any specific market keywords associated with the report?
Yes, the market keyword associated with the report is "Carbon Accounting Market," which aids in identifying and referencing the specific market segment covered.
12. How do I determine which pricing option suits my needs best?
The pricing options vary based on user requirements and access needs. Individual users may opt for single-user licenses, while businesses requiring broader access may choose multi-user or enterprise licenses for cost-effective access to the report.
13. Are there any additional resources or data provided in the Carbon Accounting Market report?
While the report offers comprehensive insights, it's advisable to review the specific contents or supplementary materials provided to ascertain if additional resources or data are available.
14. How can I stay updated on further developments or reports in the Carbon Accounting Market?
To stay informed about further developments, trends, and reports in the Carbon Accounting Market, consider subscribing to industry newsletters, following relevant companies and organizations, or regularly checking reputable industry news sources and publications.
Methodology
Step 1 - Identification of Relevant Samples Size from Population Database


Step 2 - Approaches for Defining Global Market Size (Value, Volume* & Price*)

Note*: In applicable scenarios
Step 3 - Data Sources
Primary Research
- Web Analytics
- Survey Reports
- Research Institute
- Latest Research Reports
- Opinion Leaders
Secondary Research
- Annual Reports
- White Paper
- Latest Press Release
- Industry Association
- Paid Database
- Investor Presentations

Step 4 - Data Triangulation
Involves using different sources of information in order to increase the validity of a study
These sources are likely to be stakeholders in a program - participants, other researchers, program staff, other community members, and so on.
Then we put all data in single framework & apply various statistical tools to find out the dynamic on the market.
During the analysis stage, feedback from the stakeholder groups would be compared to determine areas of agreement as well as areas of divergence