

Key Insights
The global biotherapeutics cell line development market is projected to reach $8.2 billion by 2033, exhibiting a compound annual growth rate (CAGR) of 10.2% from the base year 2025. This growth is propelled by the escalating demand for biologics and significant advancements in cell line engineering technologies. Key drivers include the rising incidence of chronic diseases, necessitating novel therapeutic solutions, and the increasing adoption of advanced cell line platforms such as CHO and HEK cells, which enhance productivity and cost-efficiency. Furthermore, substantial R&D investments by pharmaceutical and biotechnology firms, alongside supportive regulatory environments, are fueling market expansion. Despite challenges like high development costs and stringent regulatory approvals, the market's long-term outlook remains robust. The market likely encompasses services including cell line engineering, cell banking, and process development, serving therapeutic areas like oncology, immunology, and infectious diseases. The established presence of major players indicates a dynamic market ripe for innovation and consolidation.
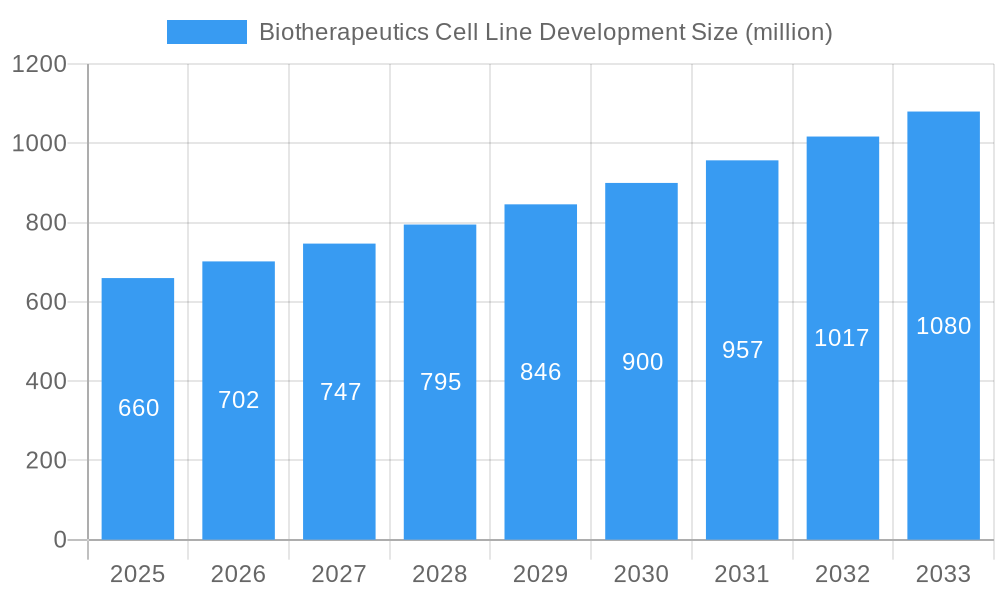
Biotherapeutics Cell Line Development Market Size (In Billion)
Geographically, North America and Europe are anticipated to lead the market due to their robust research infrastructure, advanced healthcare systems, and significant pharmaceutical hubs. Emerging economies in Asia-Pacific and other regions present considerable growth potential as healthcare infrastructure develops and demand for affordable biologics rises. The forecast period will likely see intensified competition, leading to strategic collaborations, mergers and acquisitions, and technological innovations focused on accelerating and optimizing cell line development processes. The integration of automation, AI, and big data analytics is expected to improve process efficiency and reduce time-to-market. The sustained demand for novel biotherapeutics and continuous technological progress position the biotherapeutics cell line development market for sustained and substantial growth.
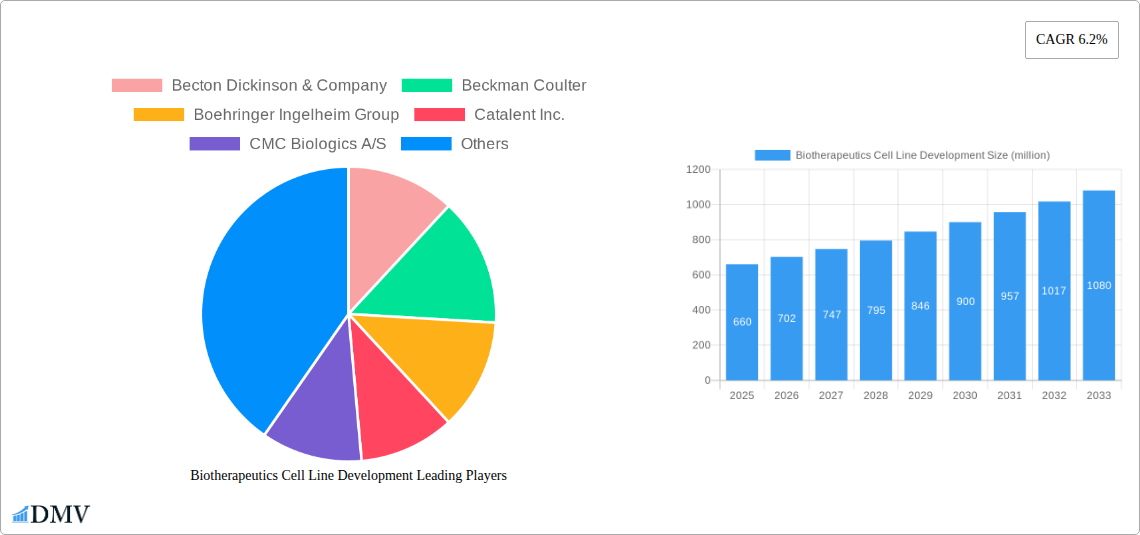
Biotherapeutics Cell Line Development Company Market Share
Biotherapeutics Cell Line Development Market Report: 2019-2033
This comprehensive report provides an in-depth analysis of the global biotherapeutics cell line development market, projecting a market value exceeding $XX million by 2033. The study period covers 2019-2033, with 2025 as the base and estimated year. The report offers invaluable insights for stakeholders, including pharmaceutical companies, biotech firms, investors, and regulatory bodies, seeking to navigate this rapidly evolving landscape. Key players like Becton Dickinson & Company, Beckman Coulter, Boehringer Ingelheim Group, and others are profiled, providing a complete picture of the competitive dynamics.
Biotherapeutics Cell Line Development Market Composition & Trends
This section delves into the intricate structure of the biotherapeutics cell line development market, analyzing its concentration, innovative drivers, regulatory environment, substitute products, end-user profiles, and mergers & acquisitions (M&A) activities. We examine the market share distribution among key players, revealing a moderately concentrated market with several dominant players commanding significant portions. M&A activity is assessed using deal values, identifying key trends and their impact on the competitive landscape. For example, the xx million acquisition of Company X by Company Y illustrates the industry's consolidation trend. Innovation catalysts, such as advancements in gene editing technologies and automation, are highlighted, along with their effect on market growth. Regulatory landscapes vary significantly across regions; the report offers a detailed comparison, highlighting implications for market expansion. Finally, emerging substitute products and their potential market impact are discussed in detail. The report also analyzes end-user profiles (pharmaceutical and biotech companies) and their specific needs within the market.
Biotherapeutics Cell Line Development Industry Evolution
This section provides a comprehensive overview of the biotherapeutics cell line development market's evolutionary journey. Analyzing historical data from 2019-2024, and projecting growth trajectories up to 2033, this section highlights technological advancements driving market expansion. The report quantifies the impact of these innovations, including specific growth rates and adoption metrics for key technologies. We will analyze shifting consumer demands – particularly a growing emphasis on speed and efficiency in drug development – and assess their influence on industry practices and the market as a whole. The section also covers the impact of technological advancements, such as CRISPR-Cas9 gene editing and automation in cell line development, on market growth. For instance, the adoption of automated platforms has increased efficiency by xx%, leading to a market expansion of xx million during the period 2020-2024.
Leading Regions, Countries, or Segments in Biotherapeutics Cell Line Development
This section pinpoints the leading regions, countries, or segments in the biotherapeutics cell line development market. Through detailed analysis, we identify the dominant region(s) and pinpoint the factors driving their success.
- Key Drivers:
- Favorable regulatory environments and supportive government policies (e.g., tax incentives, grants).
- High levels of research and development investment by both government and private entities.
- A strong presence of major pharmaceutical and biotechnology companies.
- A skilled workforce with extensive expertise in cell line development.
- In-Depth Analysis: This section will delve into the reasons behind the dominance of the leading regions, incorporating statistical evidence and qualitative insights. For instance, the high concentration of pharmaceutical companies in the United States and Europe contributes significantly to this dominance. The report will also evaluate the influence of favorable regulatory landscapes, specifically focusing on the approval processes for biotherapeutics and their impact on market growth.
Biotherapeutics Cell Line Development Product Innovations
This section showcases recent product innovations, including novel cell lines, advanced media formulations, and automated platforms. It details specific applications of these innovations, such as the development of more effective and efficient biotherapeutics for various diseases. Performance metrics, including increased yield, improved stability, and reduced manufacturing costs, are analyzed. Key innovations, such as the development of xx cell line with improved productivity and reduced manufacturing costs, and their impact on market growth, are highlighted. The unique selling propositions and technological advancements that position these products for success in the market are explicitly mentioned.
Propelling Factors for Biotherapeutics Cell Line Development Growth
Several factors contribute to the robust growth of the biotherapeutics cell line development market. Technological advancements, such as CRISPR-Cas9 gene editing and automation, significantly enhance efficiency and cost-effectiveness, fueling market expansion. The increasing prevalence of chronic diseases and rising demand for biotherapeutics create a favorable environment for growth. Furthermore, supportive regulatory policies and increased funding for research and development initiatives accelerate market growth. The rising prevalence of chronic diseases such as cancer and autoimmune disorders significantly drives market demand, alongside government initiatives promoting biopharmaceutical research and development.
Obstacles in the Biotherapeutics Cell Line Development Market
Despite the growth potential, several obstacles hinder market expansion. Stringent regulatory approvals pose challenges, requiring significant time and resources for market entry. Supply chain disruptions caused by geopolitical instability or unforeseen events can impact production and delivery. Intense competition among established players and emerging companies further complicates market dynamics. The overall impact of these challenges on market growth is quantified, providing a realistic assessment of the market's future trajectory.
Future Opportunities in Biotherapeutics Cell Line Development
The future holds significant opportunities for growth in the biotherapeutics cell line development market. Expanding into new therapeutic areas, such as gene therapy and cell therapy, presents promising avenues for expansion. Advancements in gene editing technologies and the development of novel cell lines create fertile ground for innovation. The adoption of personalized medicine and increasing demand for customized biotherapeutics further broaden market horizons.
Major Players in the Biotherapeutics Cell Line Development Ecosystem
Key Developments in Biotherapeutics Cell Line Development Industry
- 2022-Q4: Launch of a novel, high-yield cell line by Company X, significantly improving the efficiency of biotherapeutic production.
- 2023-Q1: Acquisition of Company Y by Company Z, leading to increased market consolidation and expansion of service offerings.
- 2023-Q3: FDA approval of a new biotherapeutic manufactured using an innovative cell line, boosting investor confidence and market growth.
- 2024-Q2: Partnership between Company A and Company B, facilitating the development of next-generation cell line technologies. (Further key developments will be included in the full report).
Strategic Biotherapeutics Cell Line Development Market Forecast
The biotherapeutics cell line development market is poised for significant growth, driven by technological advancements and increasing demand for biopharmaceuticals. The market is expected to experience strong growth in the coming years, with major players continuing to invest in research and development. Future opportunities lie in developing advanced cell lines and platforms, further improving efficiency and reducing production costs. The market's potential for innovation, coupled with the rising need for biotherapeutics, ensures a bright future for this dynamic sector.
Biotherapeutics Cell Line Development Segmentation
-
1. Application
- 1.1. In-house
- 1.2. Outsource
- 1.3. Hybrid
- 1.4. Do-It-Yourself (DIY)
-
2. Type
- 2.1. Transfection & Selection
- 2.2. Single Cell Cloning
Biotherapeutics Cell Line Development Segmentation By Geography
-
1. North America
- 1.1. United States
- 1.2. Canada
- 1.3. Mexico
-
2. South America
- 2.1. Brazil
- 2.2. Argentina
- 2.3. Rest of South America
-
3. Europe
- 3.1. United Kingdom
- 3.2. Germany
- 3.3. France
- 3.4. Italy
- 3.5. Spain
- 3.6. Russia
- 3.7. Benelux
- 3.8. Nordics
- 3.9. Rest of Europe
-
4. Middle East & Africa
- 4.1. Turkey
- 4.2. Israel
- 4.3. GCC
- 4.4. North Africa
- 4.5. South Africa
- 4.6. Rest of Middle East & Africa
-
5. Asia Pacific
- 5.1. China
- 5.2. India
- 5.3. Japan
- 5.4. South Korea
- 5.5. ASEAN
- 5.6. Oceania
- 5.7. Rest of Asia Pacific
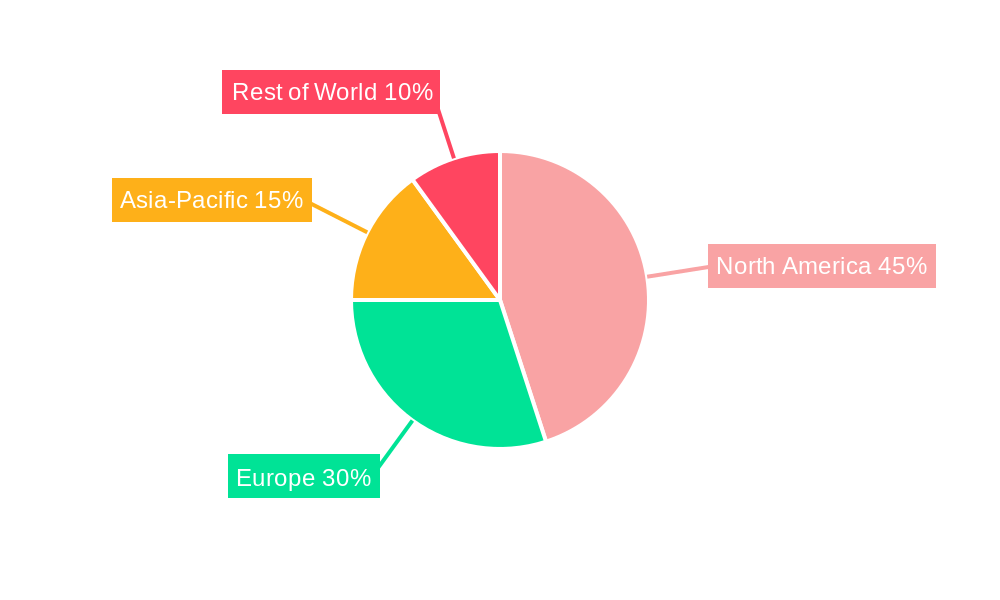
Biotherapeutics Cell Line Development Regional Market Share
Geographic Coverage of Biotherapeutics Cell Line Development
Biotherapeutics Cell Line Development REPORT HIGHLIGHTS
| Aspects | Details |
|---|---|
| Study Period | 2020-2034 |
| Base Year | 2025 |
| Estimated Year | 2026 |
| Forecast Period | 2026-2034 |
| Historical Period | 2020-2025 |
| Growth Rate | CAGR of 10.2% from 2020-2034 |
| Segmentation |
|
Table of Contents
- 1. Introduction
- 1.1. Research Scope
- 1.2. Market Segmentation
- 1.3. Research Methodology
- 1.4. Definitions and Assumptions
- 2. Executive Summary
- 2.1. Introduction
- 3. Market Dynamics
- 3.1. Introduction
- 3.2. Market Drivers
- 3.3. Market Restrains
- 3.4. Market Trends
- 4. Market Factor Analysis
- 4.1. Porters Five Forces
- 4.2. Supply/Value Chain
- 4.3. PESTEL analysis
- 4.4. Market Entropy
- 4.5. Patent/Trademark Analysis
- 5. Global Biotherapeutics Cell Line Development Analysis, Insights and Forecast, 2020-2032
- 5.1. Market Analysis, Insights and Forecast - by Application
- 5.1.1. In-house
- 5.1.2. Outsource
- 5.1.3. Hybrid
- 5.1.4. Do-It-Yourself (DIY)
- 5.2. Market Analysis, Insights and Forecast - by Type
- 5.2.1. Transfection & Selection
- 5.2.2. Single Cell Cloning
- 5.3. Market Analysis, Insights and Forecast - by Region
- 5.3.1. North America
- 5.3.2. South America
- 5.3.3. Europe
- 5.3.4. Middle East & Africa
- 5.3.5. Asia Pacific
- 5.1. Market Analysis, Insights and Forecast - by Application
- 6. North America Biotherapeutics Cell Line Development Analysis, Insights and Forecast, 2020-2032
- 6.1. Market Analysis, Insights and Forecast - by Application
- 6.1.1. In-house
- 6.1.2. Outsource
- 6.1.3. Hybrid
- 6.1.4. Do-It-Yourself (DIY)
- 6.2. Market Analysis, Insights and Forecast - by Type
- 6.2.1. Transfection & Selection
- 6.2.2. Single Cell Cloning
- 6.1. Market Analysis, Insights and Forecast - by Application
- 7. South America Biotherapeutics Cell Line Development Analysis, Insights and Forecast, 2020-2032
- 7.1. Market Analysis, Insights and Forecast - by Application
- 7.1.1. In-house
- 7.1.2. Outsource
- 7.1.3. Hybrid
- 7.1.4. Do-It-Yourself (DIY)
- 7.2. Market Analysis, Insights and Forecast - by Type
- 7.2.1. Transfection & Selection
- 7.2.2. Single Cell Cloning
- 7.1. Market Analysis, Insights and Forecast - by Application
- 8. Europe Biotherapeutics Cell Line Development Analysis, Insights and Forecast, 2020-2032
- 8.1. Market Analysis, Insights and Forecast - by Application
- 8.1.1. In-house
- 8.1.2. Outsource
- 8.1.3. Hybrid
- 8.1.4. Do-It-Yourself (DIY)
- 8.2. Market Analysis, Insights and Forecast - by Type
- 8.2.1. Transfection & Selection
- 8.2.2. Single Cell Cloning
- 8.1. Market Analysis, Insights and Forecast - by Application
- 9. Middle East & Africa Biotherapeutics Cell Line Development Analysis, Insights and Forecast, 2020-2032
- 9.1. Market Analysis, Insights and Forecast - by Application
- 9.1.1. In-house
- 9.1.2. Outsource
- 9.1.3. Hybrid
- 9.1.4. Do-It-Yourself (DIY)
- 9.2. Market Analysis, Insights and Forecast - by Type
- 9.2.1. Transfection & Selection
- 9.2.2. Single Cell Cloning
- 9.1. Market Analysis, Insights and Forecast - by Application
- 10. Asia Pacific Biotherapeutics Cell Line Development Analysis, Insights and Forecast, 2020-2032
- 10.1. Market Analysis, Insights and Forecast - by Application
- 10.1.1. In-house
- 10.1.2. Outsource
- 10.1.3. Hybrid
- 10.1.4. Do-It-Yourself (DIY)
- 10.2. Market Analysis, Insights and Forecast - by Type
- 10.2.1. Transfection & Selection
- 10.2.2. Single Cell Cloning
- 10.1. Market Analysis, Insights and Forecast - by Application
- 11. Competitive Analysis
- 11.1. Global Market Share Analysis 2025
- 11.2. Company Profiles
- 11.2.1 Becton Dickinson & Company
- 11.2.1.1. Overview
- 11.2.1.2. Products
- 11.2.1.3. SWOT Analysis
- 11.2.1.4. Recent Developments
- 11.2.1.5. Financials (Based on Availability)
- 11.2.2 Beckman Coulter
- 11.2.2.1. Overview
- 11.2.2.2. Products
- 11.2.2.3. SWOT Analysis
- 11.2.2.4. Recent Developments
- 11.2.2.5. Financials (Based on Availability)
- 11.2.3 Boehringer Ingelheim Group
- 11.2.3.1. Overview
- 11.2.3.2. Products
- 11.2.3.3. SWOT Analysis
- 11.2.3.4. Recent Developments
- 11.2.3.5. Financials (Based on Availability)
- 11.2.4 Catalent Inc.
- 11.2.4.1. Overview
- 11.2.4.2. Products
- 11.2.4.3. SWOT Analysis
- 11.2.4.4. Recent Developments
- 11.2.4.5. Financials (Based on Availability)
- 11.2.5 CMC Biologics A/S
- 11.2.5.1. Overview
- 11.2.5.2. Products
- 11.2.5.3. SWOT Analysis
- 11.2.5.4. Recent Developments
- 11.2.5.5. Financials (Based on Availability)
- 11.2.6 Lonza Group Ltd.
- 11.2.6.1. Overview
- 11.2.6.2. Products
- 11.2.6.3. SWOT Analysis
- 11.2.6.4. Recent Developments
- 11.2.6.5. Financials (Based on Availability)
- 11.2.7 EMD Millipore
- 11.2.7.1. Overview
- 11.2.7.2. Products
- 11.2.7.3. SWOT Analysis
- 11.2.7.4. Recent Developments
- 11.2.7.5. Financials (Based on Availability)
- 11.2.8 Partec (Sysmex Corporation)
- 11.2.8.1. Overview
- 11.2.8.2. Products
- 11.2.8.3. SWOT Analysis
- 11.2.8.4. Recent Developments
- 11.2.8.5. Financials (Based on Availability)
- 11.2.9 ProBioGen AG
- 11.2.9.1. Overview
- 11.2.9.2. Products
- 11.2.9.3. SWOT Analysis
- 11.2.9.4. Recent Developments
- 11.2.9.5. Financials (Based on Availability)
- 11.2.10 Selexis SA
- 11.2.10.1. Overview
- 11.2.10.2. Products
- 11.2.10.3. SWOT Analysis
- 11.2.10.4. Recent Developments
- 11.2.10.5. Financials (Based on Availability)
- 11.2.11 Sigma-Aldrich Co. LLC.
- 11.2.11.1. Overview
- 11.2.11.2. Products
- 11.2.11.3. SWOT Analysis
- 11.2.11.4. Recent Developments
- 11.2.11.5. Financials (Based on Availability)
- 11.2.12 Sony Biotechnology Inc.
- 11.2.12.1. Overview
- 11.2.12.2. Products
- 11.2.12.3. SWOT Analysis
- 11.2.12.4. Recent Developments
- 11.2.12.5. Financials (Based on Availability)
- 11.2.13 Thermo Fisher Scientific Inc.
- 11.2.13.1. Overview
- 11.2.13.2. Products
- 11.2.13.3. SWOT Analysis
- 11.2.13.4. Recent Developments
- 11.2.13.5. Financials (Based on Availability)
- 11.2.1 Becton Dickinson & Company
List of Figures
- Figure 1: Global Biotherapeutics Cell Line Development Revenue Breakdown (billion, %) by Region 2025 & 2033
- Figure 2: North America Biotherapeutics Cell Line Development Revenue (billion), by Application 2025 & 2033
- Figure 3: North America Biotherapeutics Cell Line Development Revenue Share (%), by Application 2025 & 2033
- Figure 4: North America Biotherapeutics Cell Line Development Revenue (billion), by Type 2025 & 2033
- Figure 5: North America Biotherapeutics Cell Line Development Revenue Share (%), by Type 2025 & 2033
- Figure 6: North America Biotherapeutics Cell Line Development Revenue (billion), by Country 2025 & 2033
- Figure 7: North America Biotherapeutics Cell Line Development Revenue Share (%), by Country 2025 & 2033
- Figure 8: South America Biotherapeutics Cell Line Development Revenue (billion), by Application 2025 & 2033
- Figure 9: South America Biotherapeutics Cell Line Development Revenue Share (%), by Application 2025 & 2033
- Figure 10: South America Biotherapeutics Cell Line Development Revenue (billion), by Type 2025 & 2033
- Figure 11: South America Biotherapeutics Cell Line Development Revenue Share (%), by Type 2025 & 2033
- Figure 12: South America Biotherapeutics Cell Line Development Revenue (billion), by Country 2025 & 2033
- Figure 13: South America Biotherapeutics Cell Line Development Revenue Share (%), by Country 2025 & 2033
- Figure 14: Europe Biotherapeutics Cell Line Development Revenue (billion), by Application 2025 & 2033
- Figure 15: Europe Biotherapeutics Cell Line Development Revenue Share (%), by Application 2025 & 2033
- Figure 16: Europe Biotherapeutics Cell Line Development Revenue (billion), by Type 2025 & 2033
- Figure 17: Europe Biotherapeutics Cell Line Development Revenue Share (%), by Type 2025 & 2033
- Figure 18: Europe Biotherapeutics Cell Line Development Revenue (billion), by Country 2025 & 2033
- Figure 19: Europe Biotherapeutics Cell Line Development Revenue Share (%), by Country 2025 & 2033
- Figure 20: Middle East & Africa Biotherapeutics Cell Line Development Revenue (billion), by Application 2025 & 2033
- Figure 21: Middle East & Africa Biotherapeutics Cell Line Development Revenue Share (%), by Application 2025 & 2033
- Figure 22: Middle East & Africa Biotherapeutics Cell Line Development Revenue (billion), by Type 2025 & 2033
- Figure 23: Middle East & Africa Biotherapeutics Cell Line Development Revenue Share (%), by Type 2025 & 2033
- Figure 24: Middle East & Africa Biotherapeutics Cell Line Development Revenue (billion), by Country 2025 & 2033
- Figure 25: Middle East & Africa Biotherapeutics Cell Line Development Revenue Share (%), by Country 2025 & 2033
- Figure 26: Asia Pacific Biotherapeutics Cell Line Development Revenue (billion), by Application 2025 & 2033
- Figure 27: Asia Pacific Biotherapeutics Cell Line Development Revenue Share (%), by Application 2025 & 2033
- Figure 28: Asia Pacific Biotherapeutics Cell Line Development Revenue (billion), by Type 2025 & 2033
- Figure 29: Asia Pacific Biotherapeutics Cell Line Development Revenue Share (%), by Type 2025 & 2033
- Figure 30: Asia Pacific Biotherapeutics Cell Line Development Revenue (billion), by Country 2025 & 2033
- Figure 31: Asia Pacific Biotherapeutics Cell Line Development Revenue Share (%), by Country 2025 & 2033
List of Tables
- Table 1: Global Biotherapeutics Cell Line Development Revenue billion Forecast, by Application 2020 & 2033
- Table 2: Global Biotherapeutics Cell Line Development Revenue billion Forecast, by Type 2020 & 2033
- Table 3: Global Biotherapeutics Cell Line Development Revenue billion Forecast, by Region 2020 & 2033
- Table 4: Global Biotherapeutics Cell Line Development Revenue billion Forecast, by Application 2020 & 2033
- Table 5: Global Biotherapeutics Cell Line Development Revenue billion Forecast, by Type 2020 & 2033
- Table 6: Global Biotherapeutics Cell Line Development Revenue billion Forecast, by Country 2020 & 2033
- Table 7: United States Biotherapeutics Cell Line Development Revenue (billion) Forecast, by Application 2020 & 2033
- Table 8: Canada Biotherapeutics Cell Line Development Revenue (billion) Forecast, by Application 2020 & 2033
- Table 9: Mexico Biotherapeutics Cell Line Development Revenue (billion) Forecast, by Application 2020 & 2033
- Table 10: Global Biotherapeutics Cell Line Development Revenue billion Forecast, by Application 2020 & 2033
- Table 11: Global Biotherapeutics Cell Line Development Revenue billion Forecast, by Type 2020 & 2033
- Table 12: Global Biotherapeutics Cell Line Development Revenue billion Forecast, by Country 2020 & 2033
- Table 13: Brazil Biotherapeutics Cell Line Development Revenue (billion) Forecast, by Application 2020 & 2033
- Table 14: Argentina Biotherapeutics Cell Line Development Revenue (billion) Forecast, by Application 2020 & 2033
- Table 15: Rest of South America Biotherapeutics Cell Line Development Revenue (billion) Forecast, by Application 2020 & 2033
- Table 16: Global Biotherapeutics Cell Line Development Revenue billion Forecast, by Application 2020 & 2033
- Table 17: Global Biotherapeutics Cell Line Development Revenue billion Forecast, by Type 2020 & 2033
- Table 18: Global Biotherapeutics Cell Line Development Revenue billion Forecast, by Country 2020 & 2033
- Table 19: United Kingdom Biotherapeutics Cell Line Development Revenue (billion) Forecast, by Application 2020 & 2033
- Table 20: Germany Biotherapeutics Cell Line Development Revenue (billion) Forecast, by Application 2020 & 2033
- Table 21: France Biotherapeutics Cell Line Development Revenue (billion) Forecast, by Application 2020 & 2033
- Table 22: Italy Biotherapeutics Cell Line Development Revenue (billion) Forecast, by Application 2020 & 2033
- Table 23: Spain Biotherapeutics Cell Line Development Revenue (billion) Forecast, by Application 2020 & 2033
- Table 24: Russia Biotherapeutics Cell Line Development Revenue (billion) Forecast, by Application 2020 & 2033
- Table 25: Benelux Biotherapeutics Cell Line Development Revenue (billion) Forecast, by Application 2020 & 2033
- Table 26: Nordics Biotherapeutics Cell Line Development Revenue (billion) Forecast, by Application 2020 & 2033
- Table 27: Rest of Europe Biotherapeutics Cell Line Development Revenue (billion) Forecast, by Application 2020 & 2033
- Table 28: Global Biotherapeutics Cell Line Development Revenue billion Forecast, by Application 2020 & 2033
- Table 29: Global Biotherapeutics Cell Line Development Revenue billion Forecast, by Type 2020 & 2033
- Table 30: Global Biotherapeutics Cell Line Development Revenue billion Forecast, by Country 2020 & 2033
- Table 31: Turkey Biotherapeutics Cell Line Development Revenue (billion) Forecast, by Application 2020 & 2033
- Table 32: Israel Biotherapeutics Cell Line Development Revenue (billion) Forecast, by Application 2020 & 2033
- Table 33: GCC Biotherapeutics Cell Line Development Revenue (billion) Forecast, by Application 2020 & 2033
- Table 34: North Africa Biotherapeutics Cell Line Development Revenue (billion) Forecast, by Application 2020 & 2033
- Table 35: South Africa Biotherapeutics Cell Line Development Revenue (billion) Forecast, by Application 2020 & 2033
- Table 36: Rest of Middle East & Africa Biotherapeutics Cell Line Development Revenue (billion) Forecast, by Application 2020 & 2033
- Table 37: Global Biotherapeutics Cell Line Development Revenue billion Forecast, by Application 2020 & 2033
- Table 38: Global Biotherapeutics Cell Line Development Revenue billion Forecast, by Type 2020 & 2033
- Table 39: Global Biotherapeutics Cell Line Development Revenue billion Forecast, by Country 2020 & 2033
- Table 40: China Biotherapeutics Cell Line Development Revenue (billion) Forecast, by Application 2020 & 2033
- Table 41: India Biotherapeutics Cell Line Development Revenue (billion) Forecast, by Application 2020 & 2033
- Table 42: Japan Biotherapeutics Cell Line Development Revenue (billion) Forecast, by Application 2020 & 2033
- Table 43: South Korea Biotherapeutics Cell Line Development Revenue (billion) Forecast, by Application 2020 & 2033
- Table 44: ASEAN Biotherapeutics Cell Line Development Revenue (billion) Forecast, by Application 2020 & 2033
- Table 45: Oceania Biotherapeutics Cell Line Development Revenue (billion) Forecast, by Application 2020 & 2033
- Table 46: Rest of Asia Pacific Biotherapeutics Cell Line Development Revenue (billion) Forecast, by Application 2020 & 2033
Frequently Asked Questions
1. What is the projected Compound Annual Growth Rate (CAGR) of the Biotherapeutics Cell Line Development?
The projected CAGR is approximately 10.2%.
2. Which companies are prominent players in the Biotherapeutics Cell Line Development?
Key companies in the market include Becton Dickinson & Company, Beckman Coulter, Boehringer Ingelheim Group, Catalent Inc., CMC Biologics A/S, Lonza Group Ltd., EMD Millipore, Partec (Sysmex Corporation), ProBioGen AG, Selexis SA, Sigma-Aldrich Co. LLC., Sony Biotechnology Inc., Thermo Fisher Scientific Inc..
3. What are the main segments of the Biotherapeutics Cell Line Development?
The market segments include Application, Type.
4. Can you provide details about the market size?
The market size is estimated to be USD 8.2 billion as of 2022.
5. What are some drivers contributing to market growth?
N/A
6. What are the notable trends driving market growth?
N/A
7. Are there any restraints impacting market growth?
N/A
8. Can you provide examples of recent developments in the market?
N/A
9. What pricing options are available for accessing the report?
Pricing options include single-user, multi-user, and enterprise licenses priced at USD 3950.00, USD 5925.00, and USD 7900.00 respectively.
10. Is the market size provided in terms of value or volume?
The market size is provided in terms of value, measured in billion.
11. Are there any specific market keywords associated with the report?
Yes, the market keyword associated with the report is "Biotherapeutics Cell Line Development," which aids in identifying and referencing the specific market segment covered.
12. How do I determine which pricing option suits my needs best?
The pricing options vary based on user requirements and access needs. Individual users may opt for single-user licenses, while businesses requiring broader access may choose multi-user or enterprise licenses for cost-effective access to the report.
13. Are there any additional resources or data provided in the Biotherapeutics Cell Line Development report?
While the report offers comprehensive insights, it's advisable to review the specific contents or supplementary materials provided to ascertain if additional resources or data are available.
14. How can I stay updated on further developments or reports in the Biotherapeutics Cell Line Development?
To stay informed about further developments, trends, and reports in the Biotherapeutics Cell Line Development, consider subscribing to industry newsletters, following relevant companies and organizations, or regularly checking reputable industry news sources and publications.
Methodology
Step 1 - Identification of Relevant Samples Size from Population Database


Step 2 - Approaches for Defining Global Market Size (Value, Volume* & Price*)

Note*: In applicable scenarios
Step 3 - Data Sources
Primary Research
- Web Analytics
- Survey Reports
- Research Institute
- Latest Research Reports
- Opinion Leaders
Secondary Research
- Annual Reports
- White Paper
- Latest Press Release
- Industry Association
- Paid Database
- Investor Presentations

Step 4 - Data Triangulation
Involves using different sources of information in order to increase the validity of a study
These sources are likely to be stakeholders in a program - participants, other researchers, program staff, other community members, and so on.
Then we put all data in single framework & apply various statistical tools to find out the dynamic on the market.
During the analysis stage, feedback from the stakeholder groups would be compared to determine areas of agreement as well as areas of divergence