

Key Insights
The Asia-Pacific (APAC) probiotic market is experiencing significant expansion, fueled by heightened consumer health awareness, increasing disposable incomes, and a growing understanding of the critical role of gut health. This dynamic market is categorized by product type, including probiotic-rich foods (such as yogurt and fermented beverages) and dietary supplements. Within the food sector, dairy-based probiotic beverages command a substantial market share, driven by regional preferences for dairy and the proliferation of functional food options. Distribution spans traditional retail, pharmacies, and a rapidly growing online marketplace. Leading companies are making strategic investments in the region, leveraging its considerable potential. Despite regulatory complexities and diverse consumer preferences across APAC nations, the market outlook remains optimistic, further supported by the rising incidence of chronic diseases and the widespread adoption of preventative healthcare strategies.
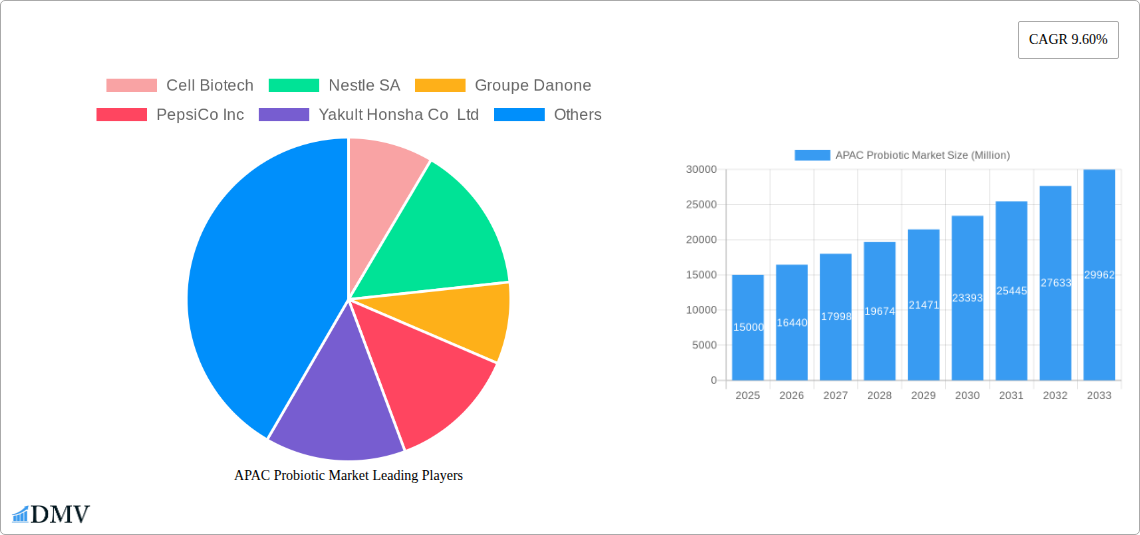
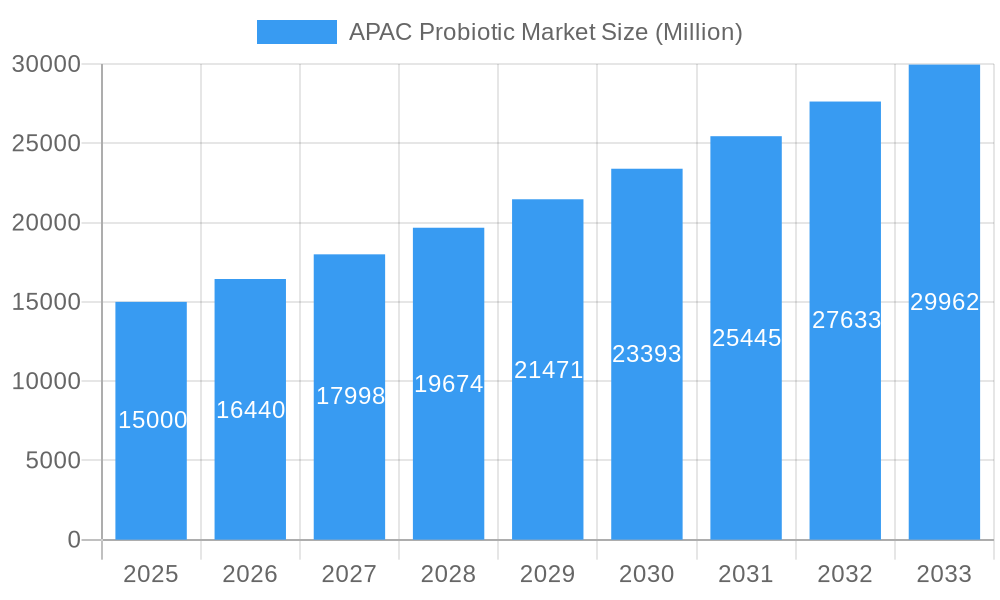
APAC Probiotic Market Market Size (In Billion)
Key growth drivers within APAC include China, India, Japan, and South Korea. These economies exhibit escalating demand for probiotic products, influenced by public health campaigns, increased per capita income enabling greater discretionary health spending, and a strong focus on preventative healthcare. Enhanced modern retail penetration and a flourishing e-commerce sector also contribute to this growth. Additionally, concentrated research and development efforts are stimulating innovation in probiotic formulations, leading to new and more effective products. The competitive environment is robust, with global and local players actively pursuing market share, resulting in greater product variety and improved accessibility. However, challenges persist in ensuring consistent product quality and addressing consumer skepticism regarding probiotic efficacy.
APAC Probiotic Market Company Market Share
The APAC Probiotic Market is projected to reach $86.01 billion by 2025, growing at a Compound Annual Growth Rate (CAGR) of 10.7% from the base year 2025.
APAC Probiotic Market: A Comprehensive Report (2019-2033)
This insightful report provides a comprehensive analysis of the Asia-Pacific (APAC) probiotic market, offering a detailed overview of market size, trends, and future growth projections from 2019 to 2033. The study delves into the diverse segments of the APAC probiotic market, examining key players, emerging technologies, and evolving consumer preferences. With a focus on actionable insights and precise data, this report is an invaluable resource for stakeholders looking to navigate this dynamic and rapidly growing market. The base year for this report is 2025, with an estimated market value of xx Million and a forecast period spanning from 2025 to 2033. The historical period covered is 2019-2024.
APAC Probiotic Market Composition & Trends
This section evaluates the competitive landscape, innovation drivers, regulatory frameworks, substitute products, end-user profiles, and merger & acquisition (M&A) activities within the APAC probiotic market. The market is characterized by a moderate level of concentration, with key players holding significant market share, while smaller, niche players also contribute to the overall market dynamics. Innovation is primarily driven by the development of novel probiotic strains with enhanced efficacy and targeted health benefits, such as improved gut health, immunity support, and digestive well-being. The regulatory landscape varies across different APAC countries, influencing product approvals and market access. Substitute products include prebiotics and other functional foods, creating competitive pressures. End-users comprise a diverse population, with increasing health consciousness and awareness driving demand. M&A activity within the sector is relatively high, reflecting strategic consolidation efforts among major players to expand their market presence.
- Market Share Distribution: Nestle SA, Danone SA, and Yakult Honsha Co Ltd collectively hold approximately xx% of the market share in 2025.
- M&A Deal Values: Total M&A deal value in the APAC probiotic market between 2019-2024 reached approximately xx Million. The average deal size was approximately xx Million.
- Innovation Catalysts: Growing consumer demand for natural health solutions, advancements in probiotic strain development, and increasing scientific evidence supporting the health benefits of probiotics.
- Regulatory Landscape: Varying regulatory standards across different APAC countries present both opportunities and challenges for market entry and expansion.
APAC Probiotic Market Industry Evolution
The APAC probiotic market has witnessed significant growth over the past five years, driven by factors such as rising health consciousness, increasing disposable incomes, and expanding distribution channels. Technological advancements, including improved strain identification and formulation technologies, are further enhancing product quality and efficacy. Consumer demand is increasingly shifting towards specialized probiotic products tailored to specific health needs, such as immunity support, gut health, and weight management. The market exhibits notable regional variations, with some countries experiencing faster growth than others due to factors such as consumer preferences, regulatory environments, and levels of healthcare investment. Growth rates have averaged xx% annually during the historical period (2019-2024), with projections of xx% annual growth expected during the forecast period (2025-2033). Adoption metrics are influenced by factors such as product efficacy, consumer awareness and marketing initiatives.
Leading Regions, Countries, or Segments in APAC Probiotic Market
This section identifies the leading regions, countries, and segments within the APAC probiotic market. China and Japan represent the largest markets, driven by high consumer awareness and robust healthcare systems.
- Dominant Regions: China and Japan are the leading markets in APAC, accounting for approximately xx% of the total market value. Other significant markets include South Korea, Australia, and India.
- Dominant Product Types: Probiotic drinks and dairy-based probiotic drinks collectively make up approximately xx% of the market. Dietary supplements are also a rapidly growing segment.
- Dominant Distribution Channels: Supermarkets/hypermarkets and convenience stores remain the most prevalent distribution channels, benefiting from high consumer accessibility and established supply chains. Online retail stores are experiencing rapid growth, driven by increased e-commerce penetration.
Key Drivers:
- Investment Trends: Significant investments in R&D and manufacturing capacity are boosting production efficiency and enhancing product quality.
- Regulatory Support: Favorable regulatory environments in certain APAC countries are encouraging market expansion.
APAC Probiotic Market Product Innovations
Recent product innovations in the APAC probiotic market focus on enhancing product efficacy, improving taste and texture, and addressing specific health concerns. This includes the development of novel probiotic strains with targeted benefits and convenient delivery formats, such as ready-to-drink beverages and easy-to-consume sachets. Unique selling propositions (USPs) often highlight scientific evidence supporting product efficacy, natural ingredients, and specific health claims. Technological advancements in fermentation and encapsulation technologies have further improved product stability and shelf life.
Propelling Factors for APAC Probiotic Market Growth
Several factors contribute to the growth of the APAC probiotic market. Rising health consciousness among consumers is leading to increased demand for functional foods and dietary supplements with health benefits. Technological advancements in strain development and formulation are also driving innovation and improving product quality. Favorable government regulations and policies in some APAC countries are supporting market expansion, while increased investments in R&D are bolstering product development. Growing e-commerce penetration and wider distribution networks also enhance market access and availability.
Obstacles in the APAC Probiotic Market
The APAC probiotic market faces several challenges. Varying regulatory requirements across different APAC countries can hinder market access and increase compliance costs. Supply chain disruptions, particularly during periods of economic uncertainty or natural disasters, can impact product availability. Intense competition from established players and new entrants creates pricing pressure and necessitates constant innovation to maintain market share. Consumer perceptions regarding the efficacy of probiotic products can also affect market growth, necessitating effective communication and education strategies.
Future Opportunities in APAC Probiotic Market
Future opportunities in the APAP probiotic market include the expansion into new markets with high growth potential, such as Southeast Asia and South Asia. Developing innovative products targeting specific health needs, such as immune support and gut health, will offer significant growth potential. Leveraging emerging technologies like precision fermentation and personalized nutrition to deliver customized probiotic solutions offers further opportunities. Focus on sustainability and environmentally friendly packaging will resonate with environmentally conscious consumers.
Major Players in the APAC Probiotic Market Ecosystem
- Cell Biotech
- Nestle SA
- Groupe Danone
- PepsiCo Inc
- Yakult Honsha Co Ltd
- Amway Corp
- Danone SA
- Now Foods
- Bio-K Plus International
- Anand Milk Union Limited
Key Developments in APAC Probiotic Market Industry
- Sept 2022: Nestle Health Science's probiotics brand Garden of Life launched two new probiotic drinks targeted at kids' growth and immune health in China's offline retail market. This highlights the increasing focus on children's health and the expansion into offline retail channels in key markets.
- Jan 2022: Mengniu's Youyi C launched two probiotic solid drinks tailored for the Chinese market, incorporating unique Chinese patented star bacteria. This showcases the customization of products to meet specific local preferences and the utilization of regionally-specific probiotic strains.
- Mar 2021: COSTA, a leading international coffee brand, collaborated with NZMP to launch a peach probiotic latte in all 200 stores in China. This represents a significant expansion of probiotics into unconventional product categories and demonstrates successful collaborations across diverse industries.
Strategic APAC Probiotic Market Forecast
The APAC probiotic market is poised for continued robust growth, driven by rising consumer awareness of gut health, increasing disposable incomes, and the development of innovative products catering to diverse health needs. The forecast period (2025-2033) anticipates sustained expansion, with significant opportunities for players who can capitalize on regional market nuances and technological advancements. Focus on personalized nutrition, leveraging the latest scientific insights, and incorporating sustainable practices will be crucial for long-term success within this dynamic market.
APAC Probiotic Market Segmentation
-
1. Type
-
1.1. Probiotic Foods
- 1.1.1. Yogurt
- 1.1.2. Bakery/Breakfast Cereals
- 1.1.3. Baby Food and Infant Formula
- 1.1.4. Other Probiotic Foods
-
1.2. Probiotic Drinks
- 1.2.1. Fruit-based Probiotic Drinks
- 1.2.2. Dairy-based Probiotic Drinks
- 1.3. Dietary Supplements
-
1.1. Probiotic Foods
-
2. Distribution Channel
- 2.1. Supermarkets/Hypermarkets
- 2.2. Convenience Stores
- 2.3. Pharmacies and Drug Stores
- 2.4. Online Retail Stores
- 2.5. Other Distribution Channels
-
3. Geography
- 3.1. China
- 3.2. Japan
- 3.3. India
- 3.4. South Korea
- 3.5. Australia
- 3.6. Rest of Asia-Pacific
APAC Probiotic Market Segmentation By Geography
- 1. China
- 2. Japan
- 3. India
- 4. South Korea
- 5. Australia
- 6. Rest of Asia Pacific
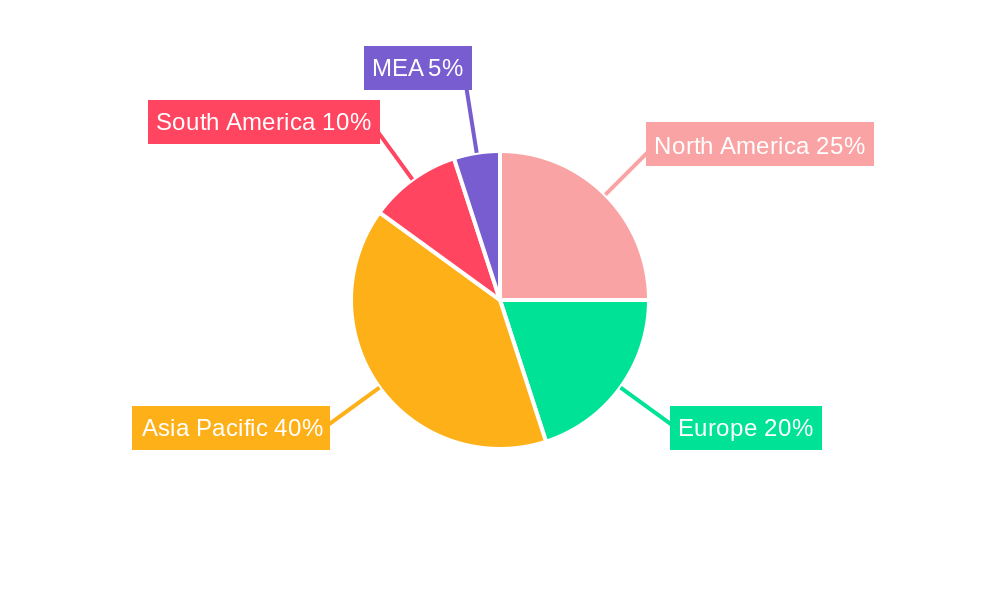
APAC Probiotic Market Regional Market Share
Geographic Coverage of APAC Probiotic Market
APAC Probiotic Market REPORT HIGHLIGHTS
| Aspects | Details |
|---|---|
| Study Period | 2020-2034 |
| Base Year | 2025 |
| Estimated Year | 2026 |
| Forecast Period | 2026-2034 |
| Historical Period | 2020-2025 |
| Growth Rate | CAGR of 10.7% from 2020-2034 |
| Segmentation |
|
Table of Contents
- 1. Introduction
- 1.1. Research Scope
- 1.2. Market Segmentation
- 1.3. Research Objective
- 1.4. Definitions and Assumptions
- 2. Executive Summary
- 2.1. Market Snapshot
- 3. Market Dynamics
- 3.1. Market Drivers
- 3.2. Market Restrains
- 3.3. Market Trends
- 3.4. Market Opportunities
- 4. Market Factor Analysis
- 4.1. Porters Five Forces
- 4.1.1. Bargaining Power of Suppliers
- 4.1.2. Bargaining Power of Buyers
- 4.1.3. Threat of New Entrants
- 4.1.4. Threat of Substitutes
- 4.1.5. Competitive Rivalry
- 4.2. PESTEL analysis
- 4.3. BCG Analysis
- 4.3.1. Stars (High Growth, High Market Share)
- 4.3.2. Cash Cows (Low Growth, High Market Share)
- 4.3.3. Question Mark (High Growth, Low Market Share)
- 4.3.4. Dogs (Low Growth, Low Market Share)
- 4.4. Ansoff Matrix Analysis
- 4.5. Supply Chain Analysis
- 4.6. Regulatory Landscape
- 4.7. Current Market Potential and Opportunity Assessment (TAM–SAM–SOM Framework)
- 4.8. DMV Analyst Note
- 4.1. Porters Five Forces
- 5. Market Analysis, Insights and Forecast 2021-2033
- 5.1. Market Analysis, Insights and Forecast - by Type
- 5.1.1. Probiotic Foods
- 5.1.1.1. Yogurt
- 5.1.1.2. Bakery/Breakfast Cereals
- 5.1.1.3. Baby Food and Infant Formula
- 5.1.1.4. Other Probiotic Foods
- 5.1.2. Probiotic Drinks
- 5.1.2.1. Fruit-based Probiotic Drinks
- 5.1.2.2. Dairy-based Probiotic Drinks
- 5.1.3. Dietary Supplements
- 5.1.1. Probiotic Foods
- 5.2. Market Analysis, Insights and Forecast - by Distribution Channel
- 5.2.1. Supermarkets/Hypermarkets
- 5.2.2. Convenience Stores
- 5.2.3. Pharmacies and Drug Stores
- 5.2.4. Online Retail Stores
- 5.2.5. Other Distribution Channels
- 5.3. Market Analysis, Insights and Forecast - by Geography
- 5.3.1. China
- 5.3.2. Japan
- 5.3.3. India
- 5.3.4. South Korea
- 5.3.5. Australia
- 5.3.6. Rest of Asia-Pacific
- 5.4. Market Analysis, Insights and Forecast - by Region
- 5.4.1. China
- 5.4.2. Japan
- 5.4.3. India
- 5.4.4. South Korea
- 5.4.5. Australia
- 5.4.6. Rest of Asia Pacific
- 5.1. Market Analysis, Insights and Forecast - by Type
- 6. Global APAC Probiotic Market Analysis, Insights and Forecast, 2021-2033
- 6.1. Market Analysis, Insights and Forecast - by Type
- 6.1.1. Probiotic Foods
- 6.1.1.1. Yogurt
- 6.1.1.2. Bakery/Breakfast Cereals
- 6.1.1.3. Baby Food and Infant Formula
- 6.1.1.4. Other Probiotic Foods
- 6.1.2. Probiotic Drinks
- 6.1.2.1. Fruit-based Probiotic Drinks
- 6.1.2.2. Dairy-based Probiotic Drinks
- 6.1.3. Dietary Supplements
- 6.1.1. Probiotic Foods
- 6.2. Market Analysis, Insights and Forecast - by Distribution Channel
- 6.2.1. Supermarkets/Hypermarkets
- 6.2.2. Convenience Stores
- 6.2.3. Pharmacies and Drug Stores
- 6.2.4. Online Retail Stores
- 6.2.5. Other Distribution Channels
- 6.3. Market Analysis, Insights and Forecast - by Geography
- 6.3.1. China
- 6.3.2. Japan
- 6.3.3. India
- 6.3.4. South Korea
- 6.3.5. Australia
- 6.3.6. Rest of Asia-Pacific
- 6.1. Market Analysis, Insights and Forecast - by Type
- 7. China APAC Probiotic Market Analysis, Insights and Forecast, 2020-2032
- 7.1. Market Analysis, Insights and Forecast - by Type
- 7.1.1. Probiotic Foods
- 7.1.1.1. Yogurt
- 7.1.1.2. Bakery/Breakfast Cereals
- 7.1.1.3. Baby Food and Infant Formula
- 7.1.1.4. Other Probiotic Foods
- 7.1.2. Probiotic Drinks
- 7.1.2.1. Fruit-based Probiotic Drinks
- 7.1.2.2. Dairy-based Probiotic Drinks
- 7.1.3. Dietary Supplements
- 7.1.1. Probiotic Foods
- 7.2. Market Analysis, Insights and Forecast - by Distribution Channel
- 7.2.1. Supermarkets/Hypermarkets
- 7.2.2. Convenience Stores
- 7.2.3. Pharmacies and Drug Stores
- 7.2.4. Online Retail Stores
- 7.2.5. Other Distribution Channels
- 7.3. Market Analysis, Insights and Forecast - by Geography
- 7.3.1. China
- 7.3.2. Japan
- 7.3.3. India
- 7.3.4. South Korea
- 7.3.5. Australia
- 7.3.6. Rest of Asia-Pacific
- 7.1. Market Analysis, Insights and Forecast - by Type
- 8. Japan APAC Probiotic Market Analysis, Insights and Forecast, 2020-2032
- 8.1. Market Analysis, Insights and Forecast - by Type
- 8.1.1. Probiotic Foods
- 8.1.1.1. Yogurt
- 8.1.1.2. Bakery/Breakfast Cereals
- 8.1.1.3. Baby Food and Infant Formula
- 8.1.1.4. Other Probiotic Foods
- 8.1.2. Probiotic Drinks
- 8.1.2.1. Fruit-based Probiotic Drinks
- 8.1.2.2. Dairy-based Probiotic Drinks
- 8.1.3. Dietary Supplements
- 8.1.1. Probiotic Foods
- 8.2. Market Analysis, Insights and Forecast - by Distribution Channel
- 8.2.1. Supermarkets/Hypermarkets
- 8.2.2. Convenience Stores
- 8.2.3. Pharmacies and Drug Stores
- 8.2.4. Online Retail Stores
- 8.2.5. Other Distribution Channels
- 8.3. Market Analysis, Insights and Forecast - by Geography
- 8.3.1. China
- 8.3.2. Japan
- 8.3.3. India
- 8.3.4. South Korea
- 8.3.5. Australia
- 8.3.6. Rest of Asia-Pacific
- 8.1. Market Analysis, Insights and Forecast - by Type
- 9. India APAC Probiotic Market Analysis, Insights and Forecast, 2020-2032
- 9.1. Market Analysis, Insights and Forecast - by Type
- 9.1.1. Probiotic Foods
- 9.1.1.1. Yogurt
- 9.1.1.2. Bakery/Breakfast Cereals
- 9.1.1.3. Baby Food and Infant Formula
- 9.1.1.4. Other Probiotic Foods
- 9.1.2. Probiotic Drinks
- 9.1.2.1. Fruit-based Probiotic Drinks
- 9.1.2.2. Dairy-based Probiotic Drinks
- 9.1.3. Dietary Supplements
- 9.1.1. Probiotic Foods
- 9.2. Market Analysis, Insights and Forecast - by Distribution Channel
- 9.2.1. Supermarkets/Hypermarkets
- 9.2.2. Convenience Stores
- 9.2.3. Pharmacies and Drug Stores
- 9.2.4. Online Retail Stores
- 9.2.5. Other Distribution Channels
- 9.3. Market Analysis, Insights and Forecast - by Geography
- 9.3.1. China
- 9.3.2. Japan
- 9.3.3. India
- 9.3.4. South Korea
- 9.3.5. Australia
- 9.3.6. Rest of Asia-Pacific
- 9.1. Market Analysis, Insights and Forecast - by Type
- 10. South Korea APAC Probiotic Market Analysis, Insights and Forecast, 2020-2032
- 10.1. Market Analysis, Insights and Forecast - by Type
- 10.1.1. Probiotic Foods
- 10.1.1.1. Yogurt
- 10.1.1.2. Bakery/Breakfast Cereals
- 10.1.1.3. Baby Food and Infant Formula
- 10.1.1.4. Other Probiotic Foods
- 10.1.2. Probiotic Drinks
- 10.1.2.1. Fruit-based Probiotic Drinks
- 10.1.2.2. Dairy-based Probiotic Drinks
- 10.1.3. Dietary Supplements
- 10.1.1. Probiotic Foods
- 10.2. Market Analysis, Insights and Forecast - by Distribution Channel
- 10.2.1. Supermarkets/Hypermarkets
- 10.2.2. Convenience Stores
- 10.2.3. Pharmacies and Drug Stores
- 10.2.4. Online Retail Stores
- 10.2.5. Other Distribution Channels
- 10.3. Market Analysis, Insights and Forecast - by Geography
- 10.3.1. China
- 10.3.2. Japan
- 10.3.3. India
- 10.3.4. South Korea
- 10.3.5. Australia
- 10.3.6. Rest of Asia-Pacific
- 10.1. Market Analysis, Insights and Forecast - by Type
- 11. Australia APAC Probiotic Market Analysis, Insights and Forecast, 2020-2032
- 11.1. Market Analysis, Insights and Forecast - by Type
- 11.1.1. Probiotic Foods
- 11.1.1.1. Yogurt
- 11.1.1.2. Bakery/Breakfast Cereals
- 11.1.1.3. Baby Food and Infant Formula
- 11.1.1.4. Other Probiotic Foods
- 11.1.2. Probiotic Drinks
- 11.1.2.1. Fruit-based Probiotic Drinks
- 11.1.2.2. Dairy-based Probiotic Drinks
- 11.1.3. Dietary Supplements
- 11.1.1. Probiotic Foods
- 11.2. Market Analysis, Insights and Forecast - by Distribution Channel
- 11.2.1. Supermarkets/Hypermarkets
- 11.2.2. Convenience Stores
- 11.2.3. Pharmacies and Drug Stores
- 11.2.4. Online Retail Stores
- 11.2.5. Other Distribution Channels
- 11.3. Market Analysis, Insights and Forecast - by Geography
- 11.3.1. China
- 11.3.2. Japan
- 11.3.3. India
- 11.3.4. South Korea
- 11.3.5. Australia
- 11.3.6. Rest of Asia-Pacific
- 11.1. Market Analysis, Insights and Forecast - by Type
- 12. Rest of Asia Pacific APAC Probiotic Market Analysis, Insights and Forecast, 2020-2032
- 12.1. Market Analysis, Insights and Forecast - by Type
- 12.1.1. Probiotic Foods
- 12.1.1.1. Yogurt
- 12.1.1.2. Bakery/Breakfast Cereals
- 12.1.1.3. Baby Food and Infant Formula
- 12.1.1.4. Other Probiotic Foods
- 12.1.2. Probiotic Drinks
- 12.1.2.1. Fruit-based Probiotic Drinks
- 12.1.2.2. Dairy-based Probiotic Drinks
- 12.1.3. Dietary Supplements
- 12.1.1. Probiotic Foods
- 12.2. Market Analysis, Insights and Forecast - by Distribution Channel
- 12.2.1. Supermarkets/Hypermarkets
- 12.2.2. Convenience Stores
- 12.2.3. Pharmacies and Drug Stores
- 12.2.4. Online Retail Stores
- 12.2.5. Other Distribution Channels
- 12.3. Market Analysis, Insights and Forecast - by Geography
- 12.3.1. China
- 12.3.2. Japan
- 12.3.3. India
- 12.3.4. South Korea
- 12.3.5. Australia
- 12.3.6. Rest of Asia-Pacific
- 12.1. Market Analysis, Insights and Forecast - by Type
- 13. Competitive Analysis
- 13.1. Company Profiles
- 13.1.1 Cell Biotech
- 13.1.1.1. Company Overview
- 13.1.1.2. Products
- 13.1.1.3. Company Financials
- 13.1.1.4. SWOT Analysis
- 13.1.2 Nestle SA
- 13.1.2.1. Company Overview
- 13.1.2.2. Products
- 13.1.2.3. Company Financials
- 13.1.2.4. SWOT Analysis
- 13.1.3 Groupe Danone
- 13.1.3.1. Company Overview
- 13.1.3.2. Products
- 13.1.3.3. Company Financials
- 13.1.3.4. SWOT Analysis
- 13.1.4 PepsiCo Inc
- 13.1.4.1. Company Overview
- 13.1.4.2. Products
- 13.1.4.3. Company Financials
- 13.1.4.4. SWOT Analysis
- 13.1.5 Yakult Honsha Co Ltd
- 13.1.5.1. Company Overview
- 13.1.5.2. Products
- 13.1.5.3. Company Financials
- 13.1.5.4. SWOT Analysis
- 13.1.6 Amway Corp
- 13.1.6.1. Company Overview
- 13.1.6.2. Products
- 13.1.6.3. Company Financials
- 13.1.6.4. SWOT Analysis
- 13.1.7 Danone SA
- 13.1.7.1. Company Overview
- 13.1.7.2. Products
- 13.1.7.3. Company Financials
- 13.1.7.4. SWOT Analysis
- 13.1.8 Now Foods
- 13.1.8.1. Company Overview
- 13.1.8.2. Products
- 13.1.8.3. Company Financials
- 13.1.8.4. SWOT Analysis
- 13.1.9 Bio-K Plus International
- 13.1.9.1. Company Overview
- 13.1.9.2. Products
- 13.1.9.3. Company Financials
- 13.1.9.4. SWOT Analysis
- 13.1.10 Anand Milk Union Limited*List Not Exhaustive
- 13.1.10.1. Company Overview
- 13.1.10.2. Products
- 13.1.10.3. Company Financials
- 13.1.10.4. SWOT Analysis
- 13.1.1 Cell Biotech
- 13.2. Market Entropy
- 13.2.1 Company's Key Areas Served
- 13.2.2 Recent Developments
- 13.3. Company Market Share Analysis 2025
- 13.3.1 Top 5 Companies Market Share Analysis
- 13.3.2 Top 3 Companies Market Share Analysis
- 13.4. List of Potential Customers
- 14. Research Methodology
List of Figures
- Figure 1: Global APAC Probiotic Market Revenue Breakdown (billion, %) by Region 2025 & 2033
- Figure 2: China APAC Probiotic Market Revenue (billion), by Type 2025 & 2033
- Figure 3: China APAC Probiotic Market Revenue Share (%), by Type 2025 & 2033
- Figure 4: China APAC Probiotic Market Revenue (billion), by Distribution Channel 2025 & 2033
- Figure 5: China APAC Probiotic Market Revenue Share (%), by Distribution Channel 2025 & 2033
- Figure 6: China APAC Probiotic Market Revenue (billion), by Geography 2025 & 2033
- Figure 7: China APAC Probiotic Market Revenue Share (%), by Geography 2025 & 2033
- Figure 8: China APAC Probiotic Market Revenue (billion), by Country 2025 & 2033
- Figure 9: China APAC Probiotic Market Revenue Share (%), by Country 2025 & 2033
- Figure 10: Japan APAC Probiotic Market Revenue (billion), by Type 2025 & 2033
- Figure 11: Japan APAC Probiotic Market Revenue Share (%), by Type 2025 & 2033
- Figure 12: Japan APAC Probiotic Market Revenue (billion), by Distribution Channel 2025 & 2033
- Figure 13: Japan APAC Probiotic Market Revenue Share (%), by Distribution Channel 2025 & 2033
- Figure 14: Japan APAC Probiotic Market Revenue (billion), by Geography 2025 & 2033
- Figure 15: Japan APAC Probiotic Market Revenue Share (%), by Geography 2025 & 2033
- Figure 16: Japan APAC Probiotic Market Revenue (billion), by Country 2025 & 2033
- Figure 17: Japan APAC Probiotic Market Revenue Share (%), by Country 2025 & 2033
- Figure 18: India APAC Probiotic Market Revenue (billion), by Type 2025 & 2033
- Figure 19: India APAC Probiotic Market Revenue Share (%), by Type 2025 & 2033
- Figure 20: India APAC Probiotic Market Revenue (billion), by Distribution Channel 2025 & 2033
- Figure 21: India APAC Probiotic Market Revenue Share (%), by Distribution Channel 2025 & 2033
- Figure 22: India APAC Probiotic Market Revenue (billion), by Geography 2025 & 2033
- Figure 23: India APAC Probiotic Market Revenue Share (%), by Geography 2025 & 2033
- Figure 24: India APAC Probiotic Market Revenue (billion), by Country 2025 & 2033
- Figure 25: India APAC Probiotic Market Revenue Share (%), by Country 2025 & 2033
- Figure 26: South Korea APAC Probiotic Market Revenue (billion), by Type 2025 & 2033
- Figure 27: South Korea APAC Probiotic Market Revenue Share (%), by Type 2025 & 2033
- Figure 28: South Korea APAC Probiotic Market Revenue (billion), by Distribution Channel 2025 & 2033
- Figure 29: South Korea APAC Probiotic Market Revenue Share (%), by Distribution Channel 2025 & 2033
- Figure 30: South Korea APAC Probiotic Market Revenue (billion), by Geography 2025 & 2033
- Figure 31: South Korea APAC Probiotic Market Revenue Share (%), by Geography 2025 & 2033
- Figure 32: South Korea APAC Probiotic Market Revenue (billion), by Country 2025 & 2033
- Figure 33: South Korea APAC Probiotic Market Revenue Share (%), by Country 2025 & 2033
- Figure 34: Australia APAC Probiotic Market Revenue (billion), by Type 2025 & 2033
- Figure 35: Australia APAC Probiotic Market Revenue Share (%), by Type 2025 & 2033
- Figure 36: Australia APAC Probiotic Market Revenue (billion), by Distribution Channel 2025 & 2033
- Figure 37: Australia APAC Probiotic Market Revenue Share (%), by Distribution Channel 2025 & 2033
- Figure 38: Australia APAC Probiotic Market Revenue (billion), by Geography 2025 & 2033
- Figure 39: Australia APAC Probiotic Market Revenue Share (%), by Geography 2025 & 2033
- Figure 40: Australia APAC Probiotic Market Revenue (billion), by Country 2025 & 2033
- Figure 41: Australia APAC Probiotic Market Revenue Share (%), by Country 2025 & 2033
- Figure 42: Rest of Asia Pacific APAC Probiotic Market Revenue (billion), by Type 2025 & 2033
- Figure 43: Rest of Asia Pacific APAC Probiotic Market Revenue Share (%), by Type 2025 & 2033
- Figure 44: Rest of Asia Pacific APAC Probiotic Market Revenue (billion), by Distribution Channel 2025 & 2033
- Figure 45: Rest of Asia Pacific APAC Probiotic Market Revenue Share (%), by Distribution Channel 2025 & 2033
- Figure 46: Rest of Asia Pacific APAC Probiotic Market Revenue (billion), by Geography 2025 & 2033
- Figure 47: Rest of Asia Pacific APAC Probiotic Market Revenue Share (%), by Geography 2025 & 2033
- Figure 48: Rest of Asia Pacific APAC Probiotic Market Revenue (billion), by Country 2025 & 2033
- Figure 49: Rest of Asia Pacific APAC Probiotic Market Revenue Share (%), by Country 2025 & 2033
List of Tables
- Table 1: Global APAC Probiotic Market Revenue billion Forecast, by Type 2020 & 2033
- Table 2: Global APAC Probiotic Market Revenue billion Forecast, by Distribution Channel 2020 & 2033
- Table 3: Global APAC Probiotic Market Revenue billion Forecast, by Geography 2020 & 2033
- Table 4: Global APAC Probiotic Market Revenue billion Forecast, by Region 2020 & 2033
- Table 5: Global APAC Probiotic Market Revenue billion Forecast, by Type 2020 & 2033
- Table 6: Global APAC Probiotic Market Revenue billion Forecast, by Distribution Channel 2020 & 2033
- Table 7: Global APAC Probiotic Market Revenue billion Forecast, by Geography 2020 & 2033
- Table 8: Global APAC Probiotic Market Revenue billion Forecast, by Country 2020 & 2033
- Table 9: Global APAC Probiotic Market Revenue billion Forecast, by Type 2020 & 2033
- Table 10: Global APAC Probiotic Market Revenue billion Forecast, by Distribution Channel 2020 & 2033
- Table 11: Global APAC Probiotic Market Revenue billion Forecast, by Geography 2020 & 2033
- Table 12: Global APAC Probiotic Market Revenue billion Forecast, by Country 2020 & 2033
- Table 13: Global APAC Probiotic Market Revenue billion Forecast, by Type 2020 & 2033
- Table 14: Global APAC Probiotic Market Revenue billion Forecast, by Distribution Channel 2020 & 2033
- Table 15: Global APAC Probiotic Market Revenue billion Forecast, by Geography 2020 & 2033
- Table 16: Global APAC Probiotic Market Revenue billion Forecast, by Country 2020 & 2033
- Table 17: Global APAC Probiotic Market Revenue billion Forecast, by Type 2020 & 2033
- Table 18: Global APAC Probiotic Market Revenue billion Forecast, by Distribution Channel 2020 & 2033
- Table 19: Global APAC Probiotic Market Revenue billion Forecast, by Geography 2020 & 2033
- Table 20: Global APAC Probiotic Market Revenue billion Forecast, by Country 2020 & 2033
- Table 21: Global APAC Probiotic Market Revenue billion Forecast, by Type 2020 & 2033
- Table 22: Global APAC Probiotic Market Revenue billion Forecast, by Distribution Channel 2020 & 2033
- Table 23: Global APAC Probiotic Market Revenue billion Forecast, by Geography 2020 & 2033
- Table 24: Global APAC Probiotic Market Revenue billion Forecast, by Country 2020 & 2033
- Table 25: Global APAC Probiotic Market Revenue billion Forecast, by Type 2020 & 2033
- Table 26: Global APAC Probiotic Market Revenue billion Forecast, by Distribution Channel 2020 & 2033
- Table 27: Global APAC Probiotic Market Revenue billion Forecast, by Geography 2020 & 2033
- Table 28: Global APAC Probiotic Market Revenue billion Forecast, by Country 2020 & 2033
Frequently Asked Questions
1. What is the projected Compound Annual Growth Rate (CAGR) of the APAC Probiotic Market?
The projected CAGR is approximately 10.7%.
2. Which companies are prominent players in the APAC Probiotic Market?
Key companies in the market include Cell Biotech, Nestle SA, Groupe Danone, PepsiCo Inc, Yakult Honsha Co Ltd, Amway Corp, Danone SA, Now Foods, Bio-K Plus International, Anand Milk Union Limited*List Not Exhaustive.
3. What are the main segments of the APAC Probiotic Market?
The market segments include Type, Distribution Channel, Geography.
4. Can you provide details about the market size?
The market size is estimated to be USD 86.01 billion as of 2022.
5. What are some drivers contributing to market growth?
Growth In Foodservice Expenditure and Tourism Sector; Premiumization with the Growth of Fortified and Flavored Water.
6. What are the notable trends driving market growth?
Increasing Health Consciousness.
7. Are there any restraints impacting market growth?
Concerns Regarding Plastic Waste and the Rising Inclination Toward Tap Water.
8. Can you provide examples of recent developments in the market?
Sept 2022: Nestle Health Science's probiotics brand Garden of Life launched two new probiotic drinks targeted at kids' growth and immune health in China's offline retail market.
9. What pricing options are available for accessing the report?
Pricing options include single-user, multi-user, and enterprise licenses priced at USD 4750, USD 5250, and USD 8750 respectively.
10. Is the market size provided in terms of value or volume?
The market size is provided in terms of value, measured in billion.
11. Are there any specific market keywords associated with the report?
Yes, the market keyword associated with the report is "APAC Probiotic Market," which aids in identifying and referencing the specific market segment covered.
12. How do I determine which pricing option suits my needs best?
The pricing options vary based on user requirements and access needs. Individual users may opt for single-user licenses, while businesses requiring broader access may choose multi-user or enterprise licenses for cost-effective access to the report.
13. Are there any additional resources or data provided in the APAC Probiotic Market report?
While the report offers comprehensive insights, it's advisable to review the specific contents or supplementary materials provided to ascertain if additional resources or data are available.
14. How can I stay updated on further developments or reports in the APAC Probiotic Market?
To stay informed about further developments, trends, and reports in the APAC Probiotic Market, consider subscribing to industry newsletters, following relevant companies and organizations, or regularly checking reputable industry news sources and publications.
Methodology
Step 1 - Identification of Relevant Samples Size from Population Database


Step 2 - Approaches for Defining Global Market Size (Value, Volume* & Price*)

Note*: In applicable scenarios
Step 3 - Data Sources
Primary Research
- Web Analytics
- Survey Reports
- Research Institute
- Latest Research Reports
- Opinion Leaders
Secondary Research
- Annual Reports
- White Paper
- Latest Press Release
- Industry Association
- Paid Database
- Investor Presentations

Step 4 - Data Triangulation
Involves using different sources of information in order to increase the validity of a study
These sources are likely to be stakeholders in a program - participants, other researchers, program staff, other community members, and so on.
Then we put all data in single framework & apply various statistical tools to find out the dynamic on the market.
During the analysis stage, feedback from the stakeholder groups would be compared to determine areas of agreement as well as areas of divergence