

Key Insights
The Air Pollution Control System (APCS) market is poised for significant expansion, propelled by stringent global environmental regulations and heightened public health awareness regarding air quality. The market is projected to reach $103.66 billion by 2025, with a compound annual growth rate (CAGR) of 6.3% from 2025 to 2033. Key growth drivers include the burgeoning power generation sector, rapid industrialization in emerging economies, and the increasing demand for cleaner industrial processes across diverse industries such as cement and steel. Technological innovations, including advanced Electrostatic Precipitators (ESPs) and Selective Catalytic Reduction (SCR) systems, are enhancing efficiency and cost-effectiveness, further stimulating market growth. While initial capital expenditure for APCS presents a challenge, the long-term benefits of improved air quality and regulatory compliance offer substantial value. Government incentives and subsidies are also encouraging broader adoption of cleaner technologies. The market is segmented by technology (ESPs, Flue Gas Desulfurization (FGD), Scrubbers, SCR, Fabric Filters) and application (Power Generation, Cement, Iron & Steel, Chemical, Others), with power generation currently leading due to its significant environmental impact. The Asia-Pacific region offers substantial opportunities, driven by rapid industrialization and urbanization in countries like China and India, while North America and Europe will continue to experience growth through regulatory adherence and technology upgrades.
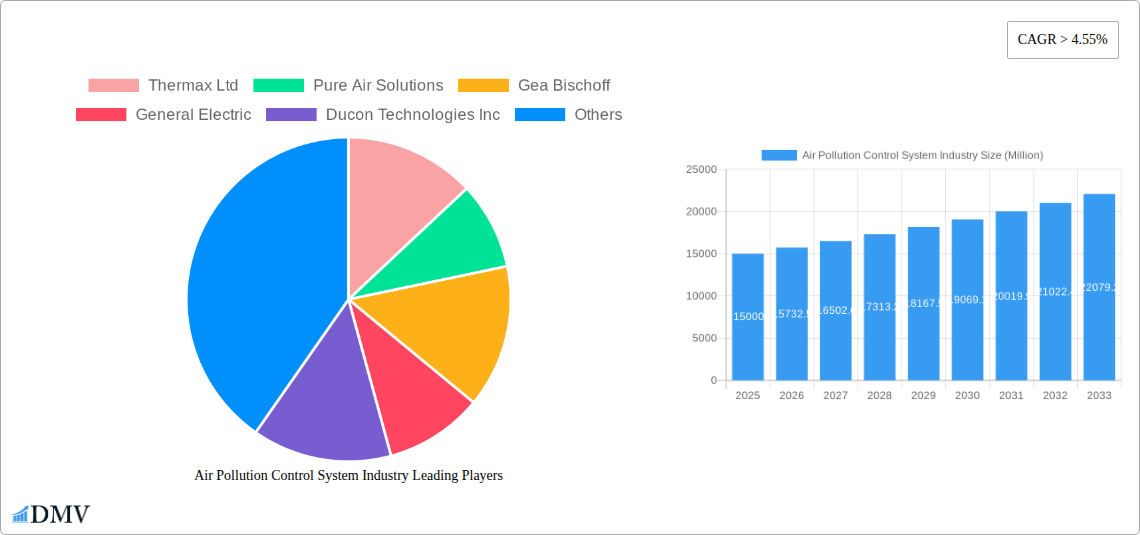
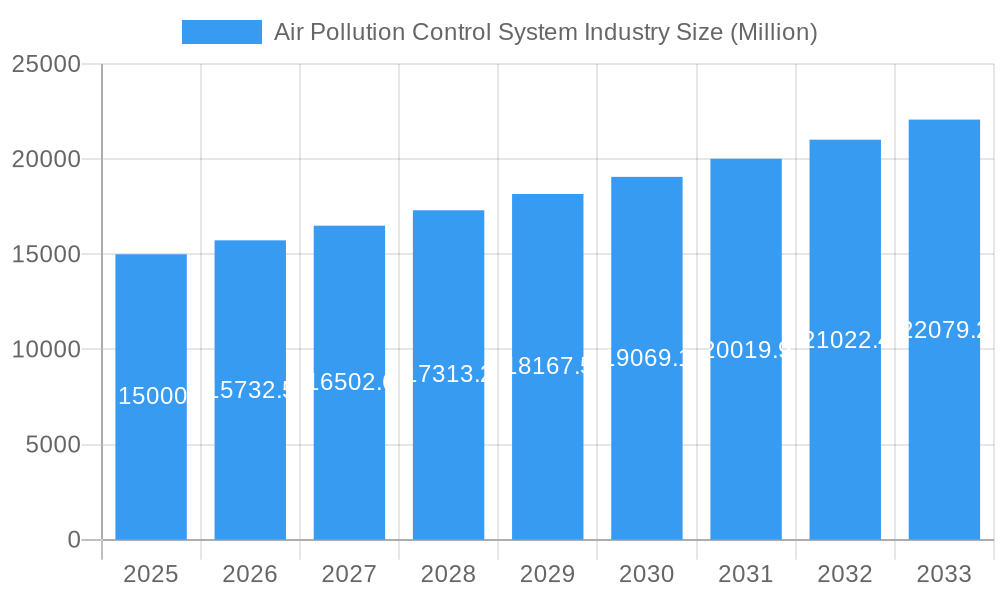
Air Pollution Control System Industry Market Size (In Billion)
The competitive landscape features a blend of established global corporations and specialized regional players. Leading companies leverage technological expertise and extensive market reach. However, agile smaller firms focusing on niche technologies or specific markets are also gaining prominence. Future market dynamics will be shaped by evolving regulations, technological advancements, the rise of renewable energy, and a growing emphasis on sustainable industrial practices. The industry is anticipated to witness a trend towards integrated and intelligent APCS solutions, incorporating advanced monitoring and control systems for enhanced efficiency. The integration of digital technologies, including Artificial Intelligence (AI) and the Internet of Things (IoT), is expected to be a transformative development. Continuous investment in research and development is vital for sustained innovation and competitive advantage.
Air Pollution Control System Industry Company Market Share
Air Pollution Control System Industry Market Report: 2019-2033
This comprehensive report provides a detailed analysis of the Air Pollution Control System industry, projecting a market value of $XX Million by 2033. The study covers the period 2019-2033, with 2025 serving as the base and estimated year. This in-depth analysis will equip stakeholders with crucial insights into market trends, technological advancements, competitive landscapes, and future growth prospects. The report meticulously examines key segments, including Electrostatic Precipitators (ESP), Flue Gas Desulfurization (FGD), Scrubbers, Selective Catalytic Reduction (SCR), and Fabric Filters, across diverse applications such as Power Generation, Cement, Iron & Steel, Chemical, and Other industries. Leading players like Thermax Ltd, Pure Air Solutions, Gea Bischoff, General Electric, and others are profiled, revealing their market strategies and contributions to the evolving landscape.
Air Pollution Control System Industry Market Composition & Trends
The Air Pollution Control System market exhibits a moderately concentrated landscape, with the top 10 players holding an estimated XX% market share in 2025. Innovation is driven by stringent environmental regulations, particularly in developed economies, pushing for cleaner technologies and higher efficiency. Key innovation catalysts include advancements in materials science, sensor technologies, and AI-powered predictive maintenance. The regulatory landscape is dynamic, with evolving emission standards globally influencing market growth. Substitute technologies, though limited, include improved combustion techniques, but these rarely achieve the same level of emission reduction. End-users predominantly comprise power generation companies, industrial manufacturers, and municipalities. M&A activity has been moderate, with an estimated $XX Million in deal value between 2019 and 2024, primarily focused on expanding technological capabilities and geographical reach.
- Market Share Distribution (2025): Top 5 players – XX%, Next 5 players – XX%, Others – XX%.
- M&A Deal Value (2019-2024): $XX Million
- Key M&A Activities: [Insert brief description of significant M&A activities, if available. Otherwise, state "Data unavailable."]
Air Pollution Control System Industry Industry Evolution
The Air Pollution Control System market witnessed a CAGR of XX% during the historical period (2019-2024), driven by increasing industrialization and stricter emission norms. Technological advancements, including the development of highly efficient ESPs, advanced SCR systems, and improved fabric filter materials, have significantly enhanced performance and reduced operational costs. Shifting consumer demands, particularly towards sustainability and corporate social responsibility (CSR) initiatives, are further fueling market growth. The forecast period (2025-2033) is projected to see a CAGR of XX%, driven by the expansion of renewable energy sources (requiring specialized air pollution control systems), growing industrial activity in developing nations, and sustained investments in environmental protection. Adoption of advanced technologies like AI and IoT for predictive maintenance and optimized performance is expected to increase significantly during this period.
Leading Regions, Countries, or Segments in Air Pollution Control System Industry
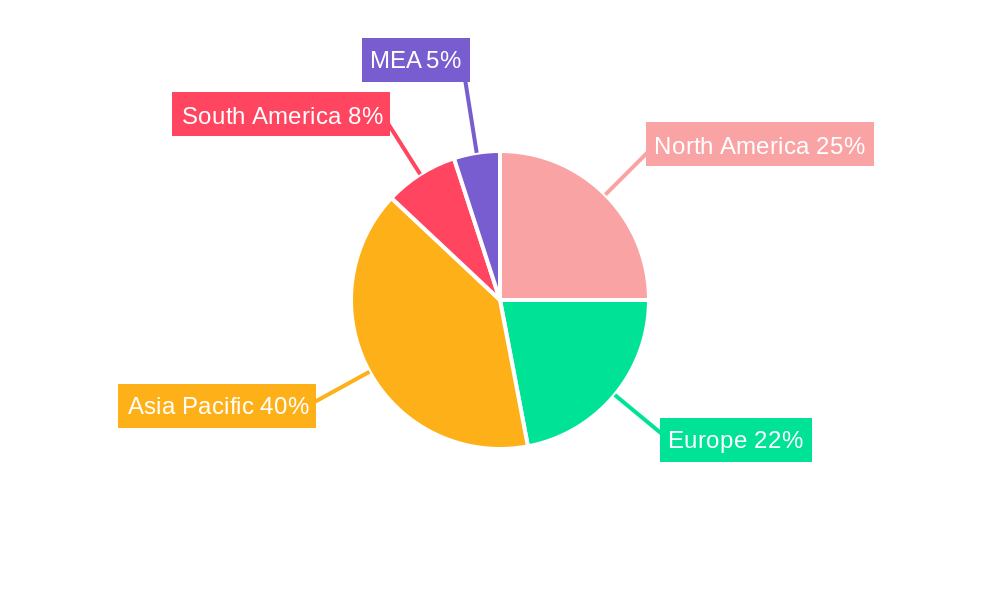
The Power Generation segment dominates the Air Pollution Control Systems market, holding approximately XX% market share in 2025, followed by the Iron & Steel industry. North America and Europe currently hold the largest market share due to stringent emission regulations and established industrial bases. However, Asia-Pacific is expected to witness the highest growth rate during the forecast period, driven by rapid industrialization and increasing investments in infrastructure development.
Key Drivers:
- North America & Europe: Stringent environmental regulations, high technological adoption rates, and well-established industrial infrastructure.
- Asia-Pacific: Rapid industrialization, increasing energy demand, and government initiatives promoting cleaner production.
Dominance Factors:
North America and Europe lead due to existing, robust regulatory frameworks and a higher concentration of established industrial players. Asia-Pacific's rapid growth stems from the region's burgeoning industrial expansion and governmental investments in cleaner technologies. The Power Generation segment's dominance is due to its significant contribution to overall air pollution, thus requiring extensive control systems.
Air Pollution Control System Industry Product Innovations
Recent innovations focus on enhancing efficiency, reducing operational costs, and improving longevity. Advanced ESPs with improved electrode designs and pulsed power supplies offer higher collection efficiencies. SCR systems employing novel catalyst materials demonstrate superior NOx reduction capabilities. Smart sensors and IoT integration enable predictive maintenance and optimized system performance, reducing downtime and maintenance expenses. These advancements are accompanied by a growing emphasis on modular designs for flexibility and ease of installation.
Propelling Factors for Air Pollution Control System Industry Growth
The Air Pollution Control System market is primarily driven by stringent environmental regulations mandating emission reductions (e.g., the Clean Air Act in the US and similar legislation globally). Rising industrialization and increased energy consumption in developing economies are also key drivers. Technological advancements leading to higher efficiency and lower operational costs further stimulate market growth. Government incentives and financial support for clean technology adoption are accelerating market expansion.
Obstacles in the Air Pollution Control System Industry Market
High initial investment costs for installing and maintaining these systems can be a major barrier, particularly for smaller companies. Supply chain disruptions and volatility in raw material prices pose significant challenges to manufacturers. Intense competition among established players and emerging companies can lead to price pressures and reduced profit margins. Furthermore, the complexity of integrating new technologies into existing infrastructure can hinder adoption in some sectors.
Future Opportunities in Air Pollution Control System Industry
Significant growth opportunities exist in emerging economies undergoing rapid industrialization. The increasing adoption of renewable energy sources, such as solar and wind power, presents a substantial opportunity for specialized air pollution control systems. Advances in AI and IoT offer potential for optimizing system performance and reducing operational costs. Focus on developing more sustainable and environmentally friendly materials used in the construction of the systems presents additional opportunities.
Major Players in the Air Pollution Control System Industry Ecosystem
- Thermax Ltd
- Pure Air Solutions
- Gea Bischoff
- General Electric
- Ducon Technologies Inc
- Horiba Ltd
- Hamon Corporation
- Andritz AG
- Siemens AG
- Mitsubishi Hitachi Power Systems Ltd
- Calgon Carbon Corporation
- Fujian Longking Co Ltd
- Babcock & Wilcox Enterprises Inc
- Tri-mer
- Amec Foster Wheeler
- Esco International
Key Developments in Air Pollution Control System Industry Industry
- 2023: [Insert key development with brief description and impact. Repeat as needed, filling in with available data. If no data is available, state "Data unavailable."]
Strategic Air Pollution Control System Industry Market Forecast
The Air Pollution Control System market is poised for significant growth driven by stricter environmental regulations, technological innovation, and increasing industrial activity globally. The forecast period (2025-2033) presents considerable opportunities for companies that can offer cost-effective, high-performance solutions. The market will be shaped by ongoing technological advancements, particularly in AI-driven predictive maintenance and the development of sustainable materials. The expanding renewable energy sector will also fuel demand for specialized air pollution control systems.
Air Pollution Control System Industry Segmentation
-
1. Application
- 1.1. Power Generation
- 1.2. Cement Industry
- 1.3. Iron & Steel Industry
- 1.4. Chemical Industry
- 1.5. Others
-
2. Type
- 2.1. Electrostatic Precipitators (ESP)
- 2.2. Flue Gas Desulfurization (FGD)
- 2.3. Scrubbers
- 2.4. Selective Catalytic Reduction (SCR)
- 2.5. Fabric Filters
Air Pollution Control System Industry Segmentation By Geography
-
1. North America
- 1.1. United States
- 1.2. Canada
- 1.3. Rest of North America
-
2. Asia Pacific
- 2.1. India
- 2.2. China
- 2.3. Japan
- 2.4. Australia
- 2.5. Rest of Asia Pacific
-
3. Europe
- 3.1. Germany
- 3.2. France
- 3.3. United Kingdom
- 3.4. Italy
- 3.5. Rest of Europe
-
4. South America
- 4.1. Brazil
- 4.2. Argentina
- 4.3. Chile
- 4.4. Rest of South America
-
5. Middle East and Africa
- 5.1. Saudi Arabia
- 5.2. South Africa
- 5.3. Algeria
- 5.4. Rest of Middle East and Africa
Air Pollution Control System Industry Regional Market Share
Geographic Coverage of Air Pollution Control System Industry
Air Pollution Control System Industry REPORT HIGHLIGHTS
| Aspects | Details |
|---|---|
| Study Period | 2020-2034 |
| Base Year | 2025 |
| Estimated Year | 2026 |
| Forecast Period | 2026-2034 |
| Historical Period | 2020-2025 |
| Growth Rate | CAGR of 6.3% from 2020-2034 |
| Segmentation |
|
Table of Contents
- 1. Introduction
- 1.1. Research Scope
- 1.2. Market Segmentation
- 1.3. Research Objective
- 1.4. Definitions and Assumptions
- 2. Executive Summary
- 2.1. Market Snapshot
- 3. Market Dynamics
- 3.1. Market Drivers
- 3.2. Market Restrains
- 3.3. Market Trends
- 3.4. Market Opportunities
- 4. Market Factor Analysis
- 4.1. Porters Five Forces
- 4.1.1. Bargaining Power of Suppliers
- 4.1.2. Bargaining Power of Buyers
- 4.1.3. Threat of New Entrants
- 4.1.4. Threat of Substitutes
- 4.1.5. Competitive Rivalry
- 4.2. PESTEL analysis
- 4.3. BCG Analysis
- 4.3.1. Stars (High Growth, High Market Share)
- 4.3.2. Cash Cows (Low Growth, High Market Share)
- 4.3.3. Question Mark (High Growth, Low Market Share)
- 4.3.4. Dogs (Low Growth, Low Market Share)
- 4.4. Ansoff Matrix Analysis
- 4.5. Supply Chain Analysis
- 4.6. Regulatory Landscape
- 4.7. Current Market Potential and Opportunity Assessment (TAM–SAM–SOM Framework)
- 4.8. DMV Analyst Note
- 4.1. Porters Five Forces
- 5. Market Analysis, Insights and Forecast 2021-2033
- 5.1. Market Analysis, Insights and Forecast - by Application
- 5.1.1. Power Generation
- 5.1.2. Cement Industry
- 5.1.3. Iron & Steel Industry
- 5.1.4. Chemical Industry
- 5.1.5. Others
- 5.2. Market Analysis, Insights and Forecast - by Type
- 5.2.1. Electrostatic Precipitators (ESP)
- 5.2.2. Flue Gas Desulfurization (FGD)
- 5.2.3. Scrubbers
- 5.2.4. Selective Catalytic Reduction (SCR)
- 5.2.5. Fabric Filters
- 5.3. Market Analysis, Insights and Forecast - by Region
- 5.3.1. North America
- 5.3.2. Asia Pacific
- 5.3.3. Europe
- 5.3.4. South America
- 5.3.5. Middle East and Africa
- 5.1. Market Analysis, Insights and Forecast - by Application
- 6. Global Air Pollution Control System Industry Analysis, Insights and Forecast, 2021-2033
- 6.1. Market Analysis, Insights and Forecast - by Application
- 6.1.1. Power Generation
- 6.1.2. Cement Industry
- 6.1.3. Iron & Steel Industry
- 6.1.4. Chemical Industry
- 6.1.5. Others
- 6.2. Market Analysis, Insights and Forecast - by Type
- 6.2.1. Electrostatic Precipitators (ESP)
- 6.2.2. Flue Gas Desulfurization (FGD)
- 6.2.3. Scrubbers
- 6.2.4. Selective Catalytic Reduction (SCR)
- 6.2.5. Fabric Filters
- 6.1. Market Analysis, Insights and Forecast - by Application
- 7. North America Air Pollution Control System Industry Analysis, Insights and Forecast, 2020-2032
- 7.1. Market Analysis, Insights and Forecast - by Application
- 7.1.1. Power Generation
- 7.1.2. Cement Industry
- 7.1.3. Iron & Steel Industry
- 7.1.4. Chemical Industry
- 7.1.5. Others
- 7.2. Market Analysis, Insights and Forecast - by Type
- 7.2.1. Electrostatic Precipitators (ESP)
- 7.2.2. Flue Gas Desulfurization (FGD)
- 7.2.3. Scrubbers
- 7.2.4. Selective Catalytic Reduction (SCR)
- 7.2.5. Fabric Filters
- 7.1. Market Analysis, Insights and Forecast - by Application
- 8. Asia Pacific Air Pollution Control System Industry Analysis, Insights and Forecast, 2020-2032
- 8.1. Market Analysis, Insights and Forecast - by Application
- 8.1.1. Power Generation
- 8.1.2. Cement Industry
- 8.1.3. Iron & Steel Industry
- 8.1.4. Chemical Industry
- 8.1.5. Others
- 8.2. Market Analysis, Insights and Forecast - by Type
- 8.2.1. Electrostatic Precipitators (ESP)
- 8.2.2. Flue Gas Desulfurization (FGD)
- 8.2.3. Scrubbers
- 8.2.4. Selective Catalytic Reduction (SCR)
- 8.2.5. Fabric Filters
- 8.1. Market Analysis, Insights and Forecast - by Application
- 9. Europe Air Pollution Control System Industry Analysis, Insights and Forecast, 2020-2032
- 9.1. Market Analysis, Insights and Forecast - by Application
- 9.1.1. Power Generation
- 9.1.2. Cement Industry
- 9.1.3. Iron & Steel Industry
- 9.1.4. Chemical Industry
- 9.1.5. Others
- 9.2. Market Analysis, Insights and Forecast - by Type
- 9.2.1. Electrostatic Precipitators (ESP)
- 9.2.2. Flue Gas Desulfurization (FGD)
- 9.2.3. Scrubbers
- 9.2.4. Selective Catalytic Reduction (SCR)
- 9.2.5. Fabric Filters
- 9.1. Market Analysis, Insights and Forecast - by Application
- 10. South America Air Pollution Control System Industry Analysis, Insights and Forecast, 2020-2032
- 10.1. Market Analysis, Insights and Forecast - by Application
- 10.1.1. Power Generation
- 10.1.2. Cement Industry
- 10.1.3. Iron & Steel Industry
- 10.1.4. Chemical Industry
- 10.1.5. Others
- 10.2. Market Analysis, Insights and Forecast - by Type
- 10.2.1. Electrostatic Precipitators (ESP)
- 10.2.2. Flue Gas Desulfurization (FGD)
- 10.2.3. Scrubbers
- 10.2.4. Selective Catalytic Reduction (SCR)
- 10.2.5. Fabric Filters
- 10.1. Market Analysis, Insights and Forecast - by Application
- 11. Middle East and Africa Air Pollution Control System Industry Analysis, Insights and Forecast, 2020-2032
- 11.1. Market Analysis, Insights and Forecast - by Application
- 11.1.1. Power Generation
- 11.1.2. Cement Industry
- 11.1.3. Iron & Steel Industry
- 11.1.4. Chemical Industry
- 11.1.5. Others
- 11.2. Market Analysis, Insights and Forecast - by Type
- 11.2.1. Electrostatic Precipitators (ESP)
- 11.2.2. Flue Gas Desulfurization (FGD)
- 11.2.3. Scrubbers
- 11.2.4. Selective Catalytic Reduction (SCR)
- 11.2.5. Fabric Filters
- 11.1. Market Analysis, Insights and Forecast - by Application
- 12. Competitive Analysis
- 12.1. Company Profiles
- 12.1.1 Thermax Ltd
- 12.1.1.1. Company Overview
- 12.1.1.2. Products
- 12.1.1.3. Company Financials
- 12.1.1.4. SWOT Analysis
- 12.1.2 Pure Air Solutions
- 12.1.2.1. Company Overview
- 12.1.2.2. Products
- 12.1.2.3. Company Financials
- 12.1.2.4. SWOT Analysis
- 12.1.3 Gea Bischoff
- 12.1.3.1. Company Overview
- 12.1.3.2. Products
- 12.1.3.3. Company Financials
- 12.1.3.4. SWOT Analysis
- 12.1.4 General Electric
- 12.1.4.1. Company Overview
- 12.1.4.2. Products
- 12.1.4.3. Company Financials
- 12.1.4.4. SWOT Analysis
- 12.1.5 Ducon Technologies Inc
- 12.1.5.1. Company Overview
- 12.1.5.2. Products
- 12.1.5.3. Company Financials
- 12.1.5.4. SWOT Analysis
- 12.1.6 Horiba Ltd
- 12.1.6.1. Company Overview
- 12.1.6.2. Products
- 12.1.6.3. Company Financials
- 12.1.6.4. SWOT Analysis
- 12.1.7 Hamon Corporation
- 12.1.7.1. Company Overview
- 12.1.7.2. Products
- 12.1.7.3. Company Financials
- 12.1.7.4. SWOT Analysis
- 12.1.8 Andritz Ag
- 12.1.8.1. Company Overview
- 12.1.8.2. Products
- 12.1.8.3. Company Financials
- 12.1.8.4. SWOT Analysis
- 12.1.9 Siemens AG
- 12.1.9.1. Company Overview
- 12.1.9.2. Products
- 12.1.9.3. Company Financials
- 12.1.9.4. SWOT Analysis
- 12.1.10 Mitsubishi Hitachi Power Systems Ltd
- 12.1.10.1. Company Overview
- 12.1.10.2. Products
- 12.1.10.3. Company Financials
- 12.1.10.4. SWOT Analysis
- 12.1.11 Calgon Carbon Corporation
- 12.1.11.1. Company Overview
- 12.1.11.2. Products
- 12.1.11.3. Company Financials
- 12.1.11.4. SWOT Analysis
- 12.1.12 Fujian Longking Co Ltd
- 12.1.12.1. Company Overview
- 12.1.12.2. Products
- 12.1.12.3. Company Financials
- 12.1.12.4. SWOT Analysis
- 12.1.13 Babcock & Wilcox Enterprises Inc
- 12.1.13.1. Company Overview
- 12.1.13.2. Products
- 12.1.13.3. Company Financials
- 12.1.13.4. SWOT Analysis
- 12.1.14 Tri-mer
- 12.1.14.1. Company Overview
- 12.1.14.2. Products
- 12.1.14.3. Company Financials
- 12.1.14.4. SWOT Analysis
- 12.1.15 Amec Foster Wheeler
- 12.1.15.1. Company Overview
- 12.1.15.2. Products
- 12.1.15.3. Company Financials
- 12.1.15.4. SWOT Analysis
- 12.1.16 Esco International
- 12.1.16.1. Company Overview
- 12.1.16.2. Products
- 12.1.16.3. Company Financials
- 12.1.16.4. SWOT Analysis
- 12.1.1 Thermax Ltd
- 12.2. Market Entropy
- 12.2.1 Company's Key Areas Served
- 12.2.2 Recent Developments
- 12.3. Company Market Share Analysis 2025
- 12.3.1 Top 5 Companies Market Share Analysis
- 12.3.2 Top 3 Companies Market Share Analysis
- 12.4. List of Potential Customers
- 13. Research Methodology
List of Figures
- Figure 1: Global Air Pollution Control System Industry Revenue Breakdown (billion, %) by Region 2025 & 2033
- Figure 2: North America Air Pollution Control System Industry Revenue (billion), by Application 2025 & 2033
- Figure 3: North America Air Pollution Control System Industry Revenue Share (%), by Application 2025 & 2033
- Figure 4: North America Air Pollution Control System Industry Revenue (billion), by Type 2025 & 2033
- Figure 5: North America Air Pollution Control System Industry Revenue Share (%), by Type 2025 & 2033
- Figure 6: North America Air Pollution Control System Industry Revenue (billion), by Country 2025 & 2033
- Figure 7: North America Air Pollution Control System Industry Revenue Share (%), by Country 2025 & 2033
- Figure 8: Asia Pacific Air Pollution Control System Industry Revenue (billion), by Application 2025 & 2033
- Figure 9: Asia Pacific Air Pollution Control System Industry Revenue Share (%), by Application 2025 & 2033
- Figure 10: Asia Pacific Air Pollution Control System Industry Revenue (billion), by Type 2025 & 2033
- Figure 11: Asia Pacific Air Pollution Control System Industry Revenue Share (%), by Type 2025 & 2033
- Figure 12: Asia Pacific Air Pollution Control System Industry Revenue (billion), by Country 2025 & 2033
- Figure 13: Asia Pacific Air Pollution Control System Industry Revenue Share (%), by Country 2025 & 2033
- Figure 14: Europe Air Pollution Control System Industry Revenue (billion), by Application 2025 & 2033
- Figure 15: Europe Air Pollution Control System Industry Revenue Share (%), by Application 2025 & 2033
- Figure 16: Europe Air Pollution Control System Industry Revenue (billion), by Type 2025 & 2033
- Figure 17: Europe Air Pollution Control System Industry Revenue Share (%), by Type 2025 & 2033
- Figure 18: Europe Air Pollution Control System Industry Revenue (billion), by Country 2025 & 2033
- Figure 19: Europe Air Pollution Control System Industry Revenue Share (%), by Country 2025 & 2033
- Figure 20: South America Air Pollution Control System Industry Revenue (billion), by Application 2025 & 2033
- Figure 21: South America Air Pollution Control System Industry Revenue Share (%), by Application 2025 & 2033
- Figure 22: South America Air Pollution Control System Industry Revenue (billion), by Type 2025 & 2033
- Figure 23: South America Air Pollution Control System Industry Revenue Share (%), by Type 2025 & 2033
- Figure 24: South America Air Pollution Control System Industry Revenue (billion), by Country 2025 & 2033
- Figure 25: South America Air Pollution Control System Industry Revenue Share (%), by Country 2025 & 2033
- Figure 26: Middle East and Africa Air Pollution Control System Industry Revenue (billion), by Application 2025 & 2033
- Figure 27: Middle East and Africa Air Pollution Control System Industry Revenue Share (%), by Application 2025 & 2033
- Figure 28: Middle East and Africa Air Pollution Control System Industry Revenue (billion), by Type 2025 & 2033
- Figure 29: Middle East and Africa Air Pollution Control System Industry Revenue Share (%), by Type 2025 & 2033
- Figure 30: Middle East and Africa Air Pollution Control System Industry Revenue (billion), by Country 2025 & 2033
- Figure 31: Middle East and Africa Air Pollution Control System Industry Revenue Share (%), by Country 2025 & 2033
List of Tables
- Table 1: Global Air Pollution Control System Industry Revenue billion Forecast, by Application 2020 & 2033
- Table 2: Global Air Pollution Control System Industry Revenue billion Forecast, by Type 2020 & 2033
- Table 3: Global Air Pollution Control System Industry Revenue billion Forecast, by Region 2020 & 2033
- Table 4: Global Air Pollution Control System Industry Revenue billion Forecast, by Application 2020 & 2033
- Table 5: Global Air Pollution Control System Industry Revenue billion Forecast, by Type 2020 & 2033
- Table 6: Global Air Pollution Control System Industry Revenue billion Forecast, by Country 2020 & 2033
- Table 7: United States Air Pollution Control System Industry Revenue (billion) Forecast, by Application 2020 & 2033
- Table 8: Canada Air Pollution Control System Industry Revenue (billion) Forecast, by Application 2020 & 2033
- Table 9: Rest of North America Air Pollution Control System Industry Revenue (billion) Forecast, by Application 2020 & 2033
- Table 10: Global Air Pollution Control System Industry Revenue billion Forecast, by Application 2020 & 2033
- Table 11: Global Air Pollution Control System Industry Revenue billion Forecast, by Type 2020 & 2033
- Table 12: Global Air Pollution Control System Industry Revenue billion Forecast, by Country 2020 & 2033
- Table 13: India Air Pollution Control System Industry Revenue (billion) Forecast, by Application 2020 & 2033
- Table 14: China Air Pollution Control System Industry Revenue (billion) Forecast, by Application 2020 & 2033
- Table 15: Japan Air Pollution Control System Industry Revenue (billion) Forecast, by Application 2020 & 2033
- Table 16: Australia Air Pollution Control System Industry Revenue (billion) Forecast, by Application 2020 & 2033
- Table 17: Rest of Asia Pacific Air Pollution Control System Industry Revenue (billion) Forecast, by Application 2020 & 2033
- Table 18: Global Air Pollution Control System Industry Revenue billion Forecast, by Application 2020 & 2033
- Table 19: Global Air Pollution Control System Industry Revenue billion Forecast, by Type 2020 & 2033
- Table 20: Global Air Pollution Control System Industry Revenue billion Forecast, by Country 2020 & 2033
- Table 21: Germany Air Pollution Control System Industry Revenue (billion) Forecast, by Application 2020 & 2033
- Table 22: France Air Pollution Control System Industry Revenue (billion) Forecast, by Application 2020 & 2033
- Table 23: United Kingdom Air Pollution Control System Industry Revenue (billion) Forecast, by Application 2020 & 2033
- Table 24: Italy Air Pollution Control System Industry Revenue (billion) Forecast, by Application 2020 & 2033
- Table 25: Rest of Europe Air Pollution Control System Industry Revenue (billion) Forecast, by Application 2020 & 2033
- Table 26: Global Air Pollution Control System Industry Revenue billion Forecast, by Application 2020 & 2033
- Table 27: Global Air Pollution Control System Industry Revenue billion Forecast, by Type 2020 & 2033
- Table 28: Global Air Pollution Control System Industry Revenue billion Forecast, by Country 2020 & 2033
- Table 29: Brazil Air Pollution Control System Industry Revenue (billion) Forecast, by Application 2020 & 2033
- Table 30: Argentina Air Pollution Control System Industry Revenue (billion) Forecast, by Application 2020 & 2033
- Table 31: Chile Air Pollution Control System Industry Revenue (billion) Forecast, by Application 2020 & 2033
- Table 32: Rest of South America Air Pollution Control System Industry Revenue (billion) Forecast, by Application 2020 & 2033
- Table 33: Global Air Pollution Control System Industry Revenue billion Forecast, by Application 2020 & 2033
- Table 34: Global Air Pollution Control System Industry Revenue billion Forecast, by Type 2020 & 2033
- Table 35: Global Air Pollution Control System Industry Revenue billion Forecast, by Country 2020 & 2033
- Table 36: Saudi Arabia Air Pollution Control System Industry Revenue (billion) Forecast, by Application 2020 & 2033
- Table 37: South Africa Air Pollution Control System Industry Revenue (billion) Forecast, by Application 2020 & 2033
- Table 38: Algeria Air Pollution Control System Industry Revenue (billion) Forecast, by Application 2020 & 2033
- Table 39: Rest of Middle East and Africa Air Pollution Control System Industry Revenue (billion) Forecast, by Application 2020 & 2033
Frequently Asked Questions
1. What is the projected Compound Annual Growth Rate (CAGR) of the Air Pollution Control System Industry?
The projected CAGR is approximately 6.3%.
2. Which companies are prominent players in the Air Pollution Control System Industry?
Key companies in the market include Thermax Ltd, Pure Air Solutions, Gea Bischoff, General Electric, Ducon Technologies Inc, Horiba Ltd, Hamon Corporation, Andritz Ag, Siemens AG, Mitsubishi Hitachi Power Systems Ltd, Calgon Carbon Corporation, Fujian Longking Co Ltd, Babcock & Wilcox Enterprises Inc, Tri-mer, Amec Foster Wheeler, Esco International.
3. What are the main segments of the Air Pollution Control System Industry?
The market segments include Application, Type.
4. Can you provide details about the market size?
The market size is estimated to be USD 103.66 billion as of 2022.
5. What are some drivers contributing to market growth?
4.; Increasing Amount of Waste Generation. Growing Concern for Waste Management to Meet the Needs for Sustainable Urban Living4.; Increasing Focus on Non-fossil Fuel Sources of Energy.
6. What are the notable trends driving market growth?
Increasing Demand from Power Generation Industry.
7. Are there any restraints impacting market growth?
4.; Expensive Nature of Incinerators.
8. Can you provide examples of recent developments in the market?
N/A
9. What pricing options are available for accessing the report?
Pricing options include single-user, multi-user, and enterprise licenses priced at USD 4750, USD 5250, and USD 8750 respectively.
10. Is the market size provided in terms of value or volume?
The market size is provided in terms of value, measured in billion.
11. Are there any specific market keywords associated with the report?
Yes, the market keyword associated with the report is "Air Pollution Control System Industry," which aids in identifying and referencing the specific market segment covered.
12. How do I determine which pricing option suits my needs best?
The pricing options vary based on user requirements and access needs. Individual users may opt for single-user licenses, while businesses requiring broader access may choose multi-user or enterprise licenses for cost-effective access to the report.
13. Are there any additional resources or data provided in the Air Pollution Control System Industry report?
While the report offers comprehensive insights, it's advisable to review the specific contents or supplementary materials provided to ascertain if additional resources or data are available.
14. How can I stay updated on further developments or reports in the Air Pollution Control System Industry?
To stay informed about further developments, trends, and reports in the Air Pollution Control System Industry, consider subscribing to industry newsletters, following relevant companies and organizations, or regularly checking reputable industry news sources and publications.
Methodology
Step 1 - Identification of Relevant Samples Size from Population Database


Step 2 - Approaches for Defining Global Market Size (Value, Volume* & Price*)

Note*: In applicable scenarios
Step 3 - Data Sources
Primary Research
- Web Analytics
- Survey Reports
- Research Institute
- Latest Research Reports
- Opinion Leaders
Secondary Research
- Annual Reports
- White Paper
- Latest Press Release
- Industry Association
- Paid Database
- Investor Presentations

Step 4 - Data Triangulation
Involves using different sources of information in order to increase the validity of a study
These sources are likely to be stakeholders in a program - participants, other researchers, program staff, other community members, and so on.
Then we put all data in single framework & apply various statistical tools to find out the dynamic on the market.
During the analysis stage, feedback from the stakeholder groups would be compared to determine areas of agreement as well as areas of divergence