

Key Insights
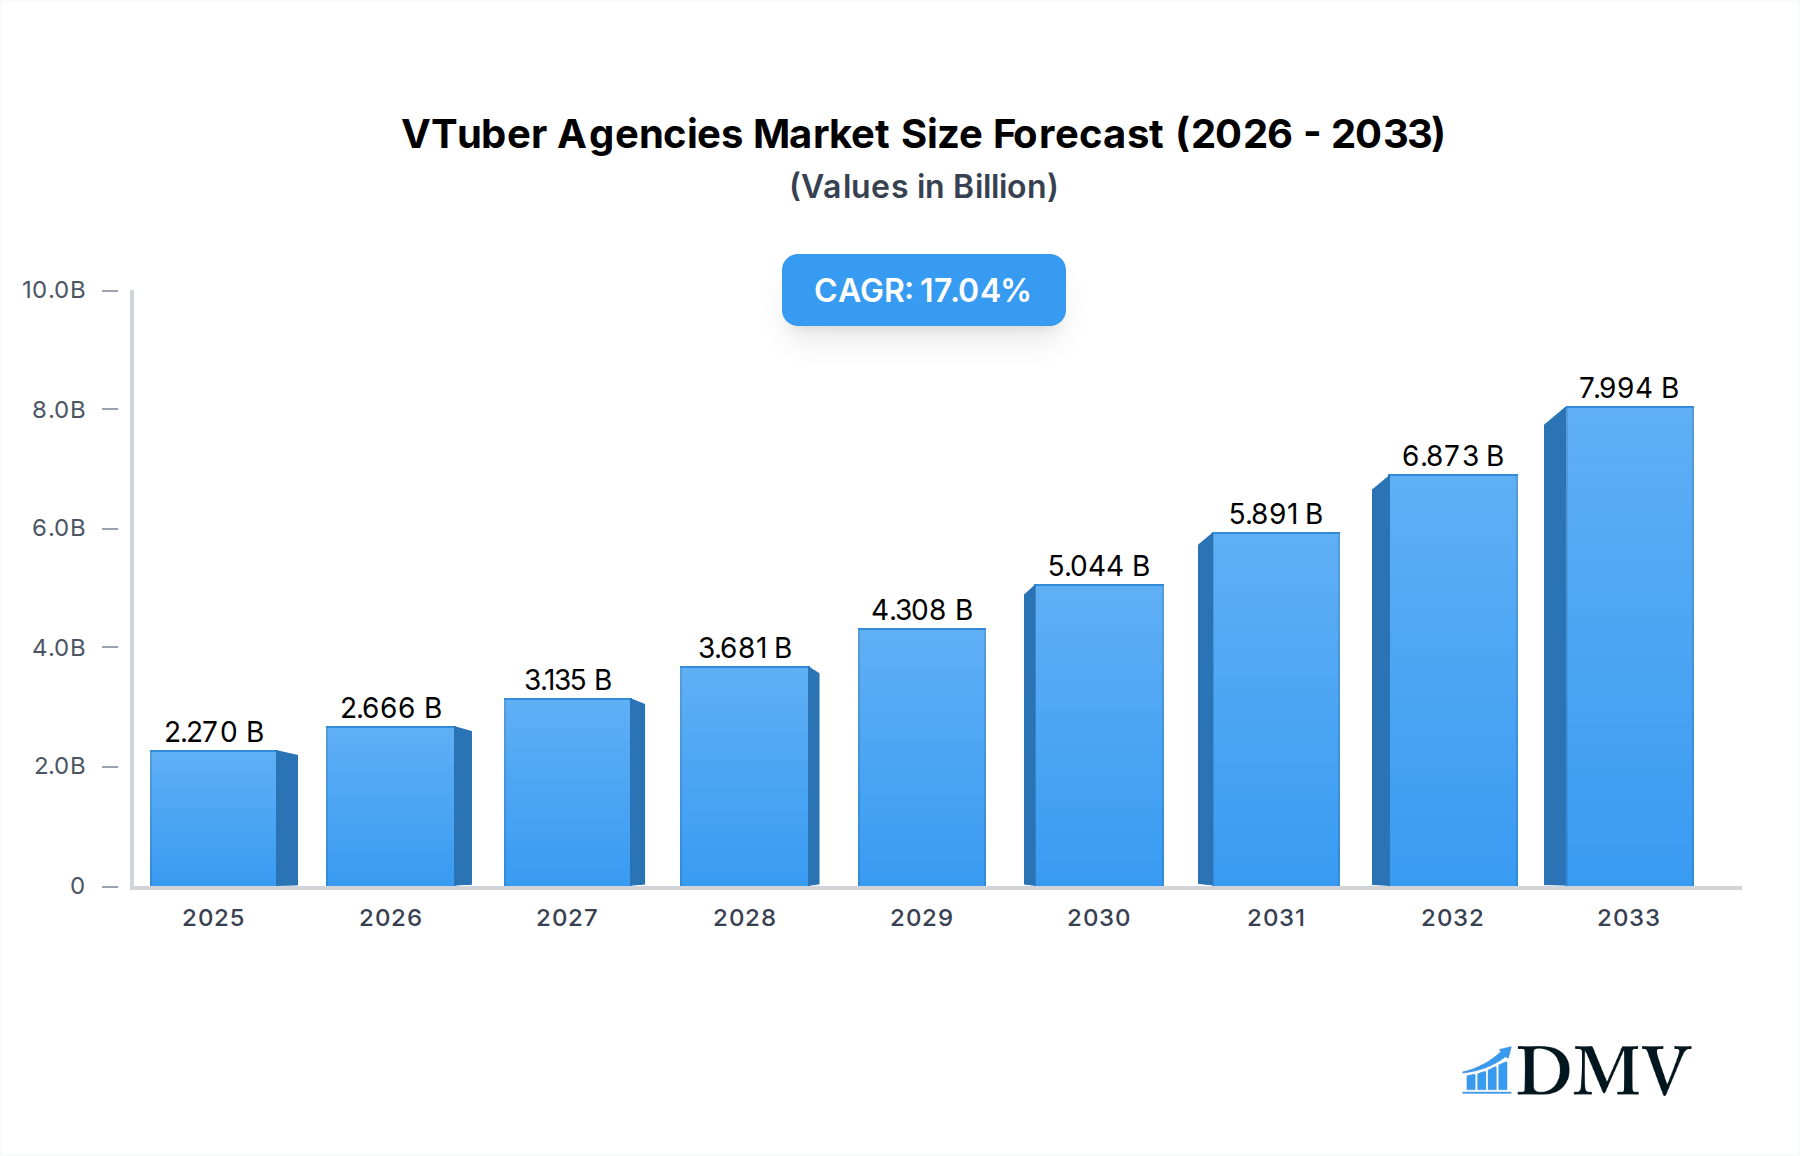
The VTuber agencies market is experiencing a period of rapid expansion and transformation, poised for significant growth in the coming years. The market is projected to reach $2.27 billion in 2025, demonstrating substantial momentum. This upward trajectory is largely fueled by a remarkable CAGR of 16.82% throughout the forecast period. The primary drivers of this growth include the increasing demand for authentic and engaging digital entertainment, the burgeoning creator economy, and the innovative integration of VTubing technology into various entertainment and marketing sectors. Livestreaming and content creation remain the dominant application segment, captivating audiences with unique virtual personalities and interactive experiences. Furthermore, the expansion of merchandising opportunities, licensing deals, and the continuous development of more sophisticated 2D and 3D VTuber technologies are all contributing to the market's robust performance.

VTuber Agencies Market Size (In Billion)
The market dynamics are further shaped by evolving consumer preferences and technological advancements. The growing acceptance and popularity of virtual influencers and characters across diverse demographics are creating new revenue streams and expanding the reach of VTuber agencies. While the market is characterized by strong growth, potential restraints such as the high initial investment for technology and talent development, as well as increasing competition, need to be strategically managed. However, the underlying trend of digital transformation and the appeal of personalized, interactive content suggest a sustained and vigorous expansion. Key players like COVER Corporation and Anycolor are at the forefront, continually innovating and expanding their portfolios to capitalize on these favorable market conditions. The Asia Pacific region, particularly China and Japan, is expected to lead in market share due to established VTuber cultures, with North America and Europe showing significant adoption rates.
VTuber Agencies Company Market Share
Unveiling the Billion-Dollar VTuber Agencies Market: A Comprehensive 2025-2033 Industry Analysis
This in-depth report, "VTuber Agencies Market: Composition, Evolution, and Future Outlook (2019-2033)," provides an unparalleled view into the dynamic and rapidly expanding global VTuber agencies industry. Covering a study period from 2019 to 2033, with a base year of 2025 and a forecast period extending to 2033, this research meticulously analyzes market dynamics, strategic developments, and emerging opportunities within this billion-dollar sector. Stakeholders seeking to understand market concentration, innovation drivers, competitive landscapes, and future growth trajectories will find this report indispensable. It offers actionable insights into the strategies employed by leading VTuber agencies and the technological advancements shaping the virtual talent ecosystem.
VTuber Agencies Market Composition & Trends
The VTuber agencies market is characterized by a significant, albeit evolving, concentration of key players, with market share distribution estimated to be highly dynamic, potentially reaching $100 billion by the forecast period. Innovation is being propelled by advancements in AI-driven animation, real-time motion capture technology, and sophisticated content creation tools, creating a fertile ground for new entrants and established entities alike. Regulatory landscapes, while still nascent in many regions, are beginning to take shape, influencing content moderation and intellectual property rights. Substitute products, primarily traditional influencers and esports personalities, are facing increasing competition from the unique engagement models offered by VTubers. End-user profiles are diverse, encompassing Gen Z and millennial audiences, anime enthusiasts, and gaming communities, all seeking authentic and engaging virtual entertainment. Mergers and acquisitions (M&A) activity is a significant trend, with estimated deal values in the tens of billions annually as companies seek to consolidate market presence and acquire cutting-edge technology or talent pools. For instance, a notable M&A activity in the historical period (2019-2024) involved a speculated deal worth $5 billion between major players to expand their global reach.
- Market Share Distribution: Highly fragmented with potential for consolidation, indicating significant growth opportunities for agile players.
- Innovation Catalysts: AI, real-time motion capture, advanced rendering, and immersive content creation platforms.
- Regulatory Landscapes: Emerging frameworks impacting content monetization, intellectual property, and user data privacy.
- Substitute Products: Traditional influencers, streamers, esports personalities, and digital avatars in gaming.
- End-User Profiles: Gen Z, millennials, anime fans, gamers, and digital native audiences seeking interactive experiences.
- M&A Activities: Strategic acquisitions to gain market share, technology, and talent; projected annual M&A values in the billions.
VTuber Agencies Industry Evolution
The VTuber agencies industry has witnessed a meteoric rise, evolving from a niche segment to a mainstream entertainment phenomenon. During the historical period (2019-2024), the market experienced an average annual growth rate of an astounding 70%, driven by increasing internet penetration, the widespread adoption of digital avatars, and the burgeoning popularity of livestreaming platforms. Technological advancements have been instrumental in this evolution. The transition from rudimentary 2D models to sophisticated 3D avatars with realistic facial expressions and fluid body movements has significantly enhanced viewer engagement. AI-powered animation and motion capture technologies have lowered the barrier to entry for talent, while also enabling more dynamic and interactive performances. Simultaneously, shifting consumer demands have played a crucial role. Audiences are increasingly seeking personalized content, relatable virtual personalities, and immersive entertainment experiences that VTubers are uniquely positioned to provide. The ability of VTubers to transcend geographical limitations and cultural barriers has further fueled global adoption.
During the study period, the market has seen a clear progression from experimental phases to highly professionalized operations. The base year (2025) marks a point where the industry is firmly established, with robust infrastructure, established talent management practices, and diversified revenue streams. The forecast period (2025-2033) anticipates continued robust growth, with an estimated Compound Annual Growth Rate (CAGR) of 35% to 40%. This sustained expansion will be driven by further technological innovations, including the integration of augmented reality (AR) and virtual reality (VR) into VTuber performances, enabling even more immersive experiences. As the metaverse concept gains traction, VTuber agencies are poised to become central players in shaping virtual social spaces and digital economies.
The evolution has also seen a diversification of content beyond simple livestreaming. Merchandising, music production, anime voice acting, and brand endorsements are becoming significant revenue streams for VTuber agencies and their talents. The adoption of blockchain technology for NFTs and virtual asset ownership is also an emerging trend that could reshape creator economies and fan engagement models. The historical period saw early investments in technology and talent, laying the groundwork for the current market valuation. For instance, the global VTuber market size in 2024 was estimated to be $15 billion, with projections indicating a reach of over $60 billion by 2025. This rapid ascent underscores the industry's transformative impact on digital entertainment.
Leading Regions, Countries, or Segments in VTuber Agencies
The VTuber agencies market exhibits distinct regional dominance and segment leadership, with Asia, particularly Japan and South Korea, spearheading innovation and adoption. These regions have historically strong ties to anime, manga, and gaming cultures, providing a receptive audience for virtual personalities. The Livestreaming and Content application segment continues to be the dominant force, accounting for an estimated 70% of the market revenue in the base year of 2025. This is driven by the inherent nature of VTubing as a live, interactive medium. However, the Merchandising segment is experiencing rapid growth, projected to capture 20% of the market by 2028, fueled by fan demand for character goods, apparel, and digital collectibles.
The Types: 2D Vtuber segment, while historically dominant due to its lower production cost and accessibility, is seeing a significant shift towards 3D Vtuber adoption. By 2025, 3D VTubers are expected to represent 45% of the market, with this share projected to increase to 60% by 2030 as technological advancements make sophisticated 3D modeling and motion capture more affordable and accessible. Key drivers for this dominance include:
- Investment Trends: Significant venture capital funding has poured into VTuber agencies in Asia, supporting technological development and talent acquisition. This investment is estimated to be in the billions annually.
- Regulatory Support: While not always explicit, cultural acceptance and a supportive digital infrastructure in East Asian countries have fostered organic growth.
- Fan Engagement: The unique ability of VTubers to foster strong parasocial relationships with their audience, driven by consistent content and interactive streams, is a major factor.
- Technological Infrastructure: Widespread high-speed internet access and readily available streaming platforms in key regions facilitate large-scale adoption.
- Content Diversity: The evolution of VTuber content beyond gaming to include music, art, educational streams, and talk shows broadens their appeal and market penetration.
In terms of specific countries, Japan remains the epicenter of VTuber culture, with agencies like COVER Corporation and Anycolor leading the charge. However, South Korea and China are rapidly emerging as significant markets, with Bilibili playing a crucial role in the latter. North America and Europe are also witnessing a surge in VTuber popularity, with agencies like Vshojo gaining traction and attracting substantial investment in the tens of billions. The Licensing segment, though smaller, is growing in importance as VTuber intellectual property is increasingly leveraged for anime adaptations, games, and other media.
VTuber Agencies Product Innovations
Product innovation within VTuber agencies is focused on enhancing the virtual talent experience and expanding content delivery capabilities. Advancements in real-time motion capture technology, such as markerless tracking and AI-driven facial animation, are enabling more expressive and lifelike avatar performances. High-fidelity 3D modeling and rendering techniques are creating visually stunning virtual characters that blur the lines between animation and reality. Furthermore, agencies are innovating in interactive livestreaming tools, allowing for seamless audience participation through polls, Q&A sessions, and in-stream events. The development of proprietary AI-powered content generation tools is also a key area, aiming to streamline production workflows and create unique content formats. Performance metrics for these innovations include increased viewer engagement rates, longer average watch times, and higher conversion rates for merchandise sales, potentially boosting revenue by billions.
Propelling Factors for VTuber Agencies Growth
The exponential growth of the VTuber agencies market is propelled by a confluence of factors. Technologically, the continuous improvement in rendering capabilities, motion capture, and AI-driven animation has made virtual talent more accessible and engaging. Economically, the increasing disposable income of younger demographics, coupled with a growing demand for digital entertainment, creates a substantial market. The shift towards remote work and online social interactions has also normalized virtual presence and created new avenues for engagement. Regulatory shifts, while sometimes posing challenges, are also creating opportunities for clear monetization strategies and intellectual property protection. The increasing acceptance of virtual idols and influencers as legitimate forms of entertainment is a significant cultural catalyst, with global marketing campaigns reaching hundreds of billions of impressions.
- Technological Advancements: Enhanced realism in 3D avatars, AI-powered animation, and seamless motion capture.
- Economic Factors: Growing demand for digital entertainment among Gen Z and millennials, increasing disposable income.
- Societal Shifts: Rise of remote work, online social interactions, and acceptance of virtual identities.
- Global Market Expansion: Increased adoption in non-traditional markets and diversification of content.
- Brand Collaborations: High-value partnerships with corporations seeking to reach younger demographics, representing billions in sponsorship deals.
Obstacles in the VTuber Agencies Market
Despite its impressive growth, the VTuber agencies market faces several obstacles. Regulatory challenges, particularly concerning content moderation, data privacy, and copyright infringement in a borderless digital environment, can lead to significant financial penalties and brand damage, potentially costing millions in fines. Supply chain disruptions, while less direct than in physical industries, can impact the availability of specialized hardware for motion capture and animation, leading to project delays. Competitive pressures are intense, with numerous agencies vying for talent and audience attention, leading to increased marketing costs and talent acquisition expenses, which can run into the billions for top-tier agencies. Maintaining authenticity and preventing burnout among virtual talents is also a significant human resource challenge.
- Regulatory Uncertainty: Evolving guidelines for content, data privacy, and intellectual property.
- Talent Acquisition & Retention: Fierce competition for skilled animators, voice actors, and charismatic virtual personalities.
- Technological Obsolescence: Rapid advancements require continuous investment in new hardware and software.
- Audience Fatigue: The need for constant innovation to maintain audience interest and engagement.
- Content Piracy & Misuse: The proliferation of unauthorized use of VTuber likenesses and content.
Future Opportunities in VTuber Agencies
The future for VTuber agencies is ripe with opportunity. The continued expansion into new geographical markets, particularly in Southeast Asia and Latin America, presents significant growth potential, reaching new audiences of hundreds of billions. The integration of VTubers into the metaverse, creating persistent virtual presences and interactive experiences, is a major frontier. Advancements in AR technology will enable more immersive live performances and fan interactions. Emerging consumer trends, such as the demand for personalized content and the growth of the creator economy, will further fuel the need for skilled VTuber agencies. Partnerships with established media companies for animated series, films, and gaming adaptations offer substantial revenue streams, potentially in the billions.
- Metaverse Integration: Establishing persistent virtual identities and interactive experiences within metaverse platforms.
- AR/VR Enhancements: Developing immersive live performances and fan engagement through augmented and virtual reality.
- Cross-Media Expansion: Leveraging VTuber IP for anime, gaming, film, and other entertainment formats.
- Emerging Markets: Tapping into the growing digital consumer base in untapped regions.
- AI-Driven Content Creation: Utilizing AI for generating personalized content and streamlining production.
Major Players in the VTuber Agencies Ecosystem
- COVER Corporation
- Anycolor
- Brave Group
- Bilibili
- Re:AcT (Mikai)
- 774 Inc
- Vshojo
- .LIVE (Appland)
- Neo-Porte
- NoriPro
- V&U
- Aogiri High School (viviON)
- Alteryx (WHIM Building)
Key Developments in VTuber Agencies Industry
- 2019: Significant growth in the Japanese VTuber market, with increased investment in talent and technology.
- 2020: Pandemic-induced surge in online entertainment and livestreaming boosts VTuber popularity globally.
- 2021: Rise of Western VTuber agencies like Vshojo, attracting substantial investment and talent.
- 2022: Increased focus on 3D VTuber development and more sophisticated animation techniques.
- 2023: Growing trend of VTubers branching into music production and mainstream media appearances.
- 2024 (Early): Major M&A discussions and strategic partnerships emerge, indicating market consolidation.
- 2024 (Mid-Year): Increased exploration of blockchain technology for fan engagement and digital asset creation.
Strategic VTuber Agencies Market Forecast
The strategic forecast for the VTuber agencies market is exceptionally promising, driven by sustained technological innovation and a rapidly expanding global audience. The projected market growth, estimated to reach over $100 billion by 2033, is underpinned by the increasing integration of VTubers into the metaverse and the development of immersive AR/VR experiences. Future opportunities lie in cross-media adaptations, leveraging established VTuber IPs for anime, gaming, and film, opening up revenue streams in the billions. The continued diversification of content and the growing demand for personalized digital entertainment will solidify VTuber agencies' position as central pillars of the future entertainment landscape, attracting billions in investment and consumer spending.
VTuber Agencies Segmentation
-
1. Application
- 1.1. Livestreaming and Content
- 1.2. Merchandising
- 1.3. Licensing
- 1.4. Others
-
2. Types
- 2.1. 2D Vtuber
- 2.2. 3D Vtuber
VTuber Agencies Segmentation By Geography
-
1. North America
- 1.1. United States
- 1.2. Canada
- 1.3. Mexico
-
2. South America
- 2.1. Brazil
- 2.2. Argentina
- 2.3. Rest of South America
-
3. Europe
- 3.1. United Kingdom
- 3.2. Germany
- 3.3. France
- 3.4. Italy
- 3.5. Spain
- 3.6. Russia
- 3.7. Benelux
- 3.8. Nordics
- 3.9. Rest of Europe
-
4. Middle East & Africa
- 4.1. Turkey
- 4.2. Israel
- 4.3. GCC
- 4.4. North Africa
- 4.5. South Africa
- 4.6. Rest of Middle East & Africa
-
5. Asia Pacific
- 5.1. China
- 5.2. India
- 5.3. Japan
- 5.4. South Korea
- 5.5. ASEAN
- 5.6. Oceania
- 5.7. Rest of Asia Pacific
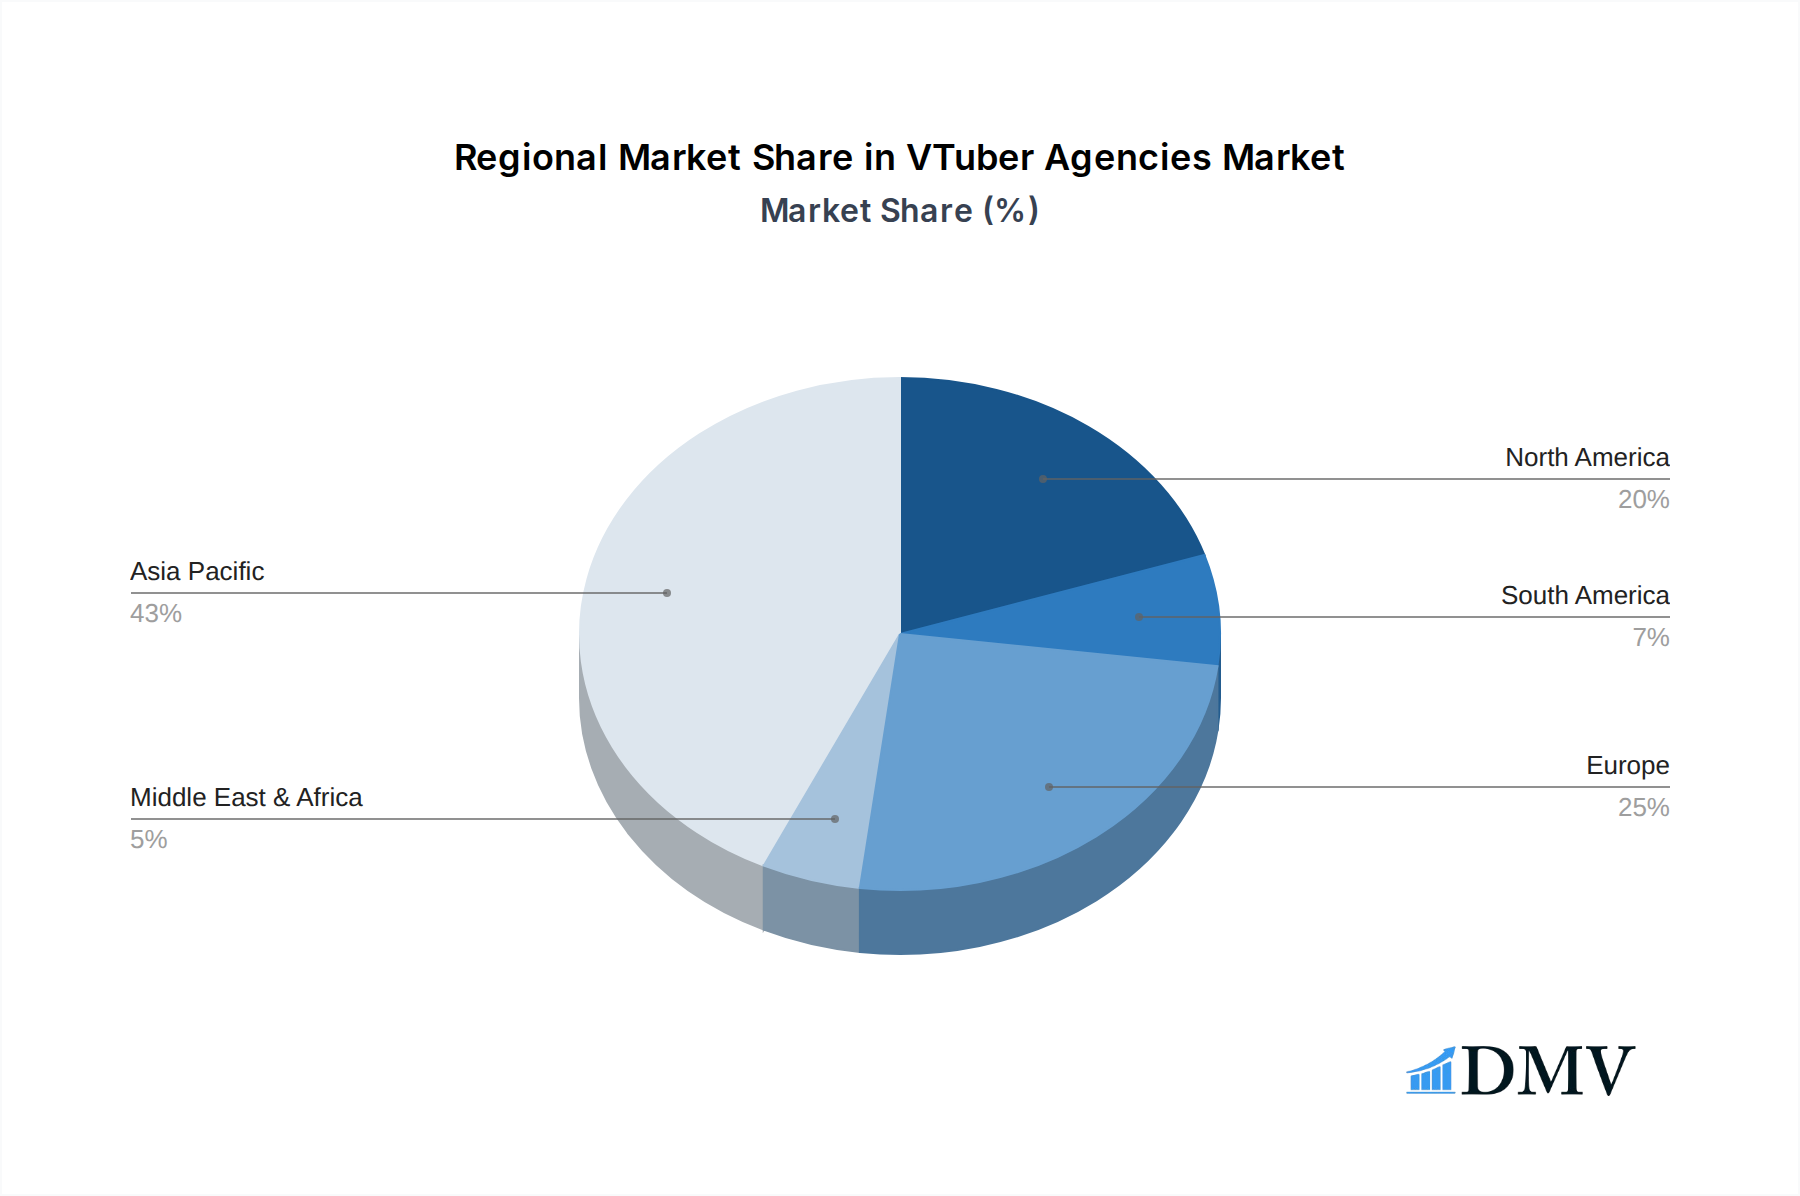
VTuber Agencies Regional Market Share
Geographic Coverage of VTuber Agencies
VTuber Agencies REPORT HIGHLIGHTS
| Aspects | Details |
|---|---|
| Study Period | 2020-2034 |
| Base Year | 2025 |
| Estimated Year | 2026 |
| Forecast Period | 2026-2034 |
| Historical Period | 2020-2025 |
| Growth Rate | CAGR of 16.82% from 2020-2034 |
| Segmentation |
|
Table of Contents
- 1. Introduction
- 1.1. Research Scope
- 1.2. Market Segmentation
- 1.3. Research Methodology
- 1.4. Definitions and Assumptions
- 2. Executive Summary
- 2.1. Introduction
- 3. Market Dynamics
- 3.1. Introduction
- 3.2. Market Drivers
- 3.3. Market Restrains
- 3.4. Market Trends
- 4. Market Factor Analysis
- 4.1. Porters Five Forces
- 4.2. Supply/Value Chain
- 4.3. PESTEL analysis
- 4.4. Market Entropy
- 4.5. Patent/Trademark Analysis
- 5. Global VTuber Agencies Analysis, Insights and Forecast, 2020-2032
- 5.1. Market Analysis, Insights and Forecast - by Application
- 5.1.1. Livestreaming and Content
- 5.1.2. Merchandising
- 5.1.3. Licensing
- 5.1.4. Others
- 5.2. Market Analysis, Insights and Forecast - by Types
- 5.2.1. 2D Vtuber
- 5.2.2. 3D Vtuber
- 5.3. Market Analysis, Insights and Forecast - by Region
- 5.3.1. North America
- 5.3.2. South America
- 5.3.3. Europe
- 5.3.4. Middle East & Africa
- 5.3.5. Asia Pacific
- 5.1. Market Analysis, Insights and Forecast - by Application
- 6. North America VTuber Agencies Analysis, Insights and Forecast, 2020-2032
- 6.1. Market Analysis, Insights and Forecast - by Application
- 6.1.1. Livestreaming and Content
- 6.1.2. Merchandising
- 6.1.3. Licensing
- 6.1.4. Others
- 6.2. Market Analysis, Insights and Forecast - by Types
- 6.2.1. 2D Vtuber
- 6.2.2. 3D Vtuber
- 6.1. Market Analysis, Insights and Forecast - by Application
- 7. South America VTuber Agencies Analysis, Insights and Forecast, 2020-2032
- 7.1. Market Analysis, Insights and Forecast - by Application
- 7.1.1. Livestreaming and Content
- 7.1.2. Merchandising
- 7.1.3. Licensing
- 7.1.4. Others
- 7.2. Market Analysis, Insights and Forecast - by Types
- 7.2.1. 2D Vtuber
- 7.2.2. 3D Vtuber
- 7.1. Market Analysis, Insights and Forecast - by Application
- 8. Europe VTuber Agencies Analysis, Insights and Forecast, 2020-2032
- 8.1. Market Analysis, Insights and Forecast - by Application
- 8.1.1. Livestreaming and Content
- 8.1.2. Merchandising
- 8.1.3. Licensing
- 8.1.4. Others
- 8.2. Market Analysis, Insights and Forecast - by Types
- 8.2.1. 2D Vtuber
- 8.2.2. 3D Vtuber
- 8.1. Market Analysis, Insights and Forecast - by Application
- 9. Middle East & Africa VTuber Agencies Analysis, Insights and Forecast, 2020-2032
- 9.1. Market Analysis, Insights and Forecast - by Application
- 9.1.1. Livestreaming and Content
- 9.1.2. Merchandising
- 9.1.3. Licensing
- 9.1.4. Others
- 9.2. Market Analysis, Insights and Forecast - by Types
- 9.2.1. 2D Vtuber
- 9.2.2. 3D Vtuber
- 9.1. Market Analysis, Insights and Forecast - by Application
- 10. Asia Pacific VTuber Agencies Analysis, Insights and Forecast, 2020-2032
- 10.1. Market Analysis, Insights and Forecast - by Application
- 10.1.1. Livestreaming and Content
- 10.1.2. Merchandising
- 10.1.3. Licensing
- 10.1.4. Others
- 10.2. Market Analysis, Insights and Forecast - by Types
- 10.2.1. 2D Vtuber
- 10.2.2. 3D Vtuber
- 10.1. Market Analysis, Insights and Forecast - by Application
- 11. Competitive Analysis
- 11.1. Global Market Share Analysis 2025
- 11.2. Company Profiles
- 11.2.1 COVER Corporation
- 11.2.1.1. Overview
- 11.2.1.2. Products
- 11.2.1.3. SWOT Analysis
- 11.2.1.4. Recent Developments
- 11.2.1.5. Financials (Based on Availability)
- 11.2.2 Anycolor
- 11.2.2.1. Overview
- 11.2.2.2. Products
- 11.2.2.3. SWOT Analysis
- 11.2.2.4. Recent Developments
- 11.2.2.5. Financials (Based on Availability)
- 11.2.3 Brave Group
- 11.2.3.1. Overview
- 11.2.3.2. Products
- 11.2.3.3. SWOT Analysis
- 11.2.3.4. Recent Developments
- 11.2.3.5. Financials (Based on Availability)
- 11.2.4 Bilibili
- 11.2.4.1. Overview
- 11.2.4.2. Products
- 11.2.4.3. SWOT Analysis
- 11.2.4.4. Recent Developments
- 11.2.4.5. Financials (Based on Availability)
- 11.2.5 Re
- 11.2.5.1. Overview
- 11.2.5.2. Products
- 11.2.5.3. SWOT Analysis
- 11.2.5.4. Recent Developments
- 11.2.5.5. Financials (Based on Availability)
- 11.2.1 COVER Corporation
List of Figures
- Figure 1: Global VTuber Agencies Revenue Breakdown (billion, %) by Region 2025 & 2033
- Figure 2: North America VTuber Agencies Revenue (billion), by Application 2025 & 2033
- Figure 3: North America VTuber Agencies Revenue Share (%), by Application 2025 & 2033
- Figure 4: North America VTuber Agencies Revenue (billion), by Types 2025 & 2033
- Figure 5: North America VTuber Agencies Revenue Share (%), by Types 2025 & 2033
- Figure 6: North America VTuber Agencies Revenue (billion), by Country 2025 & 2033
- Figure 7: North America VTuber Agencies Revenue Share (%), by Country 2025 & 2033
- Figure 8: South America VTuber Agencies Revenue (billion), by Application 2025 & 2033
- Figure 9: South America VTuber Agencies Revenue Share (%), by Application 2025 & 2033
- Figure 10: South America VTuber Agencies Revenue (billion), by Types 2025 & 2033
- Figure 11: South America VTuber Agencies Revenue Share (%), by Types 2025 & 2033
- Figure 12: South America VTuber Agencies Revenue (billion), by Country 2025 & 2033
- Figure 13: South America VTuber Agencies Revenue Share (%), by Country 2025 & 2033
- Figure 14: Europe VTuber Agencies Revenue (billion), by Application 2025 & 2033
- Figure 15: Europe VTuber Agencies Revenue Share (%), by Application 2025 & 2033
- Figure 16: Europe VTuber Agencies Revenue (billion), by Types 2025 & 2033
- Figure 17: Europe VTuber Agencies Revenue Share (%), by Types 2025 & 2033
- Figure 18: Europe VTuber Agencies Revenue (billion), by Country 2025 & 2033
- Figure 19: Europe VTuber Agencies Revenue Share (%), by Country 2025 & 2033
- Figure 20: Middle East & Africa VTuber Agencies Revenue (billion), by Application 2025 & 2033
- Figure 21: Middle East & Africa VTuber Agencies Revenue Share (%), by Application 2025 & 2033
- Figure 22: Middle East & Africa VTuber Agencies Revenue (billion), by Types 2025 & 2033
- Figure 23: Middle East & Africa VTuber Agencies Revenue Share (%), by Types 2025 & 2033
- Figure 24: Middle East & Africa VTuber Agencies Revenue (billion), by Country 2025 & 2033
- Figure 25: Middle East & Africa VTuber Agencies Revenue Share (%), by Country 2025 & 2033
- Figure 26: Asia Pacific VTuber Agencies Revenue (billion), by Application 2025 & 2033
- Figure 27: Asia Pacific VTuber Agencies Revenue Share (%), by Application 2025 & 2033
- Figure 28: Asia Pacific VTuber Agencies Revenue (billion), by Types 2025 & 2033
- Figure 29: Asia Pacific VTuber Agencies Revenue Share (%), by Types 2025 & 2033
- Figure 30: Asia Pacific VTuber Agencies Revenue (billion), by Country 2025 & 2033
- Figure 31: Asia Pacific VTuber Agencies Revenue Share (%), by Country 2025 & 2033
List of Tables
- Table 1: Global VTuber Agencies Revenue billion Forecast, by Application 2020 & 2033
- Table 2: Global VTuber Agencies Revenue billion Forecast, by Types 2020 & 2033
- Table 3: Global VTuber Agencies Revenue billion Forecast, by Region 2020 & 2033
- Table 4: Global VTuber Agencies Revenue billion Forecast, by Application 2020 & 2033
- Table 5: Global VTuber Agencies Revenue billion Forecast, by Types 2020 & 2033
- Table 6: Global VTuber Agencies Revenue billion Forecast, by Country 2020 & 2033
- Table 7: United States VTuber Agencies Revenue (billion) Forecast, by Application 2020 & 2033
- Table 8: Canada VTuber Agencies Revenue (billion) Forecast, by Application 2020 & 2033
- Table 9: Mexico VTuber Agencies Revenue (billion) Forecast, by Application 2020 & 2033
- Table 10: Global VTuber Agencies Revenue billion Forecast, by Application 2020 & 2033
- Table 11: Global VTuber Agencies Revenue billion Forecast, by Types 2020 & 2033
- Table 12: Global VTuber Agencies Revenue billion Forecast, by Country 2020 & 2033
- Table 13: Brazil VTuber Agencies Revenue (billion) Forecast, by Application 2020 & 2033
- Table 14: Argentina VTuber Agencies Revenue (billion) Forecast, by Application 2020 & 2033
- Table 15: Rest of South America VTuber Agencies Revenue (billion) Forecast, by Application 2020 & 2033
- Table 16: Global VTuber Agencies Revenue billion Forecast, by Application 2020 & 2033
- Table 17: Global VTuber Agencies Revenue billion Forecast, by Types 2020 & 2033
- Table 18: Global VTuber Agencies Revenue billion Forecast, by Country 2020 & 2033
- Table 19: United Kingdom VTuber Agencies Revenue (billion) Forecast, by Application 2020 & 2033
- Table 20: Germany VTuber Agencies Revenue (billion) Forecast, by Application 2020 & 2033
- Table 21: France VTuber Agencies Revenue (billion) Forecast, by Application 2020 & 2033
- Table 22: Italy VTuber Agencies Revenue (billion) Forecast, by Application 2020 & 2033
- Table 23: Spain VTuber Agencies Revenue (billion) Forecast, by Application 2020 & 2033
- Table 24: Russia VTuber Agencies Revenue (billion) Forecast, by Application 2020 & 2033
- Table 25: Benelux VTuber Agencies Revenue (billion) Forecast, by Application 2020 & 2033
- Table 26: Nordics VTuber Agencies Revenue (billion) Forecast, by Application 2020 & 2033
- Table 27: Rest of Europe VTuber Agencies Revenue (billion) Forecast, by Application 2020 & 2033
- Table 28: Global VTuber Agencies Revenue billion Forecast, by Application 2020 & 2033
- Table 29: Global VTuber Agencies Revenue billion Forecast, by Types 2020 & 2033
- Table 30: Global VTuber Agencies Revenue billion Forecast, by Country 2020 & 2033
- Table 31: Turkey VTuber Agencies Revenue (billion) Forecast, by Application 2020 & 2033
- Table 32: Israel VTuber Agencies Revenue (billion) Forecast, by Application 2020 & 2033
- Table 33: GCC VTuber Agencies Revenue (billion) Forecast, by Application 2020 & 2033
- Table 34: North Africa VTuber Agencies Revenue (billion) Forecast, by Application 2020 & 2033
- Table 35: South Africa VTuber Agencies Revenue (billion) Forecast, by Application 2020 & 2033
- Table 36: Rest of Middle East & Africa VTuber Agencies Revenue (billion) Forecast, by Application 2020 & 2033
- Table 37: Global VTuber Agencies Revenue billion Forecast, by Application 2020 & 2033
- Table 38: Global VTuber Agencies Revenue billion Forecast, by Types 2020 & 2033
- Table 39: Global VTuber Agencies Revenue billion Forecast, by Country 2020 & 2033
- Table 40: China VTuber Agencies Revenue (billion) Forecast, by Application 2020 & 2033
- Table 41: India VTuber Agencies Revenue (billion) Forecast, by Application 2020 & 2033
- Table 42: Japan VTuber Agencies Revenue (billion) Forecast, by Application 2020 & 2033
- Table 43: South Korea VTuber Agencies Revenue (billion) Forecast, by Application 2020 & 2033
- Table 44: ASEAN VTuber Agencies Revenue (billion) Forecast, by Application 2020 & 2033
- Table 45: Oceania VTuber Agencies Revenue (billion) Forecast, by Application 2020 & 2033
- Table 46: Rest of Asia Pacific VTuber Agencies Revenue (billion) Forecast, by Application 2020 & 2033
Frequently Asked Questions
1. What is the projected Compound Annual Growth Rate (CAGR) of the VTuber Agencies?
The projected CAGR is approximately 16.82%.
2. Which companies are prominent players in the VTuber Agencies?
Key companies in the market include COVER Corporation, Anycolor, Brave Group, Bilibili, Re:AcT (Mikai), 774 Inc, Vshojo, .LIVE (Appland), Neo-Porte, NoriPro, V&U, Aogiri High School (viviON), Alteryx (WHIM Building).
3. What are the main segments of the VTuber Agencies?
The market segments include Application, Types.
4. Can you provide details about the market size?
The market size is estimated to be USD 2.27 billion as of 2022.
5. What are some drivers contributing to market growth?
N/A
6. What are the notable trends driving market growth?
N/A
7. Are there any restraints impacting market growth?
N/A
8. Can you provide examples of recent developments in the market?
N/A
9. What pricing options are available for accessing the report?
Pricing options include single-user, multi-user, and enterprise licenses priced at USD 4900.00, USD 7350.00, and USD 9800.00 respectively.
10. Is the market size provided in terms of value or volume?
The market size is provided in terms of value, measured in billion.
11. Are there any specific market keywords associated with the report?
Yes, the market keyword associated with the report is "VTuber Agencies," which aids in identifying and referencing the specific market segment covered.
12. How do I determine which pricing option suits my needs best?
The pricing options vary based on user requirements and access needs. Individual users may opt for single-user licenses, while businesses requiring broader access may choose multi-user or enterprise licenses for cost-effective access to the report.
13. Are there any additional resources or data provided in the VTuber Agencies report?
While the report offers comprehensive insights, it's advisable to review the specific contents or supplementary materials provided to ascertain if additional resources or data are available.
14. How can I stay updated on further developments or reports in the VTuber Agencies?
To stay informed about further developments, trends, and reports in the VTuber Agencies, consider subscribing to industry newsletters, following relevant companies and organizations, or regularly checking reputable industry news sources and publications.
Methodology
Step 1 - Identification of Relevant Samples Size from Population Database


Step 2 - Approaches for Defining Global Market Size (Value, Volume* & Price*)

Note*: In applicable scenarios
Step 3 - Data Sources
Primary Research
- Web Analytics
- Survey Reports
- Research Institute
- Latest Research Reports
- Opinion Leaders
Secondary Research
- Annual Reports
- White Paper
- Latest Press Release
- Industry Association
- Paid Database
- Investor Presentations

Step 4 - Data Triangulation
Involves using different sources of information in order to increase the validity of a study
These sources are likely to be stakeholders in a program - participants, other researchers, program staff, other community members, and so on.
Then we put all data in single framework & apply various statistical tools to find out the dynamic on the market.
During the analysis stage, feedback from the stakeholder groups would be compared to determine areas of agreement as well as areas of divergence