

Key Insights
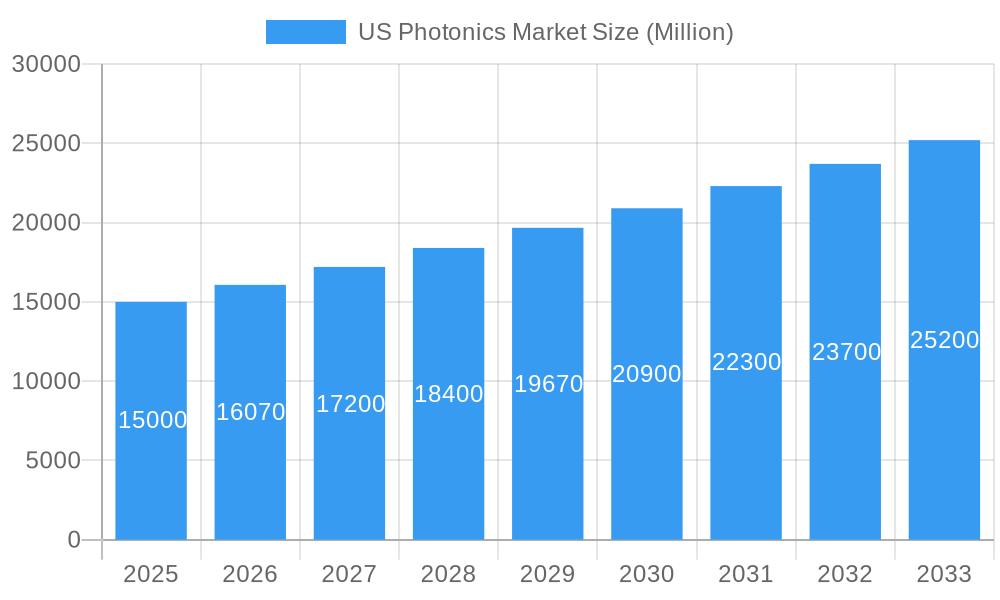
The US photonics market, exhibiting a robust CAGR of 6.86%, is poised for significant growth throughout the forecast period (2025-2033). Driven by increasing demand across diverse applications, including advanced surveying and detection technologies, cutting-edge production processes, high-speed data communication networks, and innovative medical imaging systems, the market is projected to reach substantial value. Key application segments like data communication and medical technology are expected to be major growth catalysts, fueled by the ongoing digital transformation and advancements in healthcare. The integration of photonics into lighting solutions, offering energy efficiency and improved performance, is also contributing to market expansion. While challenges like high initial investment costs and the need for specialized expertise may act as restraints, the overall market trajectory remains positive, spurred by continuous technological innovation and growing government support for R&D in the photonics sector. The competitive landscape is dynamic, with key players like Hamamatsu Photonics, Molex, and Coherent leading the charge through strategic partnerships, mergers and acquisitions, and consistent product development. The regional breakdown within the US shows strong growth across all regions, reflecting the widespread adoption of photonics technologies across various industries and sectors.
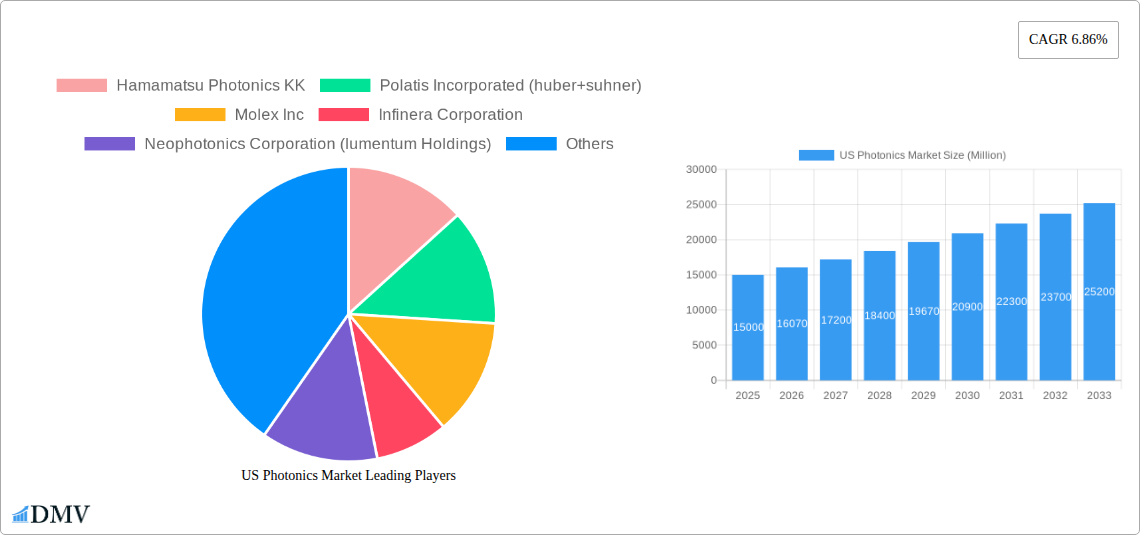
US Photonics Market Market Size (In Billion)
The US market's growth is further propelled by the increasing adoption of advanced sensing and imaging technologies in diverse sectors such as automotive, aerospace, and defense. The development of miniaturized and cost-effective photonic components is also a key driver, facilitating wider adoption across applications. Furthermore, the government's focus on promoting technological advancements and supporting related research initiatives is expected to accelerate market expansion. While competition amongst established players and emerging companies remains intense, the overall market outlook is extremely favorable, offering significant opportunities for growth and innovation in the coming years. This positive outlook anticipates a continued expansion across the various application segments, solidifying the position of photonics as a pivotal technology across multiple industries.
US Photonics Market Company Market Share
US Photonics Market: A Comprehensive Report (2019-2033)
This insightful report provides a detailed analysis of the US Photonics Market, offering a comprehensive overview of its current state, future trajectory, and key players. With a focus on market trends, technological advancements, and competitive dynamics, this study is an essential resource for stakeholders seeking to understand and capitalize on the opportunities within this rapidly evolving sector. The report covers the period from 2019 to 2033, with 2025 serving as the base and estimated year. The market size is projected to reach xx Million by 2033.
US Photonics Market Composition & Trends
The US photonics market is characterized by a moderately concentrated landscape, with a few dominant players and a growing number of niche competitors. Innovation is a key driver, fueled by advancements in laser technology, optical fiber communication, and sensor technology. The regulatory landscape, while generally supportive of technological advancement, faces evolving challenges related to data security and environmental regulations. Substitute products, particularly in certain applications, exert competitive pressure. End-users span diverse sectors, including telecommunications, healthcare, manufacturing, and defense. Mergers and acquisitions (M&A) activity has been notable, with deal values exceeding xx Million in recent years.
- Market Share Distribution: The top five players collectively hold approximately xx% of the market share, with Hamamatsu Photonics KK and IPG Photonics among the leading companies.
- M&A Activity: Significant M&A activity has reshaped the competitive landscape, with deals primarily driven by technology integration and market expansion strategies. The average deal value was estimated at xx Million in the historical period (2019-2024).
- Innovation Catalysts: Government funding for R&D, particularly in areas like quantum photonics and high-speed optical communication, plays a significant role. University research and private sector initiatives are further accelerating innovation.
- Regulatory Landscape: Regulations related to data privacy and the environmental impact of manufacturing processes pose both challenges and opportunities for market participants.
US Photonics Market Industry Evolution
The US photonics market has exhibited robust growth over the historical period (2019-2024), with a Compound Annual Growth Rate (CAGR) of xx%. This growth is projected to continue during the forecast period (2025-2033), albeit at a slightly moderated pace. Technological advancements, particularly in areas like silicon photonics and integrated photonics, are driving market expansion. The increasing demand for high-bandwidth data communication and the adoption of photonics in various applications, such as advanced manufacturing and medical imaging, are crucial drivers. Consumer demand is shifting towards more efficient, cost-effective, and miniaturized photonic solutions.
Leading Regions, Countries, or Segments in US Photonics Market
The Data Communication segment currently dominates the US photonics market, driven by the exponential growth in data traffic and the increasing demand for high-speed internet connectivity. California and Massachusetts are the leading regions, benefiting from strong technological clusters and significant investments in R&D.
- Key Drivers for Data Communication Segment:
- High-speed internet infrastructure development: Massive investment in 5G and beyond 5G networks fuels demand for advanced optical components.
- Cloud computing expansion: Data centers rely heavily on optical communication technologies for data transmission.
- Government initiatives: Funding for broadband infrastructure development supports the growth of the photonics sector.
- Dominance Factors: The concentration of major technology companies, substantial venture capital investment, and a strong talent pool in the region explain the dominance of these areas.
US Photonics Market Product Innovations
Recent innovations include advancements in laser technology, resulting in more compact, efficient, and cost-effective devices. The development of new materials and manufacturing processes has further improved the performance and reliability of photonic components. For instance, the development of integrated photonics circuits has enabled the creation of miniaturized optical systems with improved performance and lower cost. The unique selling propositions often center on increased bandwidth, improved energy efficiency, and smaller form factors.
Propelling Factors for US Photonics Market Growth
Several factors propel the US photonics market's growth. Technological advancements, particularly in areas like laser technology and optical fiber communication, constantly improve existing applications and open new markets. Strong government investment in R&D and favorable economic conditions foster innovation and market expansion. Furthermore, regulatory support for renewable energy technologies and improved healthcare infrastructure create additional demand.
Obstacles in the US Photonics Market Market
The US photonics market faces challenges like supply chain disruptions, potentially leading to increased production costs and delays. The high cost of some advanced photonic technologies can limit their adoption in certain sectors. Competitive pressures from foreign manufacturers and regulatory uncertainties regarding the environmental and health impact of some materials also pose significant obstacles. These factors collectively constrain market growth by limiting adoption rates and increasing manufacturing costs.
Future Opportunities in US Photonics Market
Emerging opportunities exist in areas like quantum photonics, LiDAR for autonomous vehicles, and advanced medical imaging. The development of new materials and manufacturing processes will further expand applications and drive market growth. Increased focus on sustainability and energy efficiency will create demand for more eco-friendly photonic solutions.
Major Players in the US Photonics Market Ecosystem
- Hamamatsu Photonics KK
- Polatis Incorporated (huber+suhner)
- Molex Inc
- Infinera Corporation
- Neophotonics Corporation (lumentum Holdings)
- ams OSRAM AG
- Vescent Photonics LLC
- NEC Corporation
- Alcatel-lucent SA (Nokia Corporation)
- Photonic Systems Inc
- Coherent Inc (Coherent Corp)
- Trumpf Group
- Thorlabs Inc
- Intel Corporation
- IPG Photonics
Key Developments in US Photonics Market Industry
- June 2023: IPG Photonics showcased new technologies for e-mobility manufacturing and introduced its "Cold Oven" laser diode heating technology, revolutionizing thermal processing.
- February 2023: Hamamatsu Photonics developed an optical transceiver with a 1.25 Gbps data transmission speed, demonstrating advancements in fiber-optic communications.
Strategic US Photonics Market Market Forecast
The US photonics market is poised for continued growth, driven by technological innovation and expanding applications across diverse sectors. Emerging technologies and increasing demand for high-bandwidth data communication will fuel market expansion, creating significant opportunities for existing and new market participants. Strategic investments in R&D and proactive adaptation to evolving market trends will be crucial for success in this dynamic sector.
US Photonics Market Segmentation
-
1. Application
- 1.1. Surveying And Detection
- 1.2. Production Technology
- 1.3. Data Communication
- 1.4. Image Capture and Display
- 1.5. Medical Technology
- 1.6. Lighting
- 1.7. Other Applications
US Photonics Market Segmentation By Geography
-
1. North America
- 1.1. United States
- 1.2. Canada
- 1.3. Mexico
-
2. South America
- 2.1. Brazil
- 2.2. Argentina
- 2.3. Rest of South America
-
3. Europe
- 3.1. United Kingdom
- 3.2. Germany
- 3.3. France
- 3.4. Italy
- 3.5. Spain
- 3.6. Russia
- 3.7. Benelux
- 3.8. Nordics
- 3.9. Rest of Europe
-
4. Middle East & Africa
- 4.1. Turkey
- 4.2. Israel
- 4.3. GCC
- 4.4. North Africa
- 4.5. South Africa
- 4.6. Rest of Middle East & Africa
-
5. Asia Pacific
- 5.1. China
- 5.2. India
- 5.3. Japan
- 5.4. South Korea
- 5.5. ASEAN
- 5.6. Oceania
- 5.7. Rest of Asia Pacific
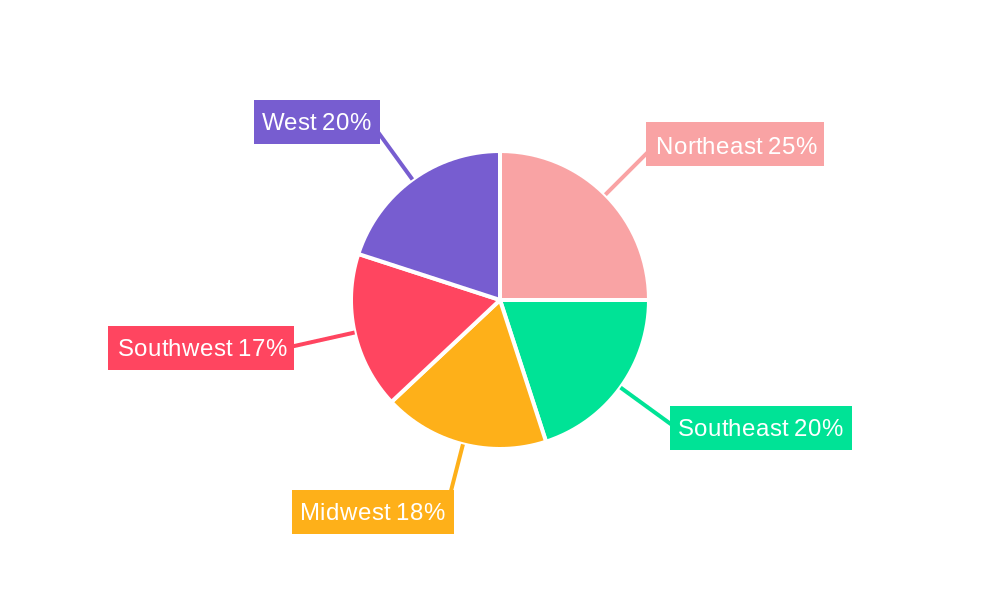
US Photonics Market Regional Market Share
Geographic Coverage of US Photonics Market
US Photonics Market REPORT HIGHLIGHTS
| Aspects | Details |
|---|---|
| Study Period | 2020-2034 |
| Base Year | 2025 |
| Estimated Year | 2026 |
| Forecast Period | 2026-2034 |
| Historical Period | 2020-2025 |
| Growth Rate | CAGR of 4.71% from 2020-2034 |
| Segmentation |
|
Table of Contents
- 1. Introduction
- 1.1. Research Scope
- 1.2. Market Segmentation
- 1.3. Research Methodology
- 1.4. Definitions and Assumptions
- 2. Executive Summary
- 2.1. Introduction
- 3. Market Dynamics
- 3.1. Introduction
- 3.2. Market Drivers
- 3.2.1. Emergence of Silicon-based Photonics Applications; Increasing Focus on High-performance and Eco-Friendly Solutions
- 3.3. Market Restrains
- 3.3.1. High Initial Cost of Photonics - Enabled Devices
- 3.4. Market Trends
- 3.4.1. Emergence of Silicon-based Photonics Applications to Drive the Market
- 4. Market Factor Analysis
- 4.1. Porters Five Forces
- 4.2. Supply/Value Chain
- 4.3. PESTEL analysis
- 4.4. Market Entropy
- 4.5. Patent/Trademark Analysis
- 5. Global US Photonics Market Analysis, Insights and Forecast, 2020-2032
- 5.1. Market Analysis, Insights and Forecast - by Application
- 5.1.1. Surveying And Detection
- 5.1.2. Production Technology
- 5.1.3. Data Communication
- 5.1.4. Image Capture and Display
- 5.1.5. Medical Technology
- 5.1.6. Lighting
- 5.1.7. Other Applications
- 5.2. Market Analysis, Insights and Forecast - by Region
- 5.2.1. North America
- 5.2.2. South America
- 5.2.3. Europe
- 5.2.4. Middle East & Africa
- 5.2.5. Asia Pacific
- 5.1. Market Analysis, Insights and Forecast - by Application
- 6. North America US Photonics Market Analysis, Insights and Forecast, 2020-2032
- 6.1. Market Analysis, Insights and Forecast - by Application
- 6.1.1. Surveying And Detection
- 6.1.2. Production Technology
- 6.1.3. Data Communication
- 6.1.4. Image Capture and Display
- 6.1.5. Medical Technology
- 6.1.6. Lighting
- 6.1.7. Other Applications
- 6.1. Market Analysis, Insights and Forecast - by Application
- 7. South America US Photonics Market Analysis, Insights and Forecast, 2020-2032
- 7.1. Market Analysis, Insights and Forecast - by Application
- 7.1.1. Surveying And Detection
- 7.1.2. Production Technology
- 7.1.3. Data Communication
- 7.1.4. Image Capture and Display
- 7.1.5. Medical Technology
- 7.1.6. Lighting
- 7.1.7. Other Applications
- 7.1. Market Analysis, Insights and Forecast - by Application
- 8. Europe US Photonics Market Analysis, Insights and Forecast, 2020-2032
- 8.1. Market Analysis, Insights and Forecast - by Application
- 8.1.1. Surveying And Detection
- 8.1.2. Production Technology
- 8.1.3. Data Communication
- 8.1.4. Image Capture and Display
- 8.1.5. Medical Technology
- 8.1.6. Lighting
- 8.1.7. Other Applications
- 8.1. Market Analysis, Insights and Forecast - by Application
- 9. Middle East & Africa US Photonics Market Analysis, Insights and Forecast, 2020-2032
- 9.1. Market Analysis, Insights and Forecast - by Application
- 9.1.1. Surveying And Detection
- 9.1.2. Production Technology
- 9.1.3. Data Communication
- 9.1.4. Image Capture and Display
- 9.1.5. Medical Technology
- 9.1.6. Lighting
- 9.1.7. Other Applications
- 9.1. Market Analysis, Insights and Forecast - by Application
- 10. Asia Pacific US Photonics Market Analysis, Insights and Forecast, 2020-2032
- 10.1. Market Analysis, Insights and Forecast - by Application
- 10.1.1. Surveying And Detection
- 10.1.2. Production Technology
- 10.1.3. Data Communication
- 10.1.4. Image Capture and Display
- 10.1.5. Medical Technology
- 10.1.6. Lighting
- 10.1.7. Other Applications
- 10.1. Market Analysis, Insights and Forecast - by Application
- 11. Competitive Analysis
- 11.1. Global Market Share Analysis 2025
- 11.2. Company Profiles
- 11.2.1 Hamamatsu Photonics KK
- 11.2.1.1. Overview
- 11.2.1.2. Products
- 11.2.1.3. SWOT Analysis
- 11.2.1.4. Recent Developments
- 11.2.1.5. Financials (Based on Availability)
- 11.2.2 Polatis Incorporated (huber+suhner)
- 11.2.2.1. Overview
- 11.2.2.2. Products
- 11.2.2.3. SWOT Analysis
- 11.2.2.4. Recent Developments
- 11.2.2.5. Financials (Based on Availability)
- 11.2.3 Molex Inc
- 11.2.3.1. Overview
- 11.2.3.2. Products
- 11.2.3.3. SWOT Analysis
- 11.2.3.4. Recent Developments
- 11.2.3.5. Financials (Based on Availability)
- 11.2.4 Infinera Corporation
- 11.2.4.1. Overview
- 11.2.4.2. Products
- 11.2.4.3. SWOT Analysis
- 11.2.4.4. Recent Developments
- 11.2.4.5. Financials (Based on Availability)
- 11.2.5 Neophotonics Corporation (lumentum Holdings)
- 11.2.5.1. Overview
- 11.2.5.2. Products
- 11.2.5.3. SWOT Analysis
- 11.2.5.4. Recent Developments
- 11.2.5.5. Financials (Based on Availability)
- 11.2.6 ams OSRAM AG
- 11.2.6.1. Overview
- 11.2.6.2. Products
- 11.2.6.3. SWOT Analysis
- 11.2.6.4. Recent Developments
- 11.2.6.5. Financials (Based on Availability)
- 11.2.7 Vescent Photonics LLC
- 11.2.7.1. Overview
- 11.2.7.2. Products
- 11.2.7.3. SWOT Analysis
- 11.2.7.4. Recent Developments
- 11.2.7.5. Financials (Based on Availability)
- 11.2.8 NEC Corporation
- 11.2.8.1. Overview
- 11.2.8.2. Products
- 11.2.8.3. SWOT Analysis
- 11.2.8.4. Recent Developments
- 11.2.8.5. Financials (Based on Availability)
- 11.2.9 Alcatel-lucent SA (Nokia Corporation)*List Not Exhaustive
- 11.2.9.1. Overview
- 11.2.9.2. Products
- 11.2.9.3. SWOT Analysis
- 11.2.9.4. Recent Developments
- 11.2.9.5. Financials (Based on Availability)
- 11.2.10 Photonic Systems Inc
- 11.2.10.1. Overview
- 11.2.10.2. Products
- 11.2.10.3. SWOT Analysis
- 11.2.10.4. Recent Developments
- 11.2.10.5. Financials (Based on Availability)
- 11.2.11 Coherent Inc (Coherent Corp )
- 11.2.11.1. Overview
- 11.2.11.2. Products
- 11.2.11.3. SWOT Analysis
- 11.2.11.4. Recent Developments
- 11.2.11.5. Financials (Based on Availability)
- 11.2.12 Trumpf Group
- 11.2.12.1. Overview
- 11.2.12.2. Products
- 11.2.12.3. SWOT Analysis
- 11.2.12.4. Recent Developments
- 11.2.12.5. Financials (Based on Availability)
- 11.2.13 Thorlabs Inc
- 11.2.13.1. Overview
- 11.2.13.2. Products
- 11.2.13.3. SWOT Analysis
- 11.2.13.4. Recent Developments
- 11.2.13.5. Financials (Based on Availability)
- 11.2.14 Intel Corporation
- 11.2.14.1. Overview
- 11.2.14.2. Products
- 11.2.14.3. SWOT Analysis
- 11.2.14.4. Recent Developments
- 11.2.14.5. Financials (Based on Availability)
- 11.2.15 IPG Photonics
- 11.2.15.1. Overview
- 11.2.15.2. Products
- 11.2.15.3. SWOT Analysis
- 11.2.15.4. Recent Developments
- 11.2.15.5. Financials (Based on Availability)
- 11.2.1 Hamamatsu Photonics KK
List of Figures
- Figure 1: Global US Photonics Market Revenue Breakdown (undefined, %) by Region 2025 & 2033
- Figure 2: North America US Photonics Market Revenue (undefined), by Application 2025 & 2033
- Figure 3: North America US Photonics Market Revenue Share (%), by Application 2025 & 2033
- Figure 4: North America US Photonics Market Revenue (undefined), by Country 2025 & 2033
- Figure 5: North America US Photonics Market Revenue Share (%), by Country 2025 & 2033
- Figure 6: South America US Photonics Market Revenue (undefined), by Application 2025 & 2033
- Figure 7: South America US Photonics Market Revenue Share (%), by Application 2025 & 2033
- Figure 8: South America US Photonics Market Revenue (undefined), by Country 2025 & 2033
- Figure 9: South America US Photonics Market Revenue Share (%), by Country 2025 & 2033
- Figure 10: Europe US Photonics Market Revenue (undefined), by Application 2025 & 2033
- Figure 11: Europe US Photonics Market Revenue Share (%), by Application 2025 & 2033
- Figure 12: Europe US Photonics Market Revenue (undefined), by Country 2025 & 2033
- Figure 13: Europe US Photonics Market Revenue Share (%), by Country 2025 & 2033
- Figure 14: Middle East & Africa US Photonics Market Revenue (undefined), by Application 2025 & 2033
- Figure 15: Middle East & Africa US Photonics Market Revenue Share (%), by Application 2025 & 2033
- Figure 16: Middle East & Africa US Photonics Market Revenue (undefined), by Country 2025 & 2033
- Figure 17: Middle East & Africa US Photonics Market Revenue Share (%), by Country 2025 & 2033
- Figure 18: Asia Pacific US Photonics Market Revenue (undefined), by Application 2025 & 2033
- Figure 19: Asia Pacific US Photonics Market Revenue Share (%), by Application 2025 & 2033
- Figure 20: Asia Pacific US Photonics Market Revenue (undefined), by Country 2025 & 2033
- Figure 21: Asia Pacific US Photonics Market Revenue Share (%), by Country 2025 & 2033
List of Tables
- Table 1: Global US Photonics Market Revenue undefined Forecast, by Application 2020 & 2033
- Table 2: Global US Photonics Market Revenue undefined Forecast, by Region 2020 & 2033
- Table 3: Global US Photonics Market Revenue undefined Forecast, by Application 2020 & 2033
- Table 4: Global US Photonics Market Revenue undefined Forecast, by Country 2020 & 2033
- Table 5: United States US Photonics Market Revenue (undefined) Forecast, by Application 2020 & 2033
- Table 6: Canada US Photonics Market Revenue (undefined) Forecast, by Application 2020 & 2033
- Table 7: Mexico US Photonics Market Revenue (undefined) Forecast, by Application 2020 & 2033
- Table 8: Global US Photonics Market Revenue undefined Forecast, by Application 2020 & 2033
- Table 9: Global US Photonics Market Revenue undefined Forecast, by Country 2020 & 2033
- Table 10: Brazil US Photonics Market Revenue (undefined) Forecast, by Application 2020 & 2033
- Table 11: Argentina US Photonics Market Revenue (undefined) Forecast, by Application 2020 & 2033
- Table 12: Rest of South America US Photonics Market Revenue (undefined) Forecast, by Application 2020 & 2033
- Table 13: Global US Photonics Market Revenue undefined Forecast, by Application 2020 & 2033
- Table 14: Global US Photonics Market Revenue undefined Forecast, by Country 2020 & 2033
- Table 15: United Kingdom US Photonics Market Revenue (undefined) Forecast, by Application 2020 & 2033
- Table 16: Germany US Photonics Market Revenue (undefined) Forecast, by Application 2020 & 2033
- Table 17: France US Photonics Market Revenue (undefined) Forecast, by Application 2020 & 2033
- Table 18: Italy US Photonics Market Revenue (undefined) Forecast, by Application 2020 & 2033
- Table 19: Spain US Photonics Market Revenue (undefined) Forecast, by Application 2020 & 2033
- Table 20: Russia US Photonics Market Revenue (undefined) Forecast, by Application 2020 & 2033
- Table 21: Benelux US Photonics Market Revenue (undefined) Forecast, by Application 2020 & 2033
- Table 22: Nordics US Photonics Market Revenue (undefined) Forecast, by Application 2020 & 2033
- Table 23: Rest of Europe US Photonics Market Revenue (undefined) Forecast, by Application 2020 & 2033
- Table 24: Global US Photonics Market Revenue undefined Forecast, by Application 2020 & 2033
- Table 25: Global US Photonics Market Revenue undefined Forecast, by Country 2020 & 2033
- Table 26: Turkey US Photonics Market Revenue (undefined) Forecast, by Application 2020 & 2033
- Table 27: Israel US Photonics Market Revenue (undefined) Forecast, by Application 2020 & 2033
- Table 28: GCC US Photonics Market Revenue (undefined) Forecast, by Application 2020 & 2033
- Table 29: North Africa US Photonics Market Revenue (undefined) Forecast, by Application 2020 & 2033
- Table 30: South Africa US Photonics Market Revenue (undefined) Forecast, by Application 2020 & 2033
- Table 31: Rest of Middle East & Africa US Photonics Market Revenue (undefined) Forecast, by Application 2020 & 2033
- Table 32: Global US Photonics Market Revenue undefined Forecast, by Application 2020 & 2033
- Table 33: Global US Photonics Market Revenue undefined Forecast, by Country 2020 & 2033
- Table 34: China US Photonics Market Revenue (undefined) Forecast, by Application 2020 & 2033
- Table 35: India US Photonics Market Revenue (undefined) Forecast, by Application 2020 & 2033
- Table 36: Japan US Photonics Market Revenue (undefined) Forecast, by Application 2020 & 2033
- Table 37: South Korea US Photonics Market Revenue (undefined) Forecast, by Application 2020 & 2033
- Table 38: ASEAN US Photonics Market Revenue (undefined) Forecast, by Application 2020 & 2033
- Table 39: Oceania US Photonics Market Revenue (undefined) Forecast, by Application 2020 & 2033
- Table 40: Rest of Asia Pacific US Photonics Market Revenue (undefined) Forecast, by Application 2020 & 2033
Frequently Asked Questions
1. What is the projected Compound Annual Growth Rate (CAGR) of the US Photonics Market?
The projected CAGR is approximately 4.71%.
2. Which companies are prominent players in the US Photonics Market?
Key companies in the market include Hamamatsu Photonics KK, Polatis Incorporated (huber+suhner), Molex Inc, Infinera Corporation, Neophotonics Corporation (lumentum Holdings), ams OSRAM AG, Vescent Photonics LLC, NEC Corporation, Alcatel-lucent SA (Nokia Corporation)*List Not Exhaustive, Photonic Systems Inc, Coherent Inc (Coherent Corp ), Trumpf Group, Thorlabs Inc, Intel Corporation, IPG Photonics.
3. What are the main segments of the US Photonics Market?
The market segments include Application.
4. Can you provide details about the market size?
The market size is estimated to be USD XXX N/A as of 2022.
5. What are some drivers contributing to market growth?
Emergence of Silicon-based Photonics Applications; Increasing Focus on High-performance and Eco-Friendly Solutions.
6. What are the notable trends driving market growth?
Emergence of Silicon-based Photonics Applications to Drive the Market.
7. Are there any restraints impacting market growth?
High Initial Cost of Photonics - Enabled Devices.
8. Can you provide examples of recent developments in the market?
June 2023: IPG Photonics, a leading fiber laser solutions provider, showcased its latest technologies and solutions for e-mobility manufacturing, materials processing, and specialized applications. IPG also introduced a breakthrough in thermal processing with its "Cold Oven" laser diode heating. This technology replaces traditional infrared bulbs and convection drying furnaces, delivering faster heating and drying processes with higher energy efficiency.
9. What pricing options are available for accessing the report?
Pricing options include single-user, multi-user, and enterprise licenses priced at USD 3800, USD 4500, and USD 5800 respectively.
10. Is the market size provided in terms of value or volume?
The market size is provided in terms of value, measured in N/A.
11. Are there any specific market keywords associated with the report?
Yes, the market keyword associated with the report is "US Photonics Market," which aids in identifying and referencing the specific market segment covered.
12. How do I determine which pricing option suits my needs best?
The pricing options vary based on user requirements and access needs. Individual users may opt for single-user licenses, while businesses requiring broader access may choose multi-user or enterprise licenses for cost-effective access to the report.
13. Are there any additional resources or data provided in the US Photonics Market report?
While the report offers comprehensive insights, it's advisable to review the specific contents or supplementary materials provided to ascertain if additional resources or data are available.
14. How can I stay updated on further developments or reports in the US Photonics Market?
To stay informed about further developments, trends, and reports in the US Photonics Market, consider subscribing to industry newsletters, following relevant companies and organizations, or regularly checking reputable industry news sources and publications.
Methodology
Step 1 - Identification of Relevant Samples Size from Population Database


Step 2 - Approaches for Defining Global Market Size (Value, Volume* & Price*)

Note*: In applicable scenarios
Step 3 - Data Sources
Primary Research
- Web Analytics
- Survey Reports
- Research Institute
- Latest Research Reports
- Opinion Leaders
Secondary Research
- Annual Reports
- White Paper
- Latest Press Release
- Industry Association
- Paid Database
- Investor Presentations

Step 4 - Data Triangulation
Involves using different sources of information in order to increase the validity of a study
These sources are likely to be stakeholders in a program - participants, other researchers, program staff, other community members, and so on.
Then we put all data in single framework & apply various statistical tools to find out the dynamic on the market.
During the analysis stage, feedback from the stakeholder groups would be compared to determine areas of agreement as well as areas of divergence