

Key Insights
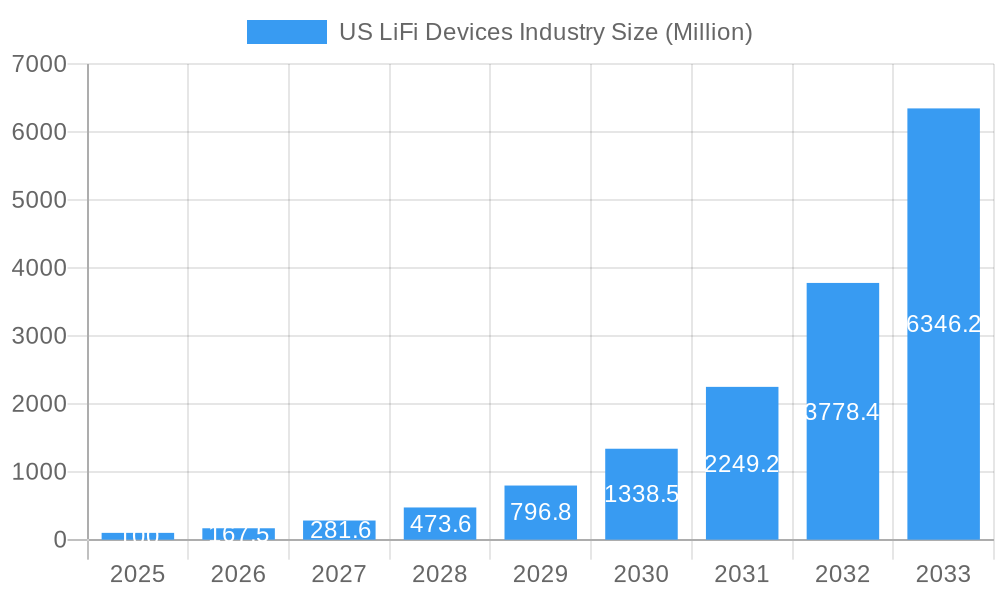
The U.S. LiFi devices market is poised for substantial expansion, driven by increasing demand for high-speed, secure, and energy-efficient wireless communication. With a projected Compound Annual Growth Rate (CAGR) of 48.34%, the market is expected to reach 990.94 million by 2025. This rapid growth is fueled by the burgeoning adoption of LiFi technology across diverse sectors, including corporate offices, transportation, retail, and hospitality, signaling its potential to augment existing Wi-Fi infrastructure. Major metropolitan area deployments are accelerating national adoption, supported by technological advancements in LED lighting and microcontrollers that enhance performance and reduce costs. While challenges such as line-of-sight transmission and range limitations persist, the market trajectory indicates significant potential for growth throughout the forecast period (2025-2033). Key players are driving innovation and market penetration.
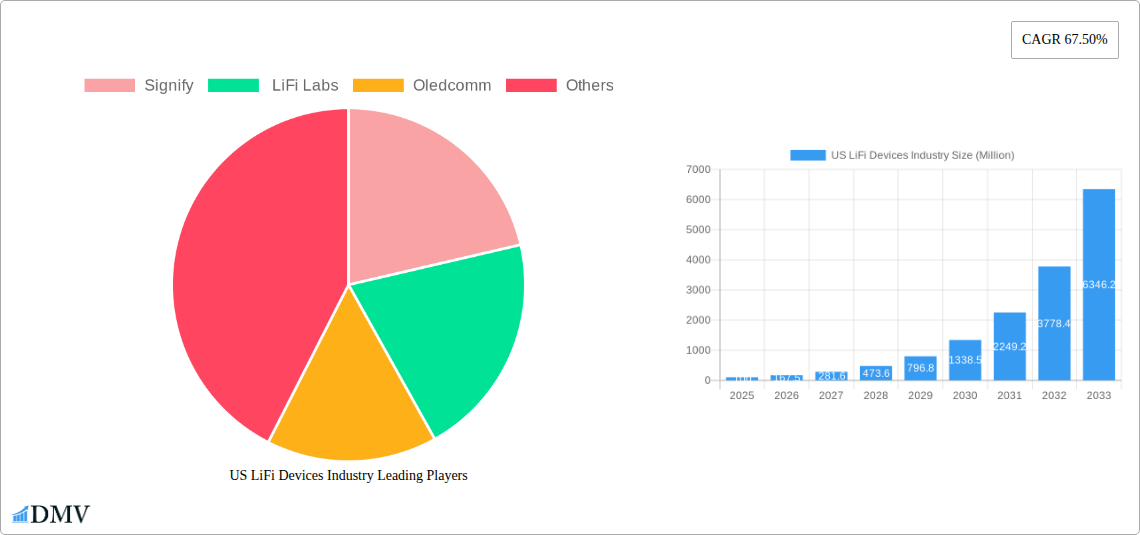
US LiFi Devices Industry Market Size (In Million)
Market segmentation highlights key growth areas. LED-based LiFi devices currently lead due to integration with existing lighting, while photodiodes and microcontrollers are anticipated to see substantial growth driven by miniaturization and efficiency improvements. Regional analysis indicates that metropolitan areas will act as early adopters, experiencing faster growth rates. Future market expansion will depend on addressing current limitations, investing in infrastructure, and enhancing awareness of LiFi's capabilities. The market is set to become an increasingly vital component of the U.S. wireless communication landscape.
US LiFi Devices Industry Company Market Share
US LiFi Devices Industry Market Report: 2019-2033
This comprehensive report provides a detailed analysis of the US LiFi devices industry, covering market size, trends, key players, and future prospects from 2019 to 2033. The study period spans 2019-2033, with a base year of 2025 and a forecast period of 2025-2033. The historical period analyzed is 2019-2024. This report is essential for stakeholders seeking to understand the current landscape and future potential of this rapidly evolving technology. The US LiFi devices market is projected to reach xx Million by 2033, demonstrating substantial growth opportunities.
US LiFi Devices Industry Market Composition & Trends
The US LiFi devices market is characterized by a moderately concentrated landscape, with key players like Signify, LiFi Labs, and Oledcomm holding significant market share. However, the entry of new players and technological advancements are fostering increased competition. Market share distribution in 2025 is estimated as follows: Signify (40%), LiFi Labs (25%), Oledcomm (15%), Others (20%). Innovation is a primary driver, fueled by advancements in LED technology, photodiodes, and microcontrollers. Regulatory frameworks, while still developing, are increasingly supportive of LiFi adoption, particularly in areas emphasizing data security and bandwidth efficiency. Substitute technologies, primarily Wi-Fi and 5G, present competitive pressure, though LiFi’s unique advantages in secure, high-bandwidth environments are creating niche markets. End-user profiles vary widely, including corporate offices, retail settings, and transportation hubs. M&A activity remains relatively low; however, total M&A deal value during the historical period (2019-2024) is estimated at xx Million.
- Market Concentration: Moderately Concentrated
- Innovation Catalysts: Advancements in LED, photodiodes, microcontrollers.
- Regulatory Landscape: Developing, but supportive.
- Substitute Products: Wi-Fi, 5G
- End-User Profiles: Corporate offices, retail, transportation.
- M&A Activity: Low, with xx Million in total deal value (2019-2024).
US LiFi Devices Industry Evolution
The US LiFi devices market has experienced significant growth during the historical period (2019-2024), driven primarily by increasing demand for high-speed, secure wireless communication in various sectors. The market witnessed a CAGR of xx% from 2019 to 2024. This growth is fueled by advancements in LED technology, enabling higher data transmission rates and improved efficiency. Furthermore, the rising adoption of LiFi in sectors such as healthcare, manufacturing, and transportation is contributing to market expansion. Consumer demand is also increasing due to the growing awareness of LiFi's benefits, such as improved security, reduced interference, and energy efficiency. Technological advancements, including the development of more efficient photodiodes and microcontrollers, are further driving market growth. The forecast period (2025-2033) anticipates a continued rise in market adoption, with an estimated CAGR of xx%. This growth will be driven by new applications, including integration with smart homes and industrial IoT. Increased regulatory support and investments in research and development will further propel market expansion. The market is expected to reach xx Million by 2033.
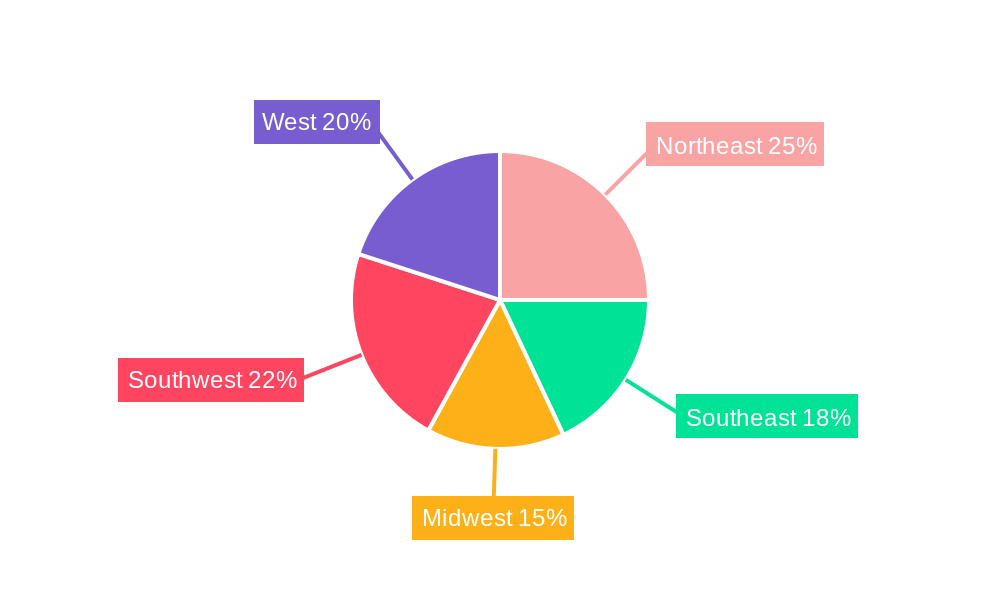
Leading Regions, Countries, or Segments in US LiFi Devices Industry
Within the US, key regions driving LiFi adoption include New York, Los Angeles, Chicago, Houston, and Philadelphia. These cities boast robust technological infrastructure and high concentrations of businesses adopting advanced technologies. Washington D.C.’s high security needs also contribute to LiFi adoption. In terms of usage segments, corporate offices lead the way, driven by the need for secure and high-bandwidth communication, followed by retail stores/supermarkets/hypermarkets and hotels, aiming to enhance customer experience and operational efficiency. The LED segment dominates the LiFi device market due to its maturity, cost-effectiveness, and compatibility with existing infrastructure.
Key Drivers (Investment Trends & Regulatory Support):
- High concentration of tech companies and early adopters in major cities.
- Growing demand for secure and high-bandwidth communication in corporate offices.
- Increasing focus on energy efficiency and reduced environmental impact.
- Government initiatives promoting the adoption of advanced wireless technologies.
Dominance Factors:
- Existing infrastructure and high technological readiness in major cities.
- High security requirements in government and corporate sectors.
- Cost-effectiveness and energy efficiency of LED-based LiFi systems.
US LiFi Devices Industry Product Innovations
Recent innovations in LiFi devices focus on enhancing data transmission rates, improving energy efficiency, and expanding application possibilities. New photodiodes offer improved light sensitivity and wider spectral range, leading to faster data speeds and broader coverage. Advanced microcontrollers are being developed to handle complex data processing and communication protocols. These innovations, combined with the integration of LiFi with other technologies, such as IoT and smart lighting systems, are creating new opportunities for growth and adoption.
Propelling Factors for US LiFi Devices Industry Growth
Technological advancements, such as improved LED technology and more efficient photodiodes, are significantly propelling market growth. The increasing demand for high-speed, secure, and energy-efficient wireless communication in various sectors fuels further expansion. Government initiatives and regulatory support promoting the adoption of LiFi technology contribute to a favorable environment for market expansion. Economic incentives, such as tax breaks and subsidies, encourage companies to invest in LiFi infrastructure.
Obstacles in the US LiFi Devices Industry Market
High initial investment costs for LiFi infrastructure can hinder widespread adoption. Concerns about potential health effects related to exposure to light sources also present a barrier to market growth. Supply chain disruptions, particularly impacting the availability of essential components, can cause production delays and increase costs. Competition from established wireless technologies like Wi-Fi and 5G also presents a challenge. The lack of standardized protocols for LiFi can also hamper seamless integration.
Future Opportunities in US LiFi Devices Industry
Future opportunities lie in expanding LiFi applications to new sectors like healthcare, transportation, and industrial IoT. Technological advancements, such as the development of more efficient and cost-effective components, are expected to drive growth. Growing consumer awareness of the benefits of LiFi, such as improved security and energy efficiency, will also contribute to market expansion. The integration of LiFi with other technologies, such as smart lighting systems and 5G networks, will further broaden its applications. Expansion into new geographical areas, particularly in developing countries, presents additional growth potential.
Major Players in the US LiFi Devices Industry Ecosystem
- Signify
- LiFi Labs
- Oledcomm
Key Developments in US LiFi Devices Industry Industry
- September 2023: Getac announced the embedding of LiFi technology into rugged devices in collaboration with Signify's Trulifi technology.
- April 2023: Oledcomm demonstrated new LiFi applications in space, unveiling LIFIMAX2G with 2Gbps connection speed.
Strategic US LiFi Devices Industry Market Forecast
The US LiFi devices market is poised for significant growth, driven by technological advancements, increasing demand for secure and high-bandwidth communication, and supportive regulatory frameworks. New applications in various sectors, coupled with continuous product innovation and cost reduction, will further accelerate market expansion. The market is expected to witness strong growth during the forecast period (2025-2033), reaching xx Million by 2033, driven by the adoption of LiFi in smart homes, industrial IoT, and other high-growth applications. The expanding ecosystem of key players will further boost market competition and innovation.
US LiFi Devices Industry Segmentation
-
1. Cities
- 1.1. New York
- 1.2. Los Angeles
- 1.3. Chicago
- 1.4. Houston
- 1.5. Philadelphia
- 1.6. Washington
- 1.7. Other Cities
-
2. Estimated Usage
- 2.1. House
- 2.2. Corporate Office
- 2.3. Railways and Airlines
- 2.4. Airways
- 2.5. Retail Stores/Supermarkets/Hypermarkets
- 2.6. Hotels
- 2.7. Others
-
3. Types
- 3.1. LED
- 3.2. Photodiodes
- 3.3. Microcontrollers
- 3.4. Other Types
US LiFi Devices Industry Segmentation By Geography
-
1. North America
- 1.1. United States
- 1.2. Canada
- 1.3. Mexico
-
2. South America
- 2.1. Brazil
- 2.2. Argentina
- 2.3. Rest of South America
-
3. Europe
- 3.1. United Kingdom
- 3.2. Germany
- 3.3. France
- 3.4. Italy
- 3.5. Spain
- 3.6. Russia
- 3.7. Benelux
- 3.8. Nordics
- 3.9. Rest of Europe
-
4. Middle East & Africa
- 4.1. Turkey
- 4.2. Israel
- 4.3. GCC
- 4.4. North Africa
- 4.5. South Africa
- 4.6. Rest of Middle East & Africa
-
5. Asia Pacific
- 5.1. China
- 5.2. India
- 5.3. Japan
- 5.4. South Korea
- 5.5. ASEAN
- 5.6. Oceania
- 5.7. Rest of Asia Pacific
US LiFi Devices Industry Regional Market Share
Geographic Coverage of US LiFi Devices Industry
US LiFi Devices Industry REPORT HIGHLIGHTS
| Aspects | Details |
|---|---|
| Study Period | 2020-2034 |
| Base Year | 2025 |
| Estimated Year | 2026 |
| Forecast Period | 2026-2034 |
| Historical Period | 2020-2025 |
| Growth Rate | CAGR of 48.34% from 2020-2034 |
| Segmentation |
|
Table of Contents
- 1. Introduction
- 1.1. Research Scope
- 1.2. Market Segmentation
- 1.3. Research Objective
- 1.4. Definitions and Assumptions
- 2. Executive Summary
- 2.1. Market Snapshot
- 3. Market Dynamics
- 3.1. Market Drivers
- 3.2. Market Restrains
- 3.3. Market Trends
- 3.4. Market Opportunities
- 4. Market Factor Analysis
- 4.1. Porters Five Forces
- 4.1.1. Bargaining Power of Suppliers
- 4.1.2. Bargaining Power of Buyers
- 4.1.3. Threat of New Entrants
- 4.1.4. Threat of Substitutes
- 4.1.5. Competitive Rivalry
- 4.2. PESTEL analysis
- 4.3. BCG Analysis
- 4.3.1. Stars (High Growth, High Market Share)
- 4.3.2. Cash Cows (Low Growth, High Market Share)
- 4.3.3. Question Mark (High Growth, Low Market Share)
- 4.3.4. Dogs (Low Growth, Low Market Share)
- 4.4. Ansoff Matrix Analysis
- 4.5. Supply Chain Analysis
- 4.6. Regulatory Landscape
- 4.7. Current Market Potential and Opportunity Assessment (TAM–SAM–SOM Framework)
- 4.8. DMV Analyst Note
- 4.1. Porters Five Forces
- 5. Market Analysis, Insights and Forecast 2021-2033
- 5.1. Market Analysis, Insights and Forecast - by Cities
- 5.1.1. New York
- 5.1.2. Los Angeles
- 5.1.3. Chicago
- 5.1.4. Houston
- 5.1.5. Philadelphia
- 5.1.6. Washington
- 5.1.7. Other Cities
- 5.2. Market Analysis, Insights and Forecast - by Estimated Usage
- 5.2.1. House
- 5.2.2. Corporate Office
- 5.2.3. Railways and Airlines
- 5.2.4. Airways
- 5.2.5. Retail Stores/Supermarkets/Hypermarkets
- 5.2.6. Hotels
- 5.2.7. Others
- 5.3. Market Analysis, Insights and Forecast - by Types
- 5.3.1. LED
- 5.3.2. Photodiodes
- 5.3.3. Microcontrollers
- 5.3.4. Other Types
- 5.4. Market Analysis, Insights and Forecast - by Region
- 5.4.1. North America
- 5.4.2. South America
- 5.4.3. Europe
- 5.4.4. Middle East & Africa
- 5.4.5. Asia Pacific
- 5.1. Market Analysis, Insights and Forecast - by Cities
- 6. Global US LiFi Devices Industry Analysis, Insights and Forecast, 2021-2033
- 6.1. Market Analysis, Insights and Forecast - by Cities
- 6.1.1. New York
- 6.1.2. Los Angeles
- 6.1.3. Chicago
- 6.1.4. Houston
- 6.1.5. Philadelphia
- 6.1.6. Washington
- 6.1.7. Other Cities
- 6.2. Market Analysis, Insights and Forecast - by Estimated Usage
- 6.2.1. House
- 6.2.2. Corporate Office
- 6.2.3. Railways and Airlines
- 6.2.4. Airways
- 6.2.5. Retail Stores/Supermarkets/Hypermarkets
- 6.2.6. Hotels
- 6.2.7. Others
- 6.3. Market Analysis, Insights and Forecast - by Types
- 6.3.1. LED
- 6.3.2. Photodiodes
- 6.3.3. Microcontrollers
- 6.3.4. Other Types
- 6.1. Market Analysis, Insights and Forecast - by Cities
- 7. North America US LiFi Devices Industry Analysis, Insights and Forecast, 2020-2032
- 7.1. Market Analysis, Insights and Forecast - by Cities
- 7.1.1. New York
- 7.1.2. Los Angeles
- 7.1.3. Chicago
- 7.1.4. Houston
- 7.1.5. Philadelphia
- 7.1.6. Washington
- 7.1.7. Other Cities
- 7.2. Market Analysis, Insights and Forecast - by Estimated Usage
- 7.2.1. House
- 7.2.2. Corporate Office
- 7.2.3. Railways and Airlines
- 7.2.4. Airways
- 7.2.5. Retail Stores/Supermarkets/Hypermarkets
- 7.2.6. Hotels
- 7.2.7. Others
- 7.3. Market Analysis, Insights and Forecast - by Types
- 7.3.1. LED
- 7.3.2. Photodiodes
- 7.3.3. Microcontrollers
- 7.3.4. Other Types
- 7.1. Market Analysis, Insights and Forecast - by Cities
- 8. South America US LiFi Devices Industry Analysis, Insights and Forecast, 2020-2032
- 8.1. Market Analysis, Insights and Forecast - by Cities
- 8.1.1. New York
- 8.1.2. Los Angeles
- 8.1.3. Chicago
- 8.1.4. Houston
- 8.1.5. Philadelphia
- 8.1.6. Washington
- 8.1.7. Other Cities
- 8.2. Market Analysis, Insights and Forecast - by Estimated Usage
- 8.2.1. House
- 8.2.2. Corporate Office
- 8.2.3. Railways and Airlines
- 8.2.4. Airways
- 8.2.5. Retail Stores/Supermarkets/Hypermarkets
- 8.2.6. Hotels
- 8.2.7. Others
- 8.3. Market Analysis, Insights and Forecast - by Types
- 8.3.1. LED
- 8.3.2. Photodiodes
- 8.3.3. Microcontrollers
- 8.3.4. Other Types
- 8.1. Market Analysis, Insights and Forecast - by Cities
- 9. Europe US LiFi Devices Industry Analysis, Insights and Forecast, 2020-2032
- 9.1. Market Analysis, Insights and Forecast - by Cities
- 9.1.1. New York
- 9.1.2. Los Angeles
- 9.1.3. Chicago
- 9.1.4. Houston
- 9.1.5. Philadelphia
- 9.1.6. Washington
- 9.1.7. Other Cities
- 9.2. Market Analysis, Insights and Forecast - by Estimated Usage
- 9.2.1. House
- 9.2.2. Corporate Office
- 9.2.3. Railways and Airlines
- 9.2.4. Airways
- 9.2.5. Retail Stores/Supermarkets/Hypermarkets
- 9.2.6. Hotels
- 9.2.7. Others
- 9.3. Market Analysis, Insights and Forecast - by Types
- 9.3.1. LED
- 9.3.2. Photodiodes
- 9.3.3. Microcontrollers
- 9.3.4. Other Types
- 9.1. Market Analysis, Insights and Forecast - by Cities
- 10. Middle East & Africa US LiFi Devices Industry Analysis, Insights and Forecast, 2020-2032
- 10.1. Market Analysis, Insights and Forecast - by Cities
- 10.1.1. New York
- 10.1.2. Los Angeles
- 10.1.3. Chicago
- 10.1.4. Houston
- 10.1.5. Philadelphia
- 10.1.6. Washington
- 10.1.7. Other Cities
- 10.2. Market Analysis, Insights and Forecast - by Estimated Usage
- 10.2.1. House
- 10.2.2. Corporate Office
- 10.2.3. Railways and Airlines
- 10.2.4. Airways
- 10.2.5. Retail Stores/Supermarkets/Hypermarkets
- 10.2.6. Hotels
- 10.2.7. Others
- 10.3. Market Analysis, Insights and Forecast - by Types
- 10.3.1. LED
- 10.3.2. Photodiodes
- 10.3.3. Microcontrollers
- 10.3.4. Other Types
- 10.1. Market Analysis, Insights and Forecast - by Cities
- 11. Asia Pacific US LiFi Devices Industry Analysis, Insights and Forecast, 2020-2032
- 11.1. Market Analysis, Insights and Forecast - by Cities
- 11.1.1. New York
- 11.1.2. Los Angeles
- 11.1.3. Chicago
- 11.1.4. Houston
- 11.1.5. Philadelphia
- 11.1.6. Washington
- 11.1.7. Other Cities
- 11.2. Market Analysis, Insights and Forecast - by Estimated Usage
- 11.2.1. House
- 11.2.2. Corporate Office
- 11.2.3. Railways and Airlines
- 11.2.4. Airways
- 11.2.5. Retail Stores/Supermarkets/Hypermarkets
- 11.2.6. Hotels
- 11.2.7. Others
- 11.3. Market Analysis, Insights and Forecast - by Types
- 11.3.1. LED
- 11.3.2. Photodiodes
- 11.3.3. Microcontrollers
- 11.3.4. Other Types
- 11.1. Market Analysis, Insights and Forecast - by Cities
- 12. Competitive Analysis
- 12.1. Company Profiles
- 12.1.1 Signify
- 12.1.1.1. Company Overview
- 12.1.1.2. Products
- 12.1.1.3. Company Financials
- 12.1.1.4. SWOT Analysis
- 12.1.2 LiFi Labs
- 12.1.2.1. Company Overview
- 12.1.2.2. Products
- 12.1.2.3. Company Financials
- 12.1.2.4. SWOT Analysis
- 12.1.3 Oledcomm
- 12.1.3.1. Company Overview
- 12.1.3.2. Products
- 12.1.3.3. Company Financials
- 12.1.3.4. SWOT Analysis
- 12.1.1 Signify
- 12.2. Market Entropy
- 12.2.1 Company's Key Areas Served
- 12.2.2 Recent Developments
- 12.3. Company Market Share Analysis 2025
- 12.3.1 Top 5 Companies Market Share Analysis
- 12.3.2 Top 3 Companies Market Share Analysis
- 12.4. List of Potential Customers
- 13. Research Methodology
List of Figures
- Figure 1: Global US LiFi Devices Industry Revenue Breakdown (million, %) by Region 2025 & 2033
- Figure 2: Global US LiFi Devices Industry Volume Breakdown (K Units, %) by Region 2025 & 2033
- Figure 3: North America US LiFi Devices Industry Revenue (million), by Cities 2025 & 2033
- Figure 4: North America US LiFi Devices Industry Volume (K Units), by Cities 2025 & 2033
- Figure 5: North America US LiFi Devices Industry Revenue Share (%), by Cities 2025 & 2033
- Figure 6: North America US LiFi Devices Industry Volume Share (%), by Cities 2025 & 2033
- Figure 7: North America US LiFi Devices Industry Revenue (million), by Estimated Usage 2025 & 2033
- Figure 8: North America US LiFi Devices Industry Volume (K Units), by Estimated Usage 2025 & 2033
- Figure 9: North America US LiFi Devices Industry Revenue Share (%), by Estimated Usage 2025 & 2033
- Figure 10: North America US LiFi Devices Industry Volume Share (%), by Estimated Usage 2025 & 2033
- Figure 11: North America US LiFi Devices Industry Revenue (million), by Types 2025 & 2033
- Figure 12: North America US LiFi Devices Industry Volume (K Units), by Types 2025 & 2033
- Figure 13: North America US LiFi Devices Industry Revenue Share (%), by Types 2025 & 2033
- Figure 14: North America US LiFi Devices Industry Volume Share (%), by Types 2025 & 2033
- Figure 15: North America US LiFi Devices Industry Revenue (million), by Country 2025 & 2033
- Figure 16: North America US LiFi Devices Industry Volume (K Units), by Country 2025 & 2033
- Figure 17: North America US LiFi Devices Industry Revenue Share (%), by Country 2025 & 2033
- Figure 18: North America US LiFi Devices Industry Volume Share (%), by Country 2025 & 2033
- Figure 19: South America US LiFi Devices Industry Revenue (million), by Cities 2025 & 2033
- Figure 20: South America US LiFi Devices Industry Volume (K Units), by Cities 2025 & 2033
- Figure 21: South America US LiFi Devices Industry Revenue Share (%), by Cities 2025 & 2033
- Figure 22: South America US LiFi Devices Industry Volume Share (%), by Cities 2025 & 2033
- Figure 23: South America US LiFi Devices Industry Revenue (million), by Estimated Usage 2025 & 2033
- Figure 24: South America US LiFi Devices Industry Volume (K Units), by Estimated Usage 2025 & 2033
- Figure 25: South America US LiFi Devices Industry Revenue Share (%), by Estimated Usage 2025 & 2033
- Figure 26: South America US LiFi Devices Industry Volume Share (%), by Estimated Usage 2025 & 2033
- Figure 27: South America US LiFi Devices Industry Revenue (million), by Types 2025 & 2033
- Figure 28: South America US LiFi Devices Industry Volume (K Units), by Types 2025 & 2033
- Figure 29: South America US LiFi Devices Industry Revenue Share (%), by Types 2025 & 2033
- Figure 30: South America US LiFi Devices Industry Volume Share (%), by Types 2025 & 2033
- Figure 31: South America US LiFi Devices Industry Revenue (million), by Country 2025 & 2033
- Figure 32: South America US LiFi Devices Industry Volume (K Units), by Country 2025 & 2033
- Figure 33: South America US LiFi Devices Industry Revenue Share (%), by Country 2025 & 2033
- Figure 34: South America US LiFi Devices Industry Volume Share (%), by Country 2025 & 2033
- Figure 35: Europe US LiFi Devices Industry Revenue (million), by Cities 2025 & 2033
- Figure 36: Europe US LiFi Devices Industry Volume (K Units), by Cities 2025 & 2033
- Figure 37: Europe US LiFi Devices Industry Revenue Share (%), by Cities 2025 & 2033
- Figure 38: Europe US LiFi Devices Industry Volume Share (%), by Cities 2025 & 2033
- Figure 39: Europe US LiFi Devices Industry Revenue (million), by Estimated Usage 2025 & 2033
- Figure 40: Europe US LiFi Devices Industry Volume (K Units), by Estimated Usage 2025 & 2033
- Figure 41: Europe US LiFi Devices Industry Revenue Share (%), by Estimated Usage 2025 & 2033
- Figure 42: Europe US LiFi Devices Industry Volume Share (%), by Estimated Usage 2025 & 2033
- Figure 43: Europe US LiFi Devices Industry Revenue (million), by Types 2025 & 2033
- Figure 44: Europe US LiFi Devices Industry Volume (K Units), by Types 2025 & 2033
- Figure 45: Europe US LiFi Devices Industry Revenue Share (%), by Types 2025 & 2033
- Figure 46: Europe US LiFi Devices Industry Volume Share (%), by Types 2025 & 2033
- Figure 47: Europe US LiFi Devices Industry Revenue (million), by Country 2025 & 2033
- Figure 48: Europe US LiFi Devices Industry Volume (K Units), by Country 2025 & 2033
- Figure 49: Europe US LiFi Devices Industry Revenue Share (%), by Country 2025 & 2033
- Figure 50: Europe US LiFi Devices Industry Volume Share (%), by Country 2025 & 2033
- Figure 51: Middle East & Africa US LiFi Devices Industry Revenue (million), by Cities 2025 & 2033
- Figure 52: Middle East & Africa US LiFi Devices Industry Volume (K Units), by Cities 2025 & 2033
- Figure 53: Middle East & Africa US LiFi Devices Industry Revenue Share (%), by Cities 2025 & 2033
- Figure 54: Middle East & Africa US LiFi Devices Industry Volume Share (%), by Cities 2025 & 2033
- Figure 55: Middle East & Africa US LiFi Devices Industry Revenue (million), by Estimated Usage 2025 & 2033
- Figure 56: Middle East & Africa US LiFi Devices Industry Volume (K Units), by Estimated Usage 2025 & 2033
- Figure 57: Middle East & Africa US LiFi Devices Industry Revenue Share (%), by Estimated Usage 2025 & 2033
- Figure 58: Middle East & Africa US LiFi Devices Industry Volume Share (%), by Estimated Usage 2025 & 2033
- Figure 59: Middle East & Africa US LiFi Devices Industry Revenue (million), by Types 2025 & 2033
- Figure 60: Middle East & Africa US LiFi Devices Industry Volume (K Units), by Types 2025 & 2033
- Figure 61: Middle East & Africa US LiFi Devices Industry Revenue Share (%), by Types 2025 & 2033
- Figure 62: Middle East & Africa US LiFi Devices Industry Volume Share (%), by Types 2025 & 2033
- Figure 63: Middle East & Africa US LiFi Devices Industry Revenue (million), by Country 2025 & 2033
- Figure 64: Middle East & Africa US LiFi Devices Industry Volume (K Units), by Country 2025 & 2033
- Figure 65: Middle East & Africa US LiFi Devices Industry Revenue Share (%), by Country 2025 & 2033
- Figure 66: Middle East & Africa US LiFi Devices Industry Volume Share (%), by Country 2025 & 2033
- Figure 67: Asia Pacific US LiFi Devices Industry Revenue (million), by Cities 2025 & 2033
- Figure 68: Asia Pacific US LiFi Devices Industry Volume (K Units), by Cities 2025 & 2033
- Figure 69: Asia Pacific US LiFi Devices Industry Revenue Share (%), by Cities 2025 & 2033
- Figure 70: Asia Pacific US LiFi Devices Industry Volume Share (%), by Cities 2025 & 2033
- Figure 71: Asia Pacific US LiFi Devices Industry Revenue (million), by Estimated Usage 2025 & 2033
- Figure 72: Asia Pacific US LiFi Devices Industry Volume (K Units), by Estimated Usage 2025 & 2033
- Figure 73: Asia Pacific US LiFi Devices Industry Revenue Share (%), by Estimated Usage 2025 & 2033
- Figure 74: Asia Pacific US LiFi Devices Industry Volume Share (%), by Estimated Usage 2025 & 2033
- Figure 75: Asia Pacific US LiFi Devices Industry Revenue (million), by Types 2025 & 2033
- Figure 76: Asia Pacific US LiFi Devices Industry Volume (K Units), by Types 2025 & 2033
- Figure 77: Asia Pacific US LiFi Devices Industry Revenue Share (%), by Types 2025 & 2033
- Figure 78: Asia Pacific US LiFi Devices Industry Volume Share (%), by Types 2025 & 2033
- Figure 79: Asia Pacific US LiFi Devices Industry Revenue (million), by Country 2025 & 2033
- Figure 80: Asia Pacific US LiFi Devices Industry Volume (K Units), by Country 2025 & 2033
- Figure 81: Asia Pacific US LiFi Devices Industry Revenue Share (%), by Country 2025 & 2033
- Figure 82: Asia Pacific US LiFi Devices Industry Volume Share (%), by Country 2025 & 2033
List of Tables
- Table 1: Global US LiFi Devices Industry Revenue million Forecast, by Cities 2020 & 2033
- Table 2: Global US LiFi Devices Industry Volume K Units Forecast, by Cities 2020 & 2033
- Table 3: Global US LiFi Devices Industry Revenue million Forecast, by Estimated Usage 2020 & 2033
- Table 4: Global US LiFi Devices Industry Volume K Units Forecast, by Estimated Usage 2020 & 2033
- Table 5: Global US LiFi Devices Industry Revenue million Forecast, by Types 2020 & 2033
- Table 6: Global US LiFi Devices Industry Volume K Units Forecast, by Types 2020 & 2033
- Table 7: Global US LiFi Devices Industry Revenue million Forecast, by Region 2020 & 2033
- Table 8: Global US LiFi Devices Industry Volume K Units Forecast, by Region 2020 & 2033
- Table 9: Global US LiFi Devices Industry Revenue million Forecast, by Cities 2020 & 2033
- Table 10: Global US LiFi Devices Industry Volume K Units Forecast, by Cities 2020 & 2033
- Table 11: Global US LiFi Devices Industry Revenue million Forecast, by Estimated Usage 2020 & 2033
- Table 12: Global US LiFi Devices Industry Volume K Units Forecast, by Estimated Usage 2020 & 2033
- Table 13: Global US LiFi Devices Industry Revenue million Forecast, by Types 2020 & 2033
- Table 14: Global US LiFi Devices Industry Volume K Units Forecast, by Types 2020 & 2033
- Table 15: Global US LiFi Devices Industry Revenue million Forecast, by Country 2020 & 2033
- Table 16: Global US LiFi Devices Industry Volume K Units Forecast, by Country 2020 & 2033
- Table 17: United States US LiFi Devices Industry Revenue (million) Forecast, by Application 2020 & 2033
- Table 18: United States US LiFi Devices Industry Volume (K Units) Forecast, by Application 2020 & 2033
- Table 19: Canada US LiFi Devices Industry Revenue (million) Forecast, by Application 2020 & 2033
- Table 20: Canada US LiFi Devices Industry Volume (K Units) Forecast, by Application 2020 & 2033
- Table 21: Mexico US LiFi Devices Industry Revenue (million) Forecast, by Application 2020 & 2033
- Table 22: Mexico US LiFi Devices Industry Volume (K Units) Forecast, by Application 2020 & 2033
- Table 23: Global US LiFi Devices Industry Revenue million Forecast, by Cities 2020 & 2033
- Table 24: Global US LiFi Devices Industry Volume K Units Forecast, by Cities 2020 & 2033
- Table 25: Global US LiFi Devices Industry Revenue million Forecast, by Estimated Usage 2020 & 2033
- Table 26: Global US LiFi Devices Industry Volume K Units Forecast, by Estimated Usage 2020 & 2033
- Table 27: Global US LiFi Devices Industry Revenue million Forecast, by Types 2020 & 2033
- Table 28: Global US LiFi Devices Industry Volume K Units Forecast, by Types 2020 & 2033
- Table 29: Global US LiFi Devices Industry Revenue million Forecast, by Country 2020 & 2033
- Table 30: Global US LiFi Devices Industry Volume K Units Forecast, by Country 2020 & 2033
- Table 31: Brazil US LiFi Devices Industry Revenue (million) Forecast, by Application 2020 & 2033
- Table 32: Brazil US LiFi Devices Industry Volume (K Units) Forecast, by Application 2020 & 2033
- Table 33: Argentina US LiFi Devices Industry Revenue (million) Forecast, by Application 2020 & 2033
- Table 34: Argentina US LiFi Devices Industry Volume (K Units) Forecast, by Application 2020 & 2033
- Table 35: Rest of South America US LiFi Devices Industry Revenue (million) Forecast, by Application 2020 & 2033
- Table 36: Rest of South America US LiFi Devices Industry Volume (K Units) Forecast, by Application 2020 & 2033
- Table 37: Global US LiFi Devices Industry Revenue million Forecast, by Cities 2020 & 2033
- Table 38: Global US LiFi Devices Industry Volume K Units Forecast, by Cities 2020 & 2033
- Table 39: Global US LiFi Devices Industry Revenue million Forecast, by Estimated Usage 2020 & 2033
- Table 40: Global US LiFi Devices Industry Volume K Units Forecast, by Estimated Usage 2020 & 2033
- Table 41: Global US LiFi Devices Industry Revenue million Forecast, by Types 2020 & 2033
- Table 42: Global US LiFi Devices Industry Volume K Units Forecast, by Types 2020 & 2033
- Table 43: Global US LiFi Devices Industry Revenue million Forecast, by Country 2020 & 2033
- Table 44: Global US LiFi Devices Industry Volume K Units Forecast, by Country 2020 & 2033
- Table 45: United Kingdom US LiFi Devices Industry Revenue (million) Forecast, by Application 2020 & 2033
- Table 46: United Kingdom US LiFi Devices Industry Volume (K Units) Forecast, by Application 2020 & 2033
- Table 47: Germany US LiFi Devices Industry Revenue (million) Forecast, by Application 2020 & 2033
- Table 48: Germany US LiFi Devices Industry Volume (K Units) Forecast, by Application 2020 & 2033
- Table 49: France US LiFi Devices Industry Revenue (million) Forecast, by Application 2020 & 2033
- Table 50: France US LiFi Devices Industry Volume (K Units) Forecast, by Application 2020 & 2033
- Table 51: Italy US LiFi Devices Industry Revenue (million) Forecast, by Application 2020 & 2033
- Table 52: Italy US LiFi Devices Industry Volume (K Units) Forecast, by Application 2020 & 2033
- Table 53: Spain US LiFi Devices Industry Revenue (million) Forecast, by Application 2020 & 2033
- Table 54: Spain US LiFi Devices Industry Volume (K Units) Forecast, by Application 2020 & 2033
- Table 55: Russia US LiFi Devices Industry Revenue (million) Forecast, by Application 2020 & 2033
- Table 56: Russia US LiFi Devices Industry Volume (K Units) Forecast, by Application 2020 & 2033
- Table 57: Benelux US LiFi Devices Industry Revenue (million) Forecast, by Application 2020 & 2033
- Table 58: Benelux US LiFi Devices Industry Volume (K Units) Forecast, by Application 2020 & 2033
- Table 59: Nordics US LiFi Devices Industry Revenue (million) Forecast, by Application 2020 & 2033
- Table 60: Nordics US LiFi Devices Industry Volume (K Units) Forecast, by Application 2020 & 2033
- Table 61: Rest of Europe US LiFi Devices Industry Revenue (million) Forecast, by Application 2020 & 2033
- Table 62: Rest of Europe US LiFi Devices Industry Volume (K Units) Forecast, by Application 2020 & 2033
- Table 63: Global US LiFi Devices Industry Revenue million Forecast, by Cities 2020 & 2033
- Table 64: Global US LiFi Devices Industry Volume K Units Forecast, by Cities 2020 & 2033
- Table 65: Global US LiFi Devices Industry Revenue million Forecast, by Estimated Usage 2020 & 2033
- Table 66: Global US LiFi Devices Industry Volume K Units Forecast, by Estimated Usage 2020 & 2033
- Table 67: Global US LiFi Devices Industry Revenue million Forecast, by Types 2020 & 2033
- Table 68: Global US LiFi Devices Industry Volume K Units Forecast, by Types 2020 & 2033
- Table 69: Global US LiFi Devices Industry Revenue million Forecast, by Country 2020 & 2033
- Table 70: Global US LiFi Devices Industry Volume K Units Forecast, by Country 2020 & 2033
- Table 71: Turkey US LiFi Devices Industry Revenue (million) Forecast, by Application 2020 & 2033
- Table 72: Turkey US LiFi Devices Industry Volume (K Units) Forecast, by Application 2020 & 2033
- Table 73: Israel US LiFi Devices Industry Revenue (million) Forecast, by Application 2020 & 2033
- Table 74: Israel US LiFi Devices Industry Volume (K Units) Forecast, by Application 2020 & 2033
- Table 75: GCC US LiFi Devices Industry Revenue (million) Forecast, by Application 2020 & 2033
- Table 76: GCC US LiFi Devices Industry Volume (K Units) Forecast, by Application 2020 & 2033
- Table 77: North Africa US LiFi Devices Industry Revenue (million) Forecast, by Application 2020 & 2033
- Table 78: North Africa US LiFi Devices Industry Volume (K Units) Forecast, by Application 2020 & 2033
- Table 79: South Africa US LiFi Devices Industry Revenue (million) Forecast, by Application 2020 & 2033
- Table 80: South Africa US LiFi Devices Industry Volume (K Units) Forecast, by Application 2020 & 2033
- Table 81: Rest of Middle East & Africa US LiFi Devices Industry Revenue (million) Forecast, by Application 2020 & 2033
- Table 82: Rest of Middle East & Africa US LiFi Devices Industry Volume (K Units) Forecast, by Application 2020 & 2033
- Table 83: Global US LiFi Devices Industry Revenue million Forecast, by Cities 2020 & 2033
- Table 84: Global US LiFi Devices Industry Volume K Units Forecast, by Cities 2020 & 2033
- Table 85: Global US LiFi Devices Industry Revenue million Forecast, by Estimated Usage 2020 & 2033
- Table 86: Global US LiFi Devices Industry Volume K Units Forecast, by Estimated Usage 2020 & 2033
- Table 87: Global US LiFi Devices Industry Revenue million Forecast, by Types 2020 & 2033
- Table 88: Global US LiFi Devices Industry Volume K Units Forecast, by Types 2020 & 2033
- Table 89: Global US LiFi Devices Industry Revenue million Forecast, by Country 2020 & 2033
- Table 90: Global US LiFi Devices Industry Volume K Units Forecast, by Country 2020 & 2033
- Table 91: China US LiFi Devices Industry Revenue (million) Forecast, by Application 2020 & 2033
- Table 92: China US LiFi Devices Industry Volume (K Units) Forecast, by Application 2020 & 2033
- Table 93: India US LiFi Devices Industry Revenue (million) Forecast, by Application 2020 & 2033
- Table 94: India US LiFi Devices Industry Volume (K Units) Forecast, by Application 2020 & 2033
- Table 95: Japan US LiFi Devices Industry Revenue (million) Forecast, by Application 2020 & 2033
- Table 96: Japan US LiFi Devices Industry Volume (K Units) Forecast, by Application 2020 & 2033
- Table 97: South Korea US LiFi Devices Industry Revenue (million) Forecast, by Application 2020 & 2033
- Table 98: South Korea US LiFi Devices Industry Volume (K Units) Forecast, by Application 2020 & 2033
- Table 99: ASEAN US LiFi Devices Industry Revenue (million) Forecast, by Application 2020 & 2033
- Table 100: ASEAN US LiFi Devices Industry Volume (K Units) Forecast, by Application 2020 & 2033
- Table 101: Oceania US LiFi Devices Industry Revenue (million) Forecast, by Application 2020 & 2033
- Table 102: Oceania US LiFi Devices Industry Volume (K Units) Forecast, by Application 2020 & 2033
- Table 103: Rest of Asia Pacific US LiFi Devices Industry Revenue (million) Forecast, by Application 2020 & 2033
- Table 104: Rest of Asia Pacific US LiFi Devices Industry Volume (K Units) Forecast, by Application 2020 & 2033
Frequently Asked Questions
1. What is the projected Compound Annual Growth Rate (CAGR) of the US LiFi Devices Industry?
The projected CAGR is approximately 48.34%.
2. Which companies are prominent players in the US LiFi Devices Industry?
Key companies in the market include Signify, LiFi Labs, Oledcomm.
3. What are the main segments of the US LiFi Devices Industry?
The market segments include Cities, Estimated Usage, Types.
4. Can you provide details about the market size?
The market size is estimated to be USD 990.94 million as of 2022.
5. What are some drivers contributing to market growth?
Huge Demand for Specialized Internet Technologies; Low Energy Consumption; Faster and Safe Data Transfer; High Bandwidth; Vast Applications.
6. What are the notable trends driving market growth?
LED Segment is Expected to Register a Significant Growth Rate.
7. Are there any restraints impacting market growth?
Limited Range; Cannot Substitute Wi-Fi Completely; Scattered Internet Penetration; Transmission can be Easily Disrupted.
8. Can you provide examples of recent developments in the market?
September 2023 - Getac announced it has embedded LiFi technology into rugged devices as part of an innovation project with Signify, one of the global leaders in lighting. Getac is working closely with Signify's Trulifi technology on the project to bring LiFi technology to its customers.
9. What pricing options are available for accessing the report?
Pricing options include single-user, multi-user, and enterprise licenses priced at USD 3800, USD 4500, and USD 5800 respectively.
10. Is the market size provided in terms of value or volume?
The market size is provided in terms of value, measured in million and volume, measured in K Units.
11. Are there any specific market keywords associated with the report?
Yes, the market keyword associated with the report is "US LiFi Devices Industry," which aids in identifying and referencing the specific market segment covered.
12. How do I determine which pricing option suits my needs best?
The pricing options vary based on user requirements and access needs. Individual users may opt for single-user licenses, while businesses requiring broader access may choose multi-user or enterprise licenses for cost-effective access to the report.
13. Are there any additional resources or data provided in the US LiFi Devices Industry report?
While the report offers comprehensive insights, it's advisable to review the specific contents or supplementary materials provided to ascertain if additional resources or data are available.
14. How can I stay updated on further developments or reports in the US LiFi Devices Industry?
To stay informed about further developments, trends, and reports in the US LiFi Devices Industry, consider subscribing to industry newsletters, following relevant companies and organizations, or regularly checking reputable industry news sources and publications.
Methodology
Step 1 - Identification of Relevant Samples Size from Population Database


Step 2 - Approaches for Defining Global Market Size (Value, Volume* & Price*)

Note*: In applicable scenarios
Step 3 - Data Sources
Primary Research
- Web Analytics
- Survey Reports
- Research Institute
- Latest Research Reports
- Opinion Leaders
Secondary Research
- Annual Reports
- White Paper
- Latest Press Release
- Industry Association
- Paid Database
- Investor Presentations

Step 4 - Data Triangulation
Involves using different sources of information in order to increase the validity of a study
These sources are likely to be stakeholders in a program - participants, other researchers, program staff, other community members, and so on.
Then we put all data in single framework & apply various statistical tools to find out the dynamic on the market.
During the analysis stage, feedback from the stakeholder groups would be compared to determine areas of agreement as well as areas of divergence