

Key Insights
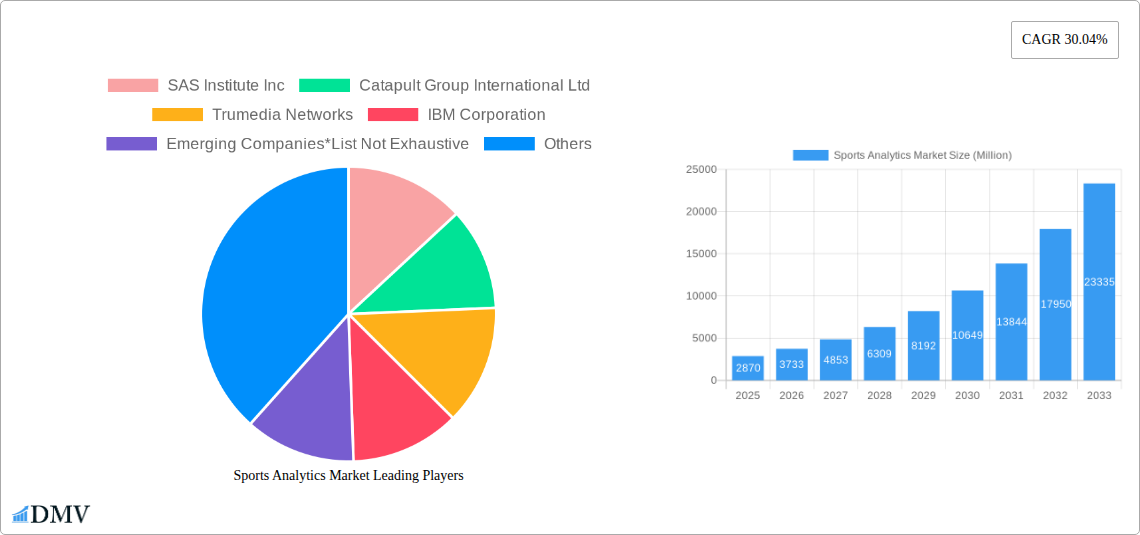
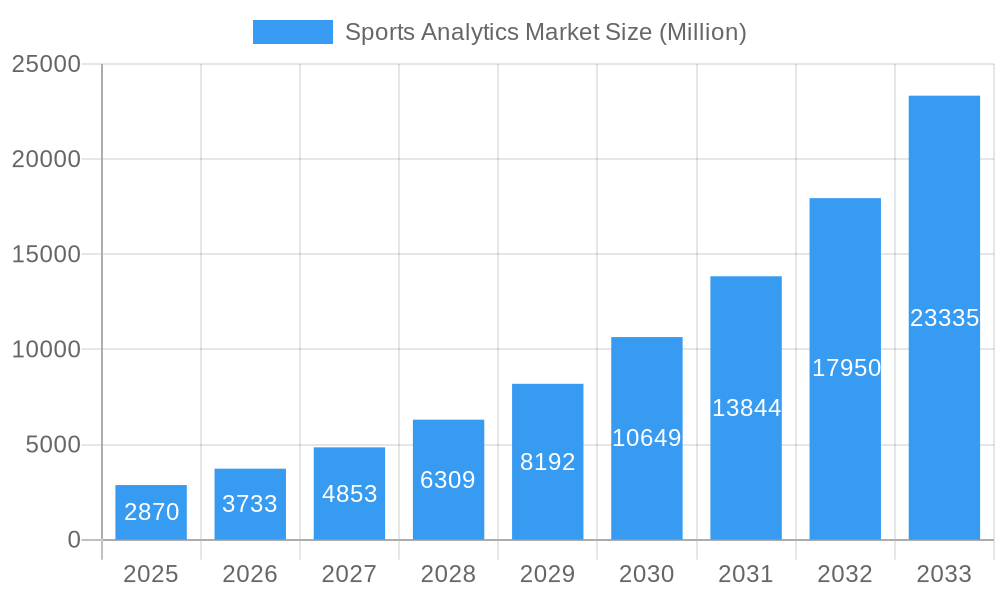
The global sports analytics market is experiencing explosive growth, projected to reach \$2.87 billion in 2025 and exhibiting a robust Compound Annual Growth Rate (CAGR) of 30.04%. This surge is driven by several key factors. Firstly, the increasing reliance on data-driven decision-making by sports teams and organizations is paramount. Teams are leveraging advanced analytics to optimize player performance, improve scouting strategies, enhance game-day strategy, and personalize fan engagement. Secondly, technological advancements, particularly in areas like AI, machine learning, and wearable sensor technology, are fueling the development of sophisticated analytical tools that provide deeper insights into player and team performance. The proliferation of affordable, high-quality data capture and processing capabilities also contributes to the market's expansion. Finally, the growing popularity of sports globally, especially in emerging markets, creates a larger addressable market for sports analytics solutions. The segmentation reveals strong demand across various sports, with football, cricket, basketball, and American football leading the charge.
Sports Analytics Market Market Size (In Billion)
The market's regional distribution reflects the concentration of major sports leagues and technological advancements. North America currently holds a significant market share, driven by the established presence of major leagues and the early adoption of data-driven strategies. Europe and Asia Pacific are also experiencing rapid growth, fuelled by rising investments in sports infrastructure and the increasing popularity of professional sports. While the market faces restraints such as high implementation costs and the need for specialized expertise, the overall positive trends suggest sustained growth through 2033. Key players like SAS Institute, Catapult Group International, and Sportsradar are driving innovation and market penetration, while emerging companies are contributing to the development of niche solutions. Competition is expected to intensify, with a focus on delivering tailored solutions and creating partnerships to leverage broader market opportunities.
Sports Analytics Market Company Market Share
Sports Analytics Market: A Comprehensive Report (2019-2033)
This insightful report provides a detailed analysis of the Sports Analytics Market, offering a comprehensive overview of its current state, future trajectory, and key players. With a study period spanning 2019-2033, a base year of 2025, and a forecast period of 2025-2033, this report is an invaluable resource for stakeholders seeking to understand and capitalize on the opportunities within this rapidly evolving market. The global market size is estimated to reach xx Million by 2025 and is projected to grow at a CAGR of xx% during the forecast period.
Sports Analytics Market Market Composition & Trends
The Sports Analytics Market is characterized by a dynamic interplay of factors influencing its growth and evolution. Market concentration is currently moderate, with a few major players holding significant shares, while numerous emerging companies contribute to innovation. The market share distribution is as follows: SAS Institute Inc. (xx%), IBM Corporation (xx%), Sportsradar AG (xx%), and others (xx%). Innovation is fueled by advancements in AI, machine learning, and data visualization technologies. The regulatory landscape varies across regions, impacting data privacy and usage. Substitute products, such as traditional scouting methods, continue to exist but are increasingly challenged by the efficiency and insights offered by sports analytics. End-users primarily include professional sports teams, leagues, broadcasters, and sports betting operators. M&A activity is significant, with deals primarily focused on acquiring specialized technology or data sets. The total value of M&A deals in the past five years is estimated at xx Million.
- Market Concentration: Moderate, with several major and many emerging players.
- Innovation Catalysts: AI, machine learning, big data analytics, cloud computing.
- Regulatory Landscape: Varies regionally, impacting data privacy and usage.
- Substitute Products: Traditional scouting methods, but increasingly less competitive.
- End-User Profiles: Professional sports teams, leagues, broadcasters, and betting operators.
- M&A Activities: Significant, driven by technology and data acquisition; total value in past 5 years: xx Million.
Sports Analytics Market Industry Evolution
The Sports Analytics Market has witnessed remarkable growth since 2019, driven by the increasing adoption of data-driven decision-making in sports. Technological advancements, particularly in AI and machine learning, have significantly enhanced the capabilities of analytics platforms. The development of sophisticated algorithms for predictive modeling, player performance analysis, and injury prevention has revolutionized how teams approach training, recruitment, and game strategy. This is reflected in the market's growth trajectory. From 2019 to 2024, the market experienced a growth rate of xx%, while the forecast for 2025-2033 suggests an even faster expansion. Adoption metrics, such as the percentage of professional sports teams utilizing analytics tools, have increased dramatically, from xx% in 2019 to an estimated xx% in 2025. Shifting consumer demands, particularly the increased consumption of sports content and the growth of fantasy sports, have further fueled market growth. The integration of analytics into broadcasting, fan engagement, and betting has created new revenue streams and expanded the market's reach. The industry is also seeing increased investment in R&D, further driving innovation and competition.
Leading Regions, Countries, or Segments in Sports Analytics Market
The North American market currently dominates the global Sports Analytics Market, driven by significant investment in sports technology, a mature sports industry, and a high level of technological sophistication. Europe follows closely, with strong growth in the UK and several other countries. The dominance of North America stems from several key factors:
- High Investment in Sports Technology: Significant funding from venture capitalists and private equity firms.
- Mature Sports Industry: Established leagues and teams with large budgets for analytics solutions.
- Technological Sophistication: High concentration of technology companies and skilled workforce.
Other regions, such as Asia-Pacific and Latin America, are showing increasing potential, with rapidly growing sports markets and increasing adoption of analytics technologies. In terms of sports segments, Football (Soccer) remains the largest contributor due to the global popularity of the sport and the vast amount of data available. However, other sports like Basketball and American Football are rapidly catching up, exhibiting significant growth and adoption of analytics.
- Football (Soccer): Highest market share due to global popularity and data availability.
- Basketball: Rapid growth due to high-value data and strategic use in team management.
- American Football: Significant market share with advanced analytics for player assessment and game strategy.
- Cricket: Growing market due to increasing adoption of analytics in international matches.
- Hockey: Increasing investment in data analysis for player performance and strategic decision-making.
Sports Analytics Market Product Innovations
Recent innovations in sports analytics include the integration of AI and machine learning for predictive modeling, advanced data visualization tools, wearable sensor technology for player performance tracking, and the development of specialized software platforms for recruitment, player development, and injury prevention. These innovations offer unique selling propositions such as improved accuracy in predicting game outcomes, enhanced player performance analysis, and more efficient team management. Technological advancements are continually improving the speed, accuracy, and scope of sports analytics, creating a competitive landscape driven by continuous improvement.
Propelling Factors for Sports Analytics Market Growth
The Sports Analytics Market is propelled by several key factors: The increasing availability of high-quality data, particularly from wearable sensors and video analysis, enables more accurate and insightful analysis. Advancements in AI and machine learning algorithms enhance the predictive capabilities of analytics platforms. The growing adoption of cloud-based solutions improves accessibility and scalability, making analytics more affordable and accessible for smaller teams and organizations. Finally, the increasing awareness among sports organizations of the strategic value of data-driven decision-making drives investment and adoption.
Obstacles in the Sports Analytics Market Market
The Sports Analytics Market faces challenges including the high cost of advanced analytics solutions, the need for specialized expertise to interpret and utilize data effectively, and concerns about data privacy and security. Supply chain disruptions in technology manufacturing can delay the deployment of new solutions. Furthermore, intense competition among analytics providers and the integration of new technologies pose potential challenges.
Future Opportunities in Sports Analytics Market
Future opportunities in the Sports Analytics Market include expansion into new sports and regions, the development of more sophisticated predictive models for injury prevention and player performance enhancement, and the integration of analytics with wearable technology for real-time feedback. The increasing adoption of augmented reality (AR) and virtual reality (VR) technologies offers new avenues for data visualization and fan engagement. Moreover, the growth of eSports presents a significant emerging market for sports analytics.
Major Players in the Sports Analytics Market Ecosystem
- SAS Institute Inc
- Catapult Group International Ltd
- Trumedia Networks
- IBM Corporation
- Emerging Companies*List Not Exhaustive
- Stats LLC
- Opta Sports
- Tableau Software Inc
- Oracle Corporation
- Sportsradar AG
- SAP SE
Key Developments in Sports Analytics Market Industry
- October 2023: Texas A&M Athletics Sports Science partnered with Gemini Sports Analytics, integrating AI-powered software for predictive analytics and enhanced student-athlete support.
- February 2023: Gemini Sports Analytics partnered with SIS (Sports Info Solutions) to pre-integrate SIS data into the Gemini app, enhancing data accessibility and analytical capabilities for clients.
Strategic Sports Analytics Market Market Forecast
The Sports Analytics Market is poised for significant growth over the next decade, driven by ongoing technological advancements, increased data availability, and rising adoption rates across various sports and regions. The market's potential is vast, with opportunities for innovation and expansion in areas such as predictive modeling, player performance analysis, and fan engagement. The continued integration of AI and machine learning will further enhance the capabilities of analytics platforms, leading to more accurate and insightful decision-making across the sports industry.
Sports Analytics Market Segmentation
-
1. Sport
- 1.1. Football
- 1.2. Cricket
- 1.3. Hockey
- 1.4. Basketball
- 1.5. American Football
- 1.6. Other Sports
Sports Analytics Market Segmentation By Geography
- 1. North America
- 2. Europe
- 3. Asia Pacific
- 4. Latin America
- 5. Middle East and Africa
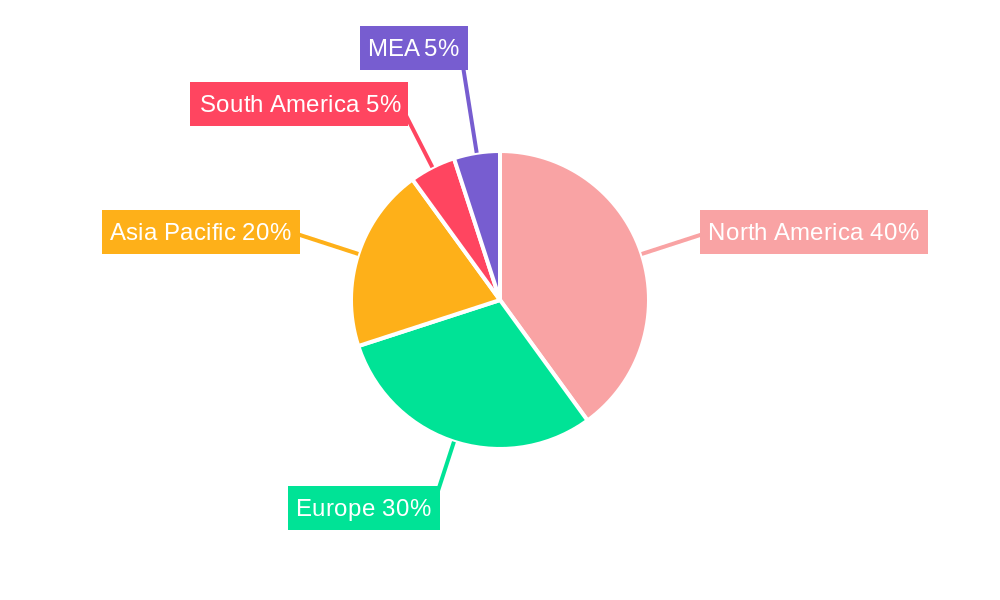
Sports Analytics Market Regional Market Share
Geographic Coverage of Sports Analytics Market
Sports Analytics Market REPORT HIGHLIGHTS
| Aspects | Details |
|---|---|
| Study Period | 2020-2034 |
| Base Year | 2025 |
| Estimated Year | 2026 |
| Forecast Period | 2026-2034 |
| Historical Period | 2020-2025 |
| Growth Rate | CAGR of 30.04% from 2020-2034 |
| Segmentation |
|
Table of Contents
- 1. Introduction
- 1.1. Research Scope
- 1.2. Market Segmentation
- 1.3. Research Objective
- 1.4. Definitions and Assumptions
- 2. Executive Summary
- 2.1. Market Snapshot
- 3. Market Dynamics
- 3.1. Market Drivers
- 3.2. Market Restrains
- 3.3. Market Trends
- 3.4. Market Opportunities
- 4. Market Factor Analysis
- 4.1. Porters Five Forces
- 4.1.1. Bargaining Power of Suppliers
- 4.1.2. Bargaining Power of Buyers
- 4.1.3. Threat of New Entrants
- 4.1.4. Threat of Substitutes
- 4.1.5. Competitive Rivalry
- 4.2. PESTEL analysis
- 4.3. BCG Analysis
- 4.3.1. Stars (High Growth, High Market Share)
- 4.3.2. Cash Cows (Low Growth, High Market Share)
- 4.3.3. Question Mark (High Growth, Low Market Share)
- 4.3.4. Dogs (Low Growth, Low Market Share)
- 4.4. Ansoff Matrix Analysis
- 4.5. Supply Chain Analysis
- 4.6. Regulatory Landscape
- 4.7. Current Market Potential and Opportunity Assessment (TAM–SAM–SOM Framework)
- 4.8. DMV Analyst Note
- 4.1. Porters Five Forces
- 5. Market Analysis, Insights and Forecast 2021-2033
- 5.1. Market Analysis, Insights and Forecast - by Sport
- 5.1.1. Football
- 5.1.2. Cricket
- 5.1.3. Hockey
- 5.1.4. Basketball
- 5.1.5. American Football
- 5.1.6. Other Sports
- 5.2. Market Analysis, Insights and Forecast - by Region
- 5.2.1. North America
- 5.2.2. Europe
- 5.2.3. Asia Pacific
- 5.2.4. Latin America
- 5.2.5. Middle East and Africa
- 5.1. Market Analysis, Insights and Forecast - by Sport
- 6. Global Sports Analytics Market Analysis, Insights and Forecast, 2021-2033
- 6.1. Market Analysis, Insights and Forecast - by Sport
- 6.1.1. Football
- 6.1.2. Cricket
- 6.1.3. Hockey
- 6.1.4. Basketball
- 6.1.5. American Football
- 6.1.6. Other Sports
- 6.1. Market Analysis, Insights and Forecast - by Sport
- 7. North America Sports Analytics Market Analysis, Insights and Forecast, 2020-2032
- 7.1. Market Analysis, Insights and Forecast - by Sport
- 7.1.1. Football
- 7.1.2. Cricket
- 7.1.3. Hockey
- 7.1.4. Basketball
- 7.1.5. American Football
- 7.1.6. Other Sports
- 7.1. Market Analysis, Insights and Forecast - by Sport
- 8. Europe Sports Analytics Market Analysis, Insights and Forecast, 2020-2032
- 8.1. Market Analysis, Insights and Forecast - by Sport
- 8.1.1. Football
- 8.1.2. Cricket
- 8.1.3. Hockey
- 8.1.4. Basketball
- 8.1.5. American Football
- 8.1.6. Other Sports
- 8.1. Market Analysis, Insights and Forecast - by Sport
- 9. Asia Pacific Sports Analytics Market Analysis, Insights and Forecast, 2020-2032
- 9.1. Market Analysis, Insights and Forecast - by Sport
- 9.1.1. Football
- 9.1.2. Cricket
- 9.1.3. Hockey
- 9.1.4. Basketball
- 9.1.5. American Football
- 9.1.6. Other Sports
- 9.1. Market Analysis, Insights and Forecast - by Sport
- 10. Latin America Sports Analytics Market Analysis, Insights and Forecast, 2020-2032
- 10.1. Market Analysis, Insights and Forecast - by Sport
- 10.1.1. Football
- 10.1.2. Cricket
- 10.1.3. Hockey
- 10.1.4. Basketball
- 10.1.5. American Football
- 10.1.6. Other Sports
- 10.1. Market Analysis, Insights and Forecast - by Sport
- 11. Middle East and Africa Sports Analytics Market Analysis, Insights and Forecast, 2020-2032
- 11.1. Market Analysis, Insights and Forecast - by Sport
- 11.1.1. Football
- 11.1.2. Cricket
- 11.1.3. Hockey
- 11.1.4. Basketball
- 11.1.5. American Football
- 11.1.6. Other Sports
- 11.1. Market Analysis, Insights and Forecast - by Sport
- 12. Competitive Analysis
- 12.1. Company Profiles
- 12.1.1 SAS Institute Inc
- 12.1.1.1. Company Overview
- 12.1.1.2. Products
- 12.1.1.3. Company Financials
- 12.1.1.4. SWOT Analysis
- 12.1.2 Catapult Group International Ltd
- 12.1.2.1. Company Overview
- 12.1.2.2. Products
- 12.1.2.3. Company Financials
- 12.1.2.4. SWOT Analysis
- 12.1.3 Trumedia Networks
- 12.1.3.1. Company Overview
- 12.1.3.2. Products
- 12.1.3.3. Company Financials
- 12.1.3.4. SWOT Analysis
- 12.1.4 IBM Corporation
- 12.1.4.1. Company Overview
- 12.1.4.2. Products
- 12.1.4.3. Company Financials
- 12.1.4.4. SWOT Analysis
- 12.1.5 Emerging Companies*List Not Exhaustive
- 12.1.5.1. Company Overview
- 12.1.5.2. Products
- 12.1.5.3. Company Financials
- 12.1.5.4. SWOT Analysis
- 12.1.6 Stats LLC
- 12.1.6.1. Company Overview
- 12.1.6.2. Products
- 12.1.6.3. Company Financials
- 12.1.6.4. SWOT Analysis
- 12.1.7 Opta Sports
- 12.1.7.1. Company Overview
- 12.1.7.2. Products
- 12.1.7.3. Company Financials
- 12.1.7.4. SWOT Analysis
- 12.1.8 Tableau Software Inc
- 12.1.8.1. Company Overview
- 12.1.8.2. Products
- 12.1.8.3. Company Financials
- 12.1.8.4. SWOT Analysis
- 12.1.9 Oracle Corporation
- 12.1.9.1. Company Overview
- 12.1.9.2. Products
- 12.1.9.3. Company Financials
- 12.1.9.4. SWOT Analysis
- 12.1.10 Sportsradar AG
- 12.1.10.1. Company Overview
- 12.1.10.2. Products
- 12.1.10.3. Company Financials
- 12.1.10.4. SWOT Analysis
- 12.1.11 SAP SE
- 12.1.11.1. Company Overview
- 12.1.11.2. Products
- 12.1.11.3. Company Financials
- 12.1.11.4. SWOT Analysis
- 12.1.1 SAS Institute Inc
- 12.2. Market Entropy
- 12.2.1 Company's Key Areas Served
- 12.2.2 Recent Developments
- 12.3. Company Market Share Analysis 2025
- 12.3.1 Top 5 Companies Market Share Analysis
- 12.3.2 Top 3 Companies Market Share Analysis
- 12.4. List of Potential Customers
- 13. Research Methodology
List of Figures
- Figure 1: Global Sports Analytics Market Revenue Breakdown (Million, %) by Region 2025 & 2033
- Figure 2: North America Sports Analytics Market Revenue (Million), by Sport 2025 & 2033
- Figure 3: North America Sports Analytics Market Revenue Share (%), by Sport 2025 & 2033
- Figure 4: North America Sports Analytics Market Revenue (Million), by Country 2025 & 2033
- Figure 5: North America Sports Analytics Market Revenue Share (%), by Country 2025 & 2033
- Figure 6: Europe Sports Analytics Market Revenue (Million), by Sport 2025 & 2033
- Figure 7: Europe Sports Analytics Market Revenue Share (%), by Sport 2025 & 2033
- Figure 8: Europe Sports Analytics Market Revenue (Million), by Country 2025 & 2033
- Figure 9: Europe Sports Analytics Market Revenue Share (%), by Country 2025 & 2033
- Figure 10: Asia Pacific Sports Analytics Market Revenue (Million), by Sport 2025 & 2033
- Figure 11: Asia Pacific Sports Analytics Market Revenue Share (%), by Sport 2025 & 2033
- Figure 12: Asia Pacific Sports Analytics Market Revenue (Million), by Country 2025 & 2033
- Figure 13: Asia Pacific Sports Analytics Market Revenue Share (%), by Country 2025 & 2033
- Figure 14: Latin America Sports Analytics Market Revenue (Million), by Sport 2025 & 2033
- Figure 15: Latin America Sports Analytics Market Revenue Share (%), by Sport 2025 & 2033
- Figure 16: Latin America Sports Analytics Market Revenue (Million), by Country 2025 & 2033
- Figure 17: Latin America Sports Analytics Market Revenue Share (%), by Country 2025 & 2033
- Figure 18: Middle East and Africa Sports Analytics Market Revenue (Million), by Sport 2025 & 2033
- Figure 19: Middle East and Africa Sports Analytics Market Revenue Share (%), by Sport 2025 & 2033
- Figure 20: Middle East and Africa Sports Analytics Market Revenue (Million), by Country 2025 & 2033
- Figure 21: Middle East and Africa Sports Analytics Market Revenue Share (%), by Country 2025 & 2033
List of Tables
- Table 1: Global Sports Analytics Market Revenue Million Forecast, by Sport 2020 & 2033
- Table 2: Global Sports Analytics Market Revenue Million Forecast, by Region 2020 & 2033
- Table 3: Global Sports Analytics Market Revenue Million Forecast, by Sport 2020 & 2033
- Table 4: Global Sports Analytics Market Revenue Million Forecast, by Country 2020 & 2033
- Table 5: Global Sports Analytics Market Revenue Million Forecast, by Sport 2020 & 2033
- Table 6: Global Sports Analytics Market Revenue Million Forecast, by Country 2020 & 2033
- Table 7: Global Sports Analytics Market Revenue Million Forecast, by Sport 2020 & 2033
- Table 8: Global Sports Analytics Market Revenue Million Forecast, by Country 2020 & 2033
- Table 9: Global Sports Analytics Market Revenue Million Forecast, by Sport 2020 & 2033
- Table 10: Global Sports Analytics Market Revenue Million Forecast, by Country 2020 & 2033
- Table 11: Global Sports Analytics Market Revenue Million Forecast, by Sport 2020 & 2033
- Table 12: Global Sports Analytics Market Revenue Million Forecast, by Country 2020 & 2033
Frequently Asked Questions
1. What is the projected Compound Annual Growth Rate (CAGR) of the Sports Analytics Market?
The projected CAGR is approximately 30.04%.
2. Which companies are prominent players in the Sports Analytics Market?
Key companies in the market include SAS Institute Inc, Catapult Group International Ltd, Trumedia Networks, IBM Corporation, Emerging Companies*List Not Exhaustive, Stats LLC, Opta Sports, Tableau Software Inc, Oracle Corporation, Sportsradar AG, SAP SE.
3. What are the main segments of the Sports Analytics Market?
The market segments include Sport.
4. Can you provide details about the market size?
The market size is estimated to be USD 2.87 Million as of 2022.
5. What are some drivers contributing to market growth?
Rising Adoption of Big Data Analytics. AI and ML Technologies; Increase in Investments in the Newer Technologies.
6. What are the notable trends driving market growth?
Football Sport is Expected to Hold Significant Market Share.
7. Are there any restraints impacting market growth?
Lack of Awareness About the Benefits of Sports Analytics Solutions.
8. Can you provide examples of recent developments in the market?
October 2023, Texas A&M Athletics Sports Science announced that it has entered into an arrangement with Gemini Sports Analytics to offer the Aggies' staff Gemini’s AI software platform built-for sports that is projected to empower the Aggies to access prognostic analytics in addition to metrics to aid support student-athletes. The Gemini application authorizes stakeholders by offering predictive data analytics to the end users, cumulative interdisciplinary professionals' efficiency, and permitting high-level decision-makers to make game-changing choices faster.
9. What pricing options are available for accessing the report?
Pricing options include single-user, multi-user, and enterprise licenses priced at USD 4750, USD 5250, and USD 8750 respectively.
10. Is the market size provided in terms of value or volume?
The market size is provided in terms of value, measured in Million.
11. Are there any specific market keywords associated with the report?
Yes, the market keyword associated with the report is "Sports Analytics Market," which aids in identifying and referencing the specific market segment covered.
12. How do I determine which pricing option suits my needs best?
The pricing options vary based on user requirements and access needs. Individual users may opt for single-user licenses, while businesses requiring broader access may choose multi-user or enterprise licenses for cost-effective access to the report.
13. Are there any additional resources or data provided in the Sports Analytics Market report?
While the report offers comprehensive insights, it's advisable to review the specific contents or supplementary materials provided to ascertain if additional resources or data are available.
14. How can I stay updated on further developments or reports in the Sports Analytics Market?
To stay informed about further developments, trends, and reports in the Sports Analytics Market, consider subscribing to industry newsletters, following relevant companies and organizations, or regularly checking reputable industry news sources and publications.
Methodology
Step 1 - Identification of Relevant Samples Size from Population Database


Step 2 - Approaches for Defining Global Market Size (Value, Volume* & Price*)

Note*: In applicable scenarios
Step 3 - Data Sources
Primary Research
- Web Analytics
- Survey Reports
- Research Institute
- Latest Research Reports
- Opinion Leaders
Secondary Research
- Annual Reports
- White Paper
- Latest Press Release
- Industry Association
- Paid Database
- Investor Presentations

Step 4 - Data Triangulation
Involves using different sources of information in order to increase the validity of a study
These sources are likely to be stakeholders in a program - participants, other researchers, program staff, other community members, and so on.
Then we put all data in single framework & apply various statistical tools to find out the dynamic on the market.
During the analysis stage, feedback from the stakeholder groups would be compared to determine areas of agreement as well as areas of divergence