

Key Insights
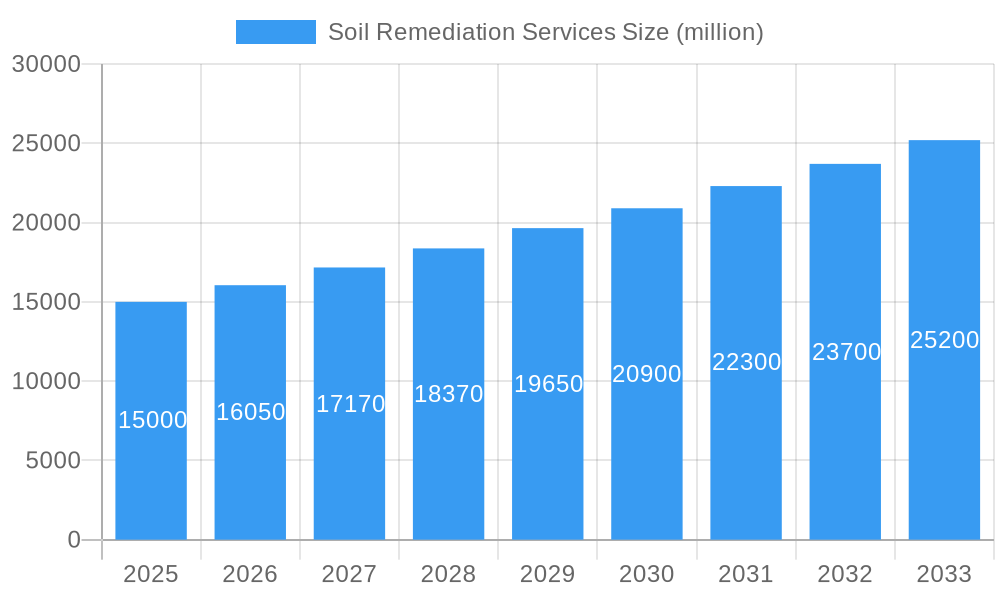
The global soil remediation services market is experiencing substantial growth, driven by increased industrialization-induced soil contamination, stringent environmental regulations, and heightened awareness of the health risks associated with polluted land. The market, valued at $11.34 billion in the 2025 base year, is projected to expand at a Compound Annual Growth Rate (CAGR) of 9.99% from 2025 to 2033. This expansion is fueled by the adoption of innovative and sustainable remediation technologies, supportive government initiatives for land management, and the redevelopment of brownfield sites. Challenges include the high cost of advanced remediation solutions and complex regulatory frameworks. The market is segmented by remediation techniques, application areas (industrial, residential, agricultural), and geographic regions, with key players actively driving advancements through technology and strategic collaborations.
Soil Remediation Services Market Size (In Billion)
The competitive landscape features a blend of established multinational corporations and specialized niche firms, indicating a dynamic and evolving market. While North America and Europe currently dominate due to robust environmental policies and industrial activity, the Asia-Pacific region is poised for rapid expansion driven by urbanization and industrial growth. Future market trajectory hinges on the continued development and adoption of efficient remediation technologies, favorable government policies, and increasing public consciousness regarding soil pollution. Research into emerging contaminants and novel treatment strategies is vital for sustained market development.
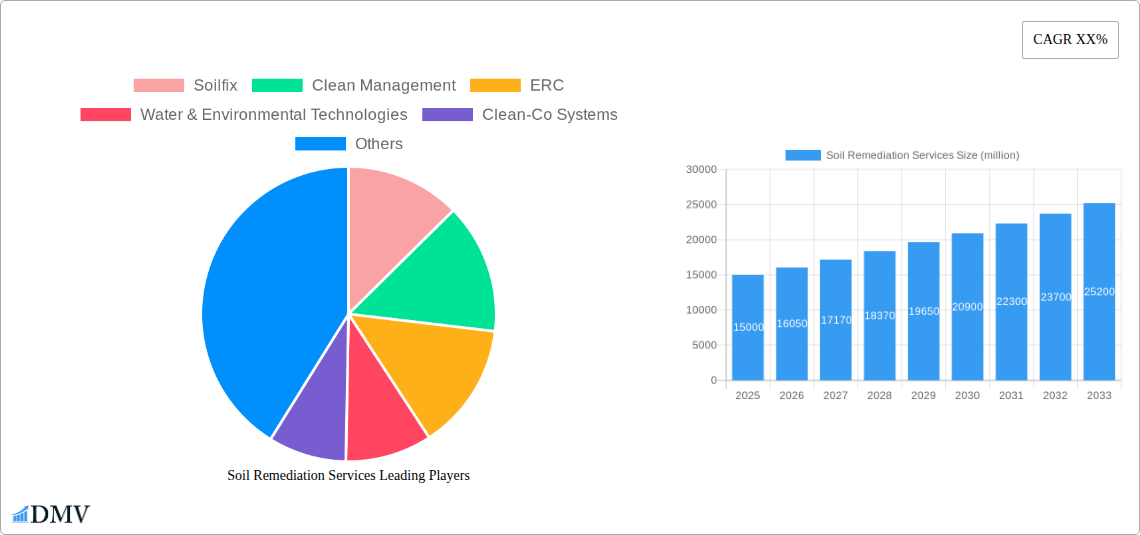
Soil Remediation Services Company Market Share
Global Soil Remediation Services Market Analysis: 2025-2033
This comprehensive report offers an in-depth analysis of the global soil remediation services market, providing critical insights for industry stakeholders. Covering the period from 2025 to 2033, with a base year of 2025, this report meticulously examines market dynamics, technological innovations, and key players influencing the sector's future. Leveraging extensive data analysis, the report projects a significant market valuation by 2033, highlighting lucrative opportunities for investors and industry leaders.
Soil Remediation Services Market Composition & Trends
This section delves into the competitive landscape of the soil remediation services market, analyzing market concentration, innovation, regulations, and M&A activity. The market exhibits a moderately concentrated structure, with leading players such as Soilfix, Clean Management, and ERC holding significant market share—collectively exceeding XX% in 2025. However, smaller, specialized firms like Greensum Ecology and Delta Remediation are making inroads with niche offerings.
Innovation is driven by stringent environmental regulations and the increasing demand for sustainable remediation solutions. The rise of bioremediation techniques and advancements in phytoremediation are significant catalysts. Substitute products, like landfilling, are losing ground due to their environmental impact and rising disposal costs. End-users comprise diverse sectors, including construction, manufacturing, and government agencies, with government projects accounting for approximately $XX million in 2025.
M&A activity has been notable, with several multi-million-dollar deals reported in the historical period (2019-2024). For example, the merger between [Company A] and [Company B] in 2022 was valued at approximately $XX million, consolidating market share and expertise.
- Market Share Distribution (2025): Soilfix (XX%), Clean Management (XX%), ERC (XX%), Others (XX%).
- M&A Deal Value (2019-2024): Total estimated value exceeding $XX million.
- Key Regulatory Drivers: EPA regulations (US), REACH (EU), and other regional environmental standards.
Soil Remediation Services Industry Evolution
The soil remediation services market has witnessed substantial growth, fueled by increasing environmental awareness and stricter regulations. The historical period (2019-2024) saw a Compound Annual Growth Rate (CAGR) of approximately XX%, driven by the rising demand for remediation services across various sectors. Technological advancements, such as the development of advanced in-situ remediation technologies and the wider adoption of bioremediation, have significantly boosted efficiency and reduced costs.
Consumer demand is shifting towards sustainable and environmentally friendly solutions, further propelling the adoption of innovative remediation technologies. The demand for transparent and accountable remediation practices is also increasing, leading to greater transparency and traceability within the industry. The forecast period (2025-2033) anticipates a CAGR of XX%, propelled by increasing government investments in infrastructure projects and ongoing industrial expansion, further elevating the demand for soil remediation. The market is expected to surpass $XX million by 2033.
Leading Regions, Countries, or Segments in Soil Remediation Services
North America currently dominates the global soil remediation services market, followed by Europe and Asia-Pacific. The US accounts for a significant share of the North American market, driven by stringent environmental regulations, robust industrial activity, and substantial government investments in infrastructure projects. Europe's strong regulatory framework and high environmental consciousness also contribute significantly to the region's robust market size.
- Key Drivers in North America: Stringent environmental regulations, substantial government funding for remediation projects, and extensive industrial activity.
- Key Drivers in Europe: Stringent environmental regulations, high environmental awareness among consumers, and significant investments in brownfield redevelopment projects.
- Key Drivers in Asia-Pacific: Rapid industrialization, increasing urbanization, and rising government investments in infrastructure projects.
The dominance of North America is attributed to factors like stringent environmental regulations, high industrial activity, and substantial government spending on environmental remediation projects. The region's well-established remediation industry, with numerous large and experienced firms, also contributes to its market leadership.
Soil Remediation Services Product Innovations
Recent innovations in soil remediation include advancements in bioremediation technologies, the development of more efficient and cost-effective in-situ remediation techniques, and the increased use of data analytics for improved site characterization and remediation planning. These advancements have led to faster remediation times, reduced costs, and minimized environmental impact. Unique selling propositions include enhanced efficiency, reduced remediation time, and environmentally friendly approaches.
Propelling Factors for Soil Remediation Services Growth
Several factors are driving market growth, including stringent environmental regulations globally demanding safer and cleaner sites; increasing industrialization and urbanization lead to higher contamination levels requiring remediation; rising government investments in infrastructure projects often necessitate soil remediation; technological advancements like bioremediation and in-situ techniques offer more efficient and cost-effective solutions.
Obstacles in the Soil Remediation Services Market
The soil remediation market faces challenges such as high remediation costs, the complexity of some contaminated sites, and lengthy regulatory approval processes. Supply chain disruptions can also affect the availability of materials and specialized equipment, while intense competition among firms requires constant innovation. These factors potentially impact profitability and project timelines, requiring strategic adaptation by market players.
Future Opportunities in Soil Remediation Services
Emerging opportunities lie in developing innovative and sustainable remediation technologies, expanding into new geographical markets with growing environmental concerns, and focusing on niche applications such as brownfield redevelopment and contaminated sediment remediation. Growing demand for cost-effective and environmentally friendly solutions creates further opportunities for technological advancement and market expansion.
Major Players in the Soil Remediation Services Ecosystem
- Soilfix
- Clean Management
- ERC
- Water & Environmental Technologies
- Clean-Co Systems
- GFL Environmental
- Greensum Ecology
- CG Environmental
- Delta Remediation
- Antea Group
- KERAMIDA
- UK Remediation
- Environmental Works
- Veolia
- Dowa Eco-system
- Triumvirate Environmental
- Polyeco Group
- Adler and Allan
- Cleanaway
- SOILUTIONS LTD
Key Developments in Soil Remediation Services Industry
- 2022 Q3: Clean Management acquires a smaller regional remediation firm, expanding its geographical reach.
- 2023 Q1: Launch of a new bioremediation technology by Soilfix, significantly reducing remediation time.
- 2024 Q2: Introduction of stricter regulations regarding soil remediation in the European Union.
Strategic Soil Remediation Services Market Forecast
The global soil remediation services market is poised for significant growth over the forecast period (2025-2033), driven by continued technological innovation, increasing environmental regulations, and rising government investments. The market's expansion into new geographical regions and application areas will also contribute to this growth, creating lucrative opportunities for existing and emerging players. The market is expected to reach $XX million by 2033.
Soil Remediation Services Segmentation
-
1. Application
- 1.1. Chemical Industry
- 1.2. Pharmaceutical Industry
- 1.3. Metallurgical Industry
- 1.4. Others
-
2. Types
- 2.1. Regional Services
- 2.2. Global Services
Soil Remediation Services Segmentation By Geography
-
1. North America
- 1.1. United States
- 1.2. Canada
- 1.3. Mexico
-
2. South America
- 2.1. Brazil
- 2.2. Argentina
- 2.3. Rest of South America
-
3. Europe
- 3.1. United Kingdom
- 3.2. Germany
- 3.3. France
- 3.4. Italy
- 3.5. Spain
- 3.6. Russia
- 3.7. Benelux
- 3.8. Nordics
- 3.9. Rest of Europe
-
4. Middle East & Africa
- 4.1. Turkey
- 4.2. Israel
- 4.3. GCC
- 4.4. North Africa
- 4.5. South Africa
- 4.6. Rest of Middle East & Africa
-
5. Asia Pacific
- 5.1. China
- 5.2. India
- 5.3. Japan
- 5.4. South Korea
- 5.5. ASEAN
- 5.6. Oceania
- 5.7. Rest of Asia Pacific

Soil Remediation Services Regional Market Share
Geographic Coverage of Soil Remediation Services
Soil Remediation Services REPORT HIGHLIGHTS
| Aspects | Details |
|---|---|
| Study Period | 2020-2034 |
| Base Year | 2025 |
| Estimated Year | 2026 |
| Forecast Period | 2026-2034 |
| Historical Period | 2020-2025 |
| Growth Rate | CAGR of 9.99% from 2020-2034 |
| Segmentation |
|
Table of Contents
- 1. Introduction
- 1.1. Research Scope
- 1.2. Market Segmentation
- 1.3. Research Methodology
- 1.4. Definitions and Assumptions
- 2. Executive Summary
- 2.1. Introduction
- 3. Market Dynamics
- 3.1. Introduction
- 3.2. Market Drivers
- 3.3. Market Restrains
- 3.4. Market Trends
- 4. Market Factor Analysis
- 4.1. Porters Five Forces
- 4.2. Supply/Value Chain
- 4.3. PESTEL analysis
- 4.4. Market Entropy
- 4.5. Patent/Trademark Analysis
- 5. Global Soil Remediation Services Analysis, Insights and Forecast, 2020-2032
- 5.1. Market Analysis, Insights and Forecast - by Application
- 5.1.1. Chemical Industry
- 5.1.2. Pharmaceutical Industry
- 5.1.3. Metallurgical Industry
- 5.1.4. Others
- 5.2. Market Analysis, Insights and Forecast - by Types
- 5.2.1. Regional Services
- 5.2.2. Global Services
- 5.3. Market Analysis, Insights and Forecast - by Region
- 5.3.1. North America
- 5.3.2. South America
- 5.3.3. Europe
- 5.3.4. Middle East & Africa
- 5.3.5. Asia Pacific
- 5.1. Market Analysis, Insights and Forecast - by Application
- 6. North America Soil Remediation Services Analysis, Insights and Forecast, 2020-2032
- 6.1. Market Analysis, Insights and Forecast - by Application
- 6.1.1. Chemical Industry
- 6.1.2. Pharmaceutical Industry
- 6.1.3. Metallurgical Industry
- 6.1.4. Others
- 6.2. Market Analysis, Insights and Forecast - by Types
- 6.2.1. Regional Services
- 6.2.2. Global Services
- 6.1. Market Analysis, Insights and Forecast - by Application
- 7. South America Soil Remediation Services Analysis, Insights and Forecast, 2020-2032
- 7.1. Market Analysis, Insights and Forecast - by Application
- 7.1.1. Chemical Industry
- 7.1.2. Pharmaceutical Industry
- 7.1.3. Metallurgical Industry
- 7.1.4. Others
- 7.2. Market Analysis, Insights and Forecast - by Types
- 7.2.1. Regional Services
- 7.2.2. Global Services
- 7.1. Market Analysis, Insights and Forecast - by Application
- 8. Europe Soil Remediation Services Analysis, Insights and Forecast, 2020-2032
- 8.1. Market Analysis, Insights and Forecast - by Application
- 8.1.1. Chemical Industry
- 8.1.2. Pharmaceutical Industry
- 8.1.3. Metallurgical Industry
- 8.1.4. Others
- 8.2. Market Analysis, Insights and Forecast - by Types
- 8.2.1. Regional Services
- 8.2.2. Global Services
- 8.1. Market Analysis, Insights and Forecast - by Application
- 9. Middle East & Africa Soil Remediation Services Analysis, Insights and Forecast, 2020-2032
- 9.1. Market Analysis, Insights and Forecast - by Application
- 9.1.1. Chemical Industry
- 9.1.2. Pharmaceutical Industry
- 9.1.3. Metallurgical Industry
- 9.1.4. Others
- 9.2. Market Analysis, Insights and Forecast - by Types
- 9.2.1. Regional Services
- 9.2.2. Global Services
- 9.1. Market Analysis, Insights and Forecast - by Application
- 10. Asia Pacific Soil Remediation Services Analysis, Insights and Forecast, 2020-2032
- 10.1. Market Analysis, Insights and Forecast - by Application
- 10.1.1. Chemical Industry
- 10.1.2. Pharmaceutical Industry
- 10.1.3. Metallurgical Industry
- 10.1.4. Others
- 10.2. Market Analysis, Insights and Forecast - by Types
- 10.2.1. Regional Services
- 10.2.2. Global Services
- 10.1. Market Analysis, Insights and Forecast - by Application
- 11. Competitive Analysis
- 11.1. Global Market Share Analysis 2025
- 11.2. Company Profiles
- 11.2.1 Soilfix
- 11.2.1.1. Overview
- 11.2.1.2. Products
- 11.2.1.3. SWOT Analysis
- 11.2.1.4. Recent Developments
- 11.2.1.5. Financials (Based on Availability)
- 11.2.2 Clean Management
- 11.2.2.1. Overview
- 11.2.2.2. Products
- 11.2.2.3. SWOT Analysis
- 11.2.2.4. Recent Developments
- 11.2.2.5. Financials (Based on Availability)
- 11.2.3 ERC
- 11.2.3.1. Overview
- 11.2.3.2. Products
- 11.2.3.3. SWOT Analysis
- 11.2.3.4. Recent Developments
- 11.2.3.5. Financials (Based on Availability)
- 11.2.4 Water & Environmental Technologies
- 11.2.4.1. Overview
- 11.2.4.2. Products
- 11.2.4.3. SWOT Analysis
- 11.2.4.4. Recent Developments
- 11.2.4.5. Financials (Based on Availability)
- 11.2.5 Clean-Co Systems
- 11.2.5.1. Overview
- 11.2.5.2. Products
- 11.2.5.3. SWOT Analysis
- 11.2.5.4. Recent Developments
- 11.2.5.5. Financials (Based on Availability)
- 11.2.6 GFL
- 11.2.6.1. Overview
- 11.2.6.2. Products
- 11.2.6.3. SWOT Analysis
- 11.2.6.4. Recent Developments
- 11.2.6.5. Financials (Based on Availability)
- 11.2.7 Greensum Ecology
- 11.2.7.1. Overview
- 11.2.7.2. Products
- 11.2.7.3. SWOT Analysis
- 11.2.7.4. Recent Developments
- 11.2.7.5. Financials (Based on Availability)
- 11.2.8 CG Environmental
- 11.2.8.1. Overview
- 11.2.8.2. Products
- 11.2.8.3. SWOT Analysis
- 11.2.8.4. Recent Developments
- 11.2.8.5. Financials (Based on Availability)
- 11.2.9 Delta Remediation
- 11.2.9.1. Overview
- 11.2.9.2. Products
- 11.2.9.3. SWOT Analysis
- 11.2.9.4. Recent Developments
- 11.2.9.5. Financials (Based on Availability)
- 11.2.10 Antea Group
- 11.2.10.1. Overview
- 11.2.10.2. Products
- 11.2.10.3. SWOT Analysis
- 11.2.10.4. Recent Developments
- 11.2.10.5. Financials (Based on Availability)
- 11.2.11 KERAMIDA
- 11.2.11.1. Overview
- 11.2.11.2. Products
- 11.2.11.3. SWOT Analysis
- 11.2.11.4. Recent Developments
- 11.2.11.5. Financials (Based on Availability)
- 11.2.12 UK Remediation
- 11.2.12.1. Overview
- 11.2.12.2. Products
- 11.2.12.3. SWOT Analysis
- 11.2.12.4. Recent Developments
- 11.2.12.5. Financials (Based on Availability)
- 11.2.13 Environmental Works
- 11.2.13.1. Overview
- 11.2.13.2. Products
- 11.2.13.3. SWOT Analysis
- 11.2.13.4. Recent Developments
- 11.2.13.5. Financials (Based on Availability)
- 11.2.14 Veolia
- 11.2.14.1. Overview
- 11.2.14.2. Products
- 11.2.14.3. SWOT Analysis
- 11.2.14.4. Recent Developments
- 11.2.14.5. Financials (Based on Availability)
- 11.2.15 Dowa Eco-system
- 11.2.15.1. Overview
- 11.2.15.2. Products
- 11.2.15.3. SWOT Analysis
- 11.2.15.4. Recent Developments
- 11.2.15.5. Financials (Based on Availability)
- 11.2.16 Triumvirate
- 11.2.16.1. Overview
- 11.2.16.2. Products
- 11.2.16.3. SWOT Analysis
- 11.2.16.4. Recent Developments
- 11.2.16.5. Financials (Based on Availability)
- 11.2.17 Polyeco Group
- 11.2.17.1. Overview
- 11.2.17.2. Products
- 11.2.17.3. SWOT Analysis
- 11.2.17.4. Recent Developments
- 11.2.17.5. Financials (Based on Availability)
- 11.2.18 Adler
- 11.2.18.1. Overview
- 11.2.18.2. Products
- 11.2.18.3. SWOT Analysis
- 11.2.18.4. Recent Developments
- 11.2.18.5. Financials (Based on Availability)
- 11.2.19 Cleanaway
- 11.2.19.1. Overview
- 11.2.19.2. Products
- 11.2.19.3. SWOT Analysis
- 11.2.19.4. Recent Developments
- 11.2.19.5. Financials (Based on Availability)
- 11.2.20 SOILUTIONS LTD
- 11.2.20.1. Overview
- 11.2.20.2. Products
- 11.2.20.3. SWOT Analysis
- 11.2.20.4. Recent Developments
- 11.2.20.5. Financials (Based on Availability)
- 11.2.1 Soilfix
List of Figures
- Figure 1: Global Soil Remediation Services Revenue Breakdown (billion, %) by Region 2025 & 2033
- Figure 2: North America Soil Remediation Services Revenue (billion), by Application 2025 & 2033
- Figure 3: North America Soil Remediation Services Revenue Share (%), by Application 2025 & 2033
- Figure 4: North America Soil Remediation Services Revenue (billion), by Types 2025 & 2033
- Figure 5: North America Soil Remediation Services Revenue Share (%), by Types 2025 & 2033
- Figure 6: North America Soil Remediation Services Revenue (billion), by Country 2025 & 2033
- Figure 7: North America Soil Remediation Services Revenue Share (%), by Country 2025 & 2033
- Figure 8: South America Soil Remediation Services Revenue (billion), by Application 2025 & 2033
- Figure 9: South America Soil Remediation Services Revenue Share (%), by Application 2025 & 2033
- Figure 10: South America Soil Remediation Services Revenue (billion), by Types 2025 & 2033
- Figure 11: South America Soil Remediation Services Revenue Share (%), by Types 2025 & 2033
- Figure 12: South America Soil Remediation Services Revenue (billion), by Country 2025 & 2033
- Figure 13: South America Soil Remediation Services Revenue Share (%), by Country 2025 & 2033
- Figure 14: Europe Soil Remediation Services Revenue (billion), by Application 2025 & 2033
- Figure 15: Europe Soil Remediation Services Revenue Share (%), by Application 2025 & 2033
- Figure 16: Europe Soil Remediation Services Revenue (billion), by Types 2025 & 2033
- Figure 17: Europe Soil Remediation Services Revenue Share (%), by Types 2025 & 2033
- Figure 18: Europe Soil Remediation Services Revenue (billion), by Country 2025 & 2033
- Figure 19: Europe Soil Remediation Services Revenue Share (%), by Country 2025 & 2033
- Figure 20: Middle East & Africa Soil Remediation Services Revenue (billion), by Application 2025 & 2033
- Figure 21: Middle East & Africa Soil Remediation Services Revenue Share (%), by Application 2025 & 2033
- Figure 22: Middle East & Africa Soil Remediation Services Revenue (billion), by Types 2025 & 2033
- Figure 23: Middle East & Africa Soil Remediation Services Revenue Share (%), by Types 2025 & 2033
- Figure 24: Middle East & Africa Soil Remediation Services Revenue (billion), by Country 2025 & 2033
- Figure 25: Middle East & Africa Soil Remediation Services Revenue Share (%), by Country 2025 & 2033
- Figure 26: Asia Pacific Soil Remediation Services Revenue (billion), by Application 2025 & 2033
- Figure 27: Asia Pacific Soil Remediation Services Revenue Share (%), by Application 2025 & 2033
- Figure 28: Asia Pacific Soil Remediation Services Revenue (billion), by Types 2025 & 2033
- Figure 29: Asia Pacific Soil Remediation Services Revenue Share (%), by Types 2025 & 2033
- Figure 30: Asia Pacific Soil Remediation Services Revenue (billion), by Country 2025 & 2033
- Figure 31: Asia Pacific Soil Remediation Services Revenue Share (%), by Country 2025 & 2033
List of Tables
- Table 1: Global Soil Remediation Services Revenue billion Forecast, by Application 2020 & 2033
- Table 2: Global Soil Remediation Services Revenue billion Forecast, by Types 2020 & 2033
- Table 3: Global Soil Remediation Services Revenue billion Forecast, by Region 2020 & 2033
- Table 4: Global Soil Remediation Services Revenue billion Forecast, by Application 2020 & 2033
- Table 5: Global Soil Remediation Services Revenue billion Forecast, by Types 2020 & 2033
- Table 6: Global Soil Remediation Services Revenue billion Forecast, by Country 2020 & 2033
- Table 7: United States Soil Remediation Services Revenue (billion) Forecast, by Application 2020 & 2033
- Table 8: Canada Soil Remediation Services Revenue (billion) Forecast, by Application 2020 & 2033
- Table 9: Mexico Soil Remediation Services Revenue (billion) Forecast, by Application 2020 & 2033
- Table 10: Global Soil Remediation Services Revenue billion Forecast, by Application 2020 & 2033
- Table 11: Global Soil Remediation Services Revenue billion Forecast, by Types 2020 & 2033
- Table 12: Global Soil Remediation Services Revenue billion Forecast, by Country 2020 & 2033
- Table 13: Brazil Soil Remediation Services Revenue (billion) Forecast, by Application 2020 & 2033
- Table 14: Argentina Soil Remediation Services Revenue (billion) Forecast, by Application 2020 & 2033
- Table 15: Rest of South America Soil Remediation Services Revenue (billion) Forecast, by Application 2020 & 2033
- Table 16: Global Soil Remediation Services Revenue billion Forecast, by Application 2020 & 2033
- Table 17: Global Soil Remediation Services Revenue billion Forecast, by Types 2020 & 2033
- Table 18: Global Soil Remediation Services Revenue billion Forecast, by Country 2020 & 2033
- Table 19: United Kingdom Soil Remediation Services Revenue (billion) Forecast, by Application 2020 & 2033
- Table 20: Germany Soil Remediation Services Revenue (billion) Forecast, by Application 2020 & 2033
- Table 21: France Soil Remediation Services Revenue (billion) Forecast, by Application 2020 & 2033
- Table 22: Italy Soil Remediation Services Revenue (billion) Forecast, by Application 2020 & 2033
- Table 23: Spain Soil Remediation Services Revenue (billion) Forecast, by Application 2020 & 2033
- Table 24: Russia Soil Remediation Services Revenue (billion) Forecast, by Application 2020 & 2033
- Table 25: Benelux Soil Remediation Services Revenue (billion) Forecast, by Application 2020 & 2033
- Table 26: Nordics Soil Remediation Services Revenue (billion) Forecast, by Application 2020 & 2033
- Table 27: Rest of Europe Soil Remediation Services Revenue (billion) Forecast, by Application 2020 & 2033
- Table 28: Global Soil Remediation Services Revenue billion Forecast, by Application 2020 & 2033
- Table 29: Global Soil Remediation Services Revenue billion Forecast, by Types 2020 & 2033
- Table 30: Global Soil Remediation Services Revenue billion Forecast, by Country 2020 & 2033
- Table 31: Turkey Soil Remediation Services Revenue (billion) Forecast, by Application 2020 & 2033
- Table 32: Israel Soil Remediation Services Revenue (billion) Forecast, by Application 2020 & 2033
- Table 33: GCC Soil Remediation Services Revenue (billion) Forecast, by Application 2020 & 2033
- Table 34: North Africa Soil Remediation Services Revenue (billion) Forecast, by Application 2020 & 2033
- Table 35: South Africa Soil Remediation Services Revenue (billion) Forecast, by Application 2020 & 2033
- Table 36: Rest of Middle East & Africa Soil Remediation Services Revenue (billion) Forecast, by Application 2020 & 2033
- Table 37: Global Soil Remediation Services Revenue billion Forecast, by Application 2020 & 2033
- Table 38: Global Soil Remediation Services Revenue billion Forecast, by Types 2020 & 2033
- Table 39: Global Soil Remediation Services Revenue billion Forecast, by Country 2020 & 2033
- Table 40: China Soil Remediation Services Revenue (billion) Forecast, by Application 2020 & 2033
- Table 41: India Soil Remediation Services Revenue (billion) Forecast, by Application 2020 & 2033
- Table 42: Japan Soil Remediation Services Revenue (billion) Forecast, by Application 2020 & 2033
- Table 43: South Korea Soil Remediation Services Revenue (billion) Forecast, by Application 2020 & 2033
- Table 44: ASEAN Soil Remediation Services Revenue (billion) Forecast, by Application 2020 & 2033
- Table 45: Oceania Soil Remediation Services Revenue (billion) Forecast, by Application 2020 & 2033
- Table 46: Rest of Asia Pacific Soil Remediation Services Revenue (billion) Forecast, by Application 2020 & 2033
Frequently Asked Questions
1. What is the projected Compound Annual Growth Rate (CAGR) of the Soil Remediation Services?
The projected CAGR is approximately 9.99%.
2. Which companies are prominent players in the Soil Remediation Services?
Key companies in the market include Soilfix, Clean Management, ERC, Water & Environmental Technologies, Clean-Co Systems, GFL, Greensum Ecology, CG Environmental, Delta Remediation, Antea Group, KERAMIDA, UK Remediation, Environmental Works, Veolia, Dowa Eco-system, Triumvirate, Polyeco Group, Adler, Cleanaway, SOILUTIONS LTD.
3. What are the main segments of the Soil Remediation Services?
The market segments include Application, Types.
4. Can you provide details about the market size?
The market size is estimated to be USD 11.34 billion as of 2022.
5. What are some drivers contributing to market growth?
N/A
6. What are the notable trends driving market growth?
N/A
7. Are there any restraints impacting market growth?
N/A
8. Can you provide examples of recent developments in the market?
N/A
9. What pricing options are available for accessing the report?
Pricing options include single-user, multi-user, and enterprise licenses priced at USD 3950.00, USD 5925.00, and USD 7900.00 respectively.
10. Is the market size provided in terms of value or volume?
The market size is provided in terms of value, measured in billion.
11. Are there any specific market keywords associated with the report?
Yes, the market keyword associated with the report is "Soil Remediation Services," which aids in identifying and referencing the specific market segment covered.
12. How do I determine which pricing option suits my needs best?
The pricing options vary based on user requirements and access needs. Individual users may opt for single-user licenses, while businesses requiring broader access may choose multi-user or enterprise licenses for cost-effective access to the report.
13. Are there any additional resources or data provided in the Soil Remediation Services report?
While the report offers comprehensive insights, it's advisable to review the specific contents or supplementary materials provided to ascertain if additional resources or data are available.
14. How can I stay updated on further developments or reports in the Soil Remediation Services?
To stay informed about further developments, trends, and reports in the Soil Remediation Services, consider subscribing to industry newsletters, following relevant companies and organizations, or regularly checking reputable industry news sources and publications.
Methodology
Step 1 - Identification of Relevant Samples Size from Population Database


Step 2 - Approaches for Defining Global Market Size (Value, Volume* & Price*)

Note*: In applicable scenarios
Step 3 - Data Sources
Primary Research
- Web Analytics
- Survey Reports
- Research Institute
- Latest Research Reports
- Opinion Leaders
Secondary Research
- Annual Reports
- White Paper
- Latest Press Release
- Industry Association
- Paid Database
- Investor Presentations

Step 4 - Data Triangulation
Involves using different sources of information in order to increase the validity of a study
These sources are likely to be stakeholders in a program - participants, other researchers, program staff, other community members, and so on.
Then we put all data in single framework & apply various statistical tools to find out the dynamic on the market.
During the analysis stage, feedback from the stakeholder groups would be compared to determine areas of agreement as well as areas of divergence