

Key Insights
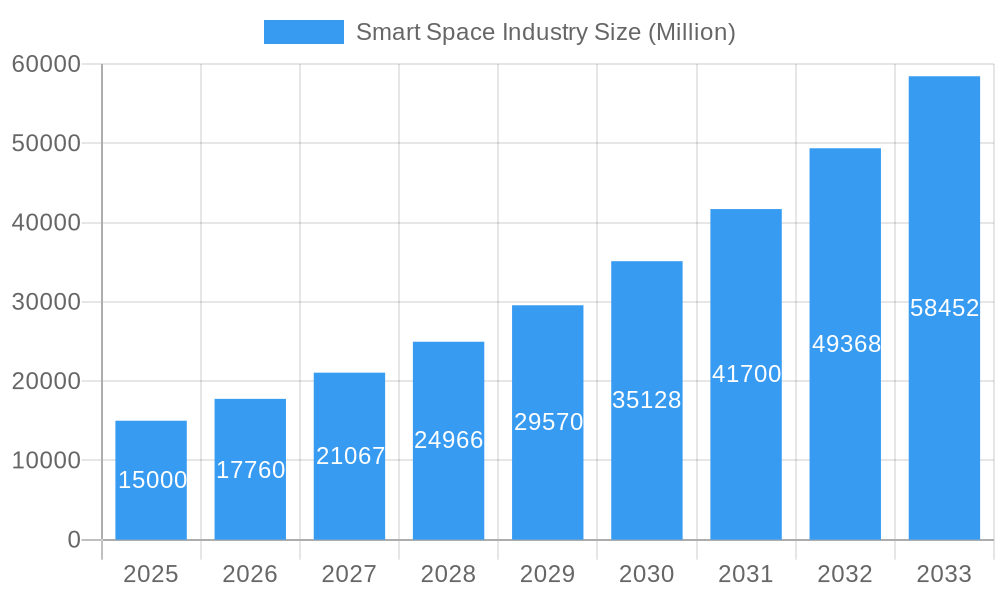
The Smart Space market, integrating solutions and services for commercial and residential applications, is poised for substantial expansion. Projected to reach $17.85 billion by 2025, the market is set to grow at a Compound Annual Growth Rate (CAGR) of 11.9% from 2025 to 2033. Key growth drivers include the increasing adoption of Internet of Things (IoT) devices, advancements in smart building technologies emphasizing energy efficiency and sustainability, and the escalating demand for enhanced security and operational efficiency across diverse sectors. Innovations in artificial intelligence (AI) and machine learning (ML) are enabling more sophisticated smart space solutions, delivering real-time insights and predictive analytics for optimized resource management and superior user experiences. Market segmentation caters to both commercial and residential needs, highlighting the broad applicability within this evolving industry. Leading companies such as ICONICS, ABB, Microsoft, Cisco, and Siemens are instrumental in shaping the market through continuous innovation and strategic alliances.
Smart Space Industry Market Size (In Billion)
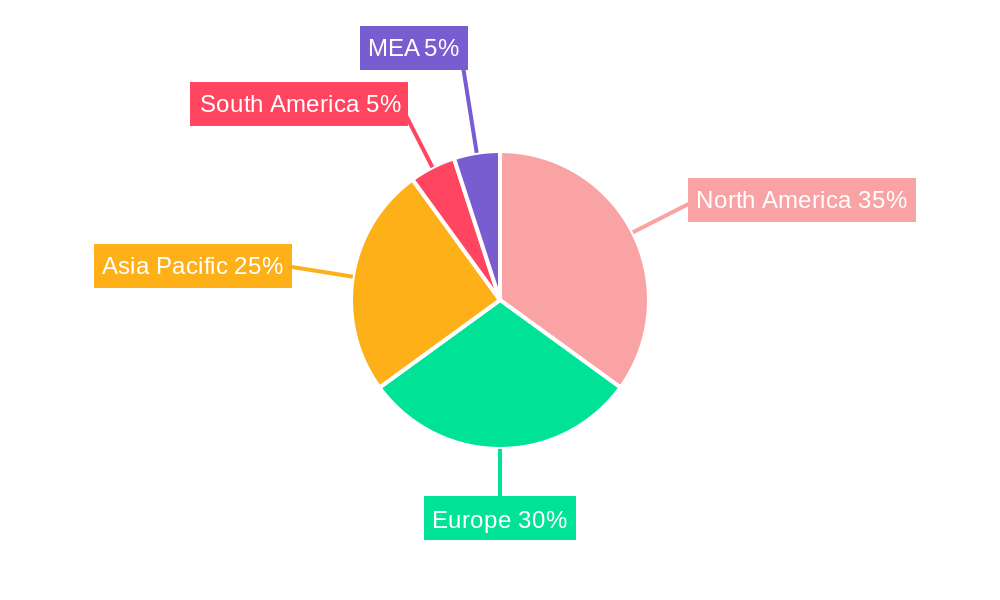
Geographically, the Smart Space market is prominently led by North America, followed by Europe and the Asia-Pacific region. North America's leadership stems from early smart technology adoption and advanced technological infrastructure. However, the Asia-Pacific region is anticipated to experience rapid growth, fueled by urbanization and significant infrastructure investments. Europe remains a key market, supported by government initiatives for smart city development and a focus on sustainability. The competitive landscape is characterized by intense rivalry among established technology corporations and specialized smart space providers, fostering continuous innovation and competitive pricing, ultimately benefiting consumers with a wide array of advanced solutions.
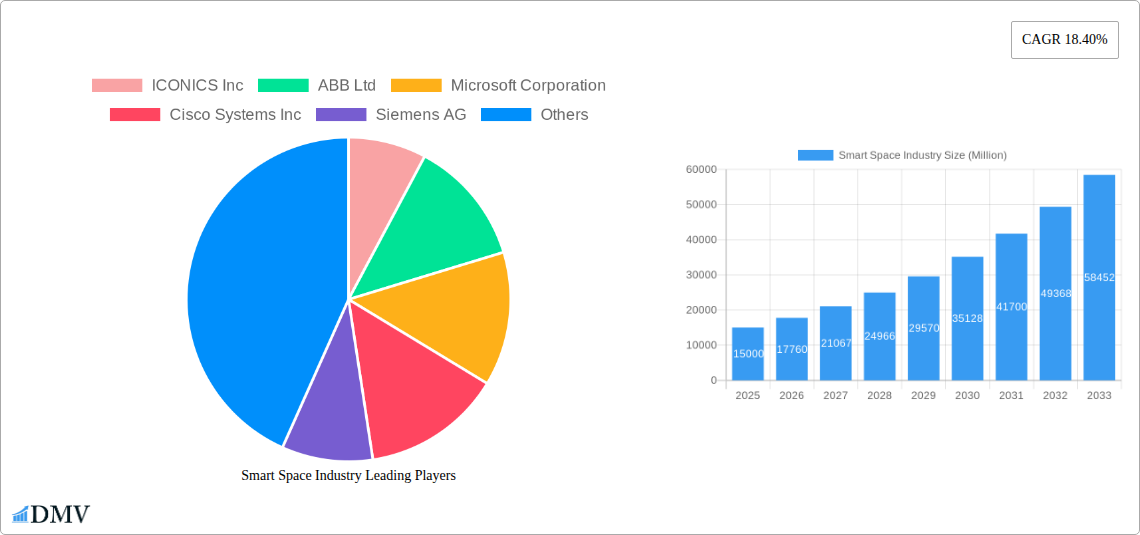
Smart Space Industry Company Market Share
Smart Space Industry Market Report: 2019-2033 Forecast
This comprehensive report provides a detailed analysis of the Smart Space industry, projecting a market valuation exceeding $XX Million by 2033. It offers invaluable insights for stakeholders, investors, and industry professionals seeking to navigate this rapidly evolving landscape. The report covers the period from 2019 to 2033, with a base year of 2025 and a forecast period spanning 2025 to 2033.
Smart Space Industry Market Composition & Trends
The Smart Space market, valued at $XX Million in 2025, exhibits a moderately consolidated structure. Key players like ICONICS Inc, ABB Ltd, Microsoft Corporation, Cisco Systems Inc, Siemens AG, Hitachi Vantara Corporation, SmartSpace Software PLC, Ubisense Limited, Spacewell Faseas (Nemetschek Group), and Adappt Intelligence Inc. hold significant market share, although the precise distribution remains dynamic due to ongoing mergers and acquisitions (M&A). Innovation in areas such as AI-powered space management, IoT integration, and advanced analytics are key drivers. Regulatory landscapes vary significantly across regions, impacting adoption rates. Substitute products, such as traditional building management systems, face increasing competition from the enhanced capabilities of smart space solutions. End-user profiles are diverse, encompassing commercial, residential, and industrial sectors. M&A activity has been robust, with deal values exceeding $XX Million in the past five years, primarily driven by strategic acquisitions aimed at expanding technological capabilities and market reach.
- Market Concentration: Moderately consolidated, with a few major players dominating.
- Innovation Catalysts: AI, IoT, advanced analytics.
- Regulatory Landscape: Regionally diverse, impacting adoption.
- Substitute Products: Traditional building management systems.
- End-User Profiles: Commercial, residential, industrial.
- M&A Activity: Significant activity, with deal values exceeding $XX Million (2019-2024).
Smart Space Industry Industry Evolution
From 2019 to 2024, the Smart Space industry witnessed a Compound Annual Growth Rate (CAGR) of XX%. This growth is fueled by the increasing adoption of smart technologies across various sectors and the rising demand for efficient and sustainable space management solutions. Technological advancements, particularly in areas like edge computing and 5G connectivity, are enabling more sophisticated and integrated smart space applications. Consumer demand is shifting towards personalized and data-driven experiences, driving innovation in areas such as personalized climate control, predictive maintenance, and enhanced security features. The market is expected to maintain a strong growth trajectory in the forecast period (2025-2033), with a projected CAGR of XX%, reaching $XX Million by 2033. Adoption rates are increasing across all end-user segments, with the commercial sector showing particularly strong growth.
Leading Regions, Countries, or Segments in Smart Space Industry
North America currently holds the leading position in the Smart Space market, driven by high technology adoption rates, significant investments in smart city initiatives, and robust regulatory support for smart building technologies. The commercial sector dominates the market in terms of revenue generation, followed by the industrial sector. Solutions represent a larger market segment compared to services due to the high initial investment in smart space infrastructure.
Key Drivers (North America):
- High technology adoption rates.
- Substantial investments in smart city initiatives.
- Supportive regulatory frameworks.
Commercial Sector Dominance: Driven by the need for enhanced operational efficiency and cost savings.
Solutions Segment Leadership: Higher initial investment in smart space infrastructure.
Smart Space Industry Product Innovations
Recent innovations include AI-powered predictive maintenance systems that optimize energy consumption and reduce downtime, advanced sensor networks providing real-time environmental data, and integrated security systems leveraging facial recognition and biometric authentication. These innovations offer unique selling propositions like improved operational efficiency, enhanced security, and increased sustainability. The integration of these technologies into seamless platforms is a key trend driving market growth.
Propelling Factors for Smart Space Industry Growth
Technological advancements, particularly in IoT, AI, and 5G, are key drivers of growth. The increasing demand for improved operational efficiency and reduced costs in various sectors fuels market expansion. Government regulations and incentives promoting sustainable buildings and smart city initiatives further accelerate growth. For example, tax breaks for smart building installations in several countries are boosting adoption.
Obstacles in the Smart Space Industry Market
High initial investment costs, complex integration processes, and cybersecurity concerns can hinder adoption. Supply chain disruptions can impact the availability of critical components. Intense competition from established players and new entrants also presents a significant challenge. These factors contribute to a slower than anticipated growth in some regions.
Future Opportunities in Smart Space Industry
Emerging opportunities lie in expanding into new markets, particularly in developing economies, and exploring new applications in areas like healthcare and education. Advancements in technologies like edge computing and AI present exciting possibilities for enhanced functionalities and improved user experiences. The integration of smart space solutions with other smart technologies, creating interconnected ecosystems, represents a significant growth area.
Major Players in the Smart Space Industry Ecosystem
- ICONICS Inc
- ABB Ltd
- Microsoft Corporation
- Cisco Systems Inc
- Siemens AG
- Hitachi Vantara Corporation
- SmartSpace Software PLC
- Ubisense Limited
- Spacewell Faseas (Nemetschek Group)
- Adappt Intelligence Inc
Key Developments in Smart Space Industry Industry
- 2022 Q4: Microsoft announces Azure-based Smart Building solutions.
- 2023 Q1: ICONICS launches new AI-powered space management platform.
- 2023 Q2: Strategic partnership between ABB and Siemens for integrated smart building solutions.
Strategic Smart Space Industry Market Forecast
The Smart Space industry is poised for robust growth, driven by technological advancements, increasing demand for efficient space management, and supportive regulatory frameworks. The market's potential is vast, with significant opportunities in new markets and applications. Continued innovation and strategic partnerships will shape the industry's future, leading to a significant expansion of the smart space market in the coming years.
Smart Space Industry Segmentation
-
1. Type
- 1.1. Solutions
- 1.2. Services
-
2. End-user Industry
- 2.1. Commercial
- 2.2. Residential
Smart Space Industry Segmentation By Geography
- 1. North America
- 2. Europe
- 3. Asia Pacific
- 4. Latin America
- 5. Middle East
Smart Space Industry Regional Market Share
Geographic Coverage of Smart Space Industry
Smart Space Industry REPORT HIGHLIGHTS
| Aspects | Details |
|---|---|
| Study Period | 2020-2034 |
| Base Year | 2025 |
| Estimated Year | 2026 |
| Forecast Period | 2026-2034 |
| Historical Period | 2020-2025 |
| Growth Rate | CAGR of 11.9% from 2020-2034 |
| Segmentation |
|
Table of Contents
- 1. Introduction
- 1.1. Research Scope
- 1.2. Market Segmentation
- 1.3. Research Methodology
- 1.4. Definitions and Assumptions
- 2. Executive Summary
- 2.1. Introduction
- 3. Market Dynamics
- 3.1. Introduction
- 3.2. Market Drivers
- 3.2.1. ; Increasing Adoption of IoT; Increasing Urban Population
- 3.3. Market Restrains
- 3.3.1. ; High Initial Infrastructure Expenditure
- 3.4. Market Trends
- 3.4.1. Commercial Segment Estimated to Hold the Largest Market Share
- 4. Market Factor Analysis
- 4.1. Porters Five Forces
- 4.2. Supply/Value Chain
- 4.3. PESTEL analysis
- 4.4. Market Entropy
- 4.5. Patent/Trademark Analysis
- 5. Global Smart Space Industry Analysis, Insights and Forecast, 2020-2032
- 5.1. Market Analysis, Insights and Forecast - by Type
- 5.1.1. Solutions
- 5.1.2. Services
- 5.2. Market Analysis, Insights and Forecast - by End-user Industry
- 5.2.1. Commercial
- 5.2.2. Residential
- 5.3. Market Analysis, Insights and Forecast - by Region
- 5.3.1. North America
- 5.3.2. Europe
- 5.3.3. Asia Pacific
- 5.3.4. Latin America
- 5.3.5. Middle East
- 5.1. Market Analysis, Insights and Forecast - by Type
- 6. North America Smart Space Industry Analysis, Insights and Forecast, 2020-2032
- 6.1. Market Analysis, Insights and Forecast - by Type
- 6.1.1. Solutions
- 6.1.2. Services
- 6.2. Market Analysis, Insights and Forecast - by End-user Industry
- 6.2.1. Commercial
- 6.2.2. Residential
- 6.1. Market Analysis, Insights and Forecast - by Type
- 7. Europe Smart Space Industry Analysis, Insights and Forecast, 2020-2032
- 7.1. Market Analysis, Insights and Forecast - by Type
- 7.1.1. Solutions
- 7.1.2. Services
- 7.2. Market Analysis, Insights and Forecast - by End-user Industry
- 7.2.1. Commercial
- 7.2.2. Residential
- 7.1. Market Analysis, Insights and Forecast - by Type
- 8. Asia Pacific Smart Space Industry Analysis, Insights and Forecast, 2020-2032
- 8.1. Market Analysis, Insights and Forecast - by Type
- 8.1.1. Solutions
- 8.1.2. Services
- 8.2. Market Analysis, Insights and Forecast - by End-user Industry
- 8.2.1. Commercial
- 8.2.2. Residential
- 8.1. Market Analysis, Insights and Forecast - by Type
- 9. Latin America Smart Space Industry Analysis, Insights and Forecast, 2020-2032
- 9.1. Market Analysis, Insights and Forecast - by Type
- 9.1.1. Solutions
- 9.1.2. Services
- 9.2. Market Analysis, Insights and Forecast - by End-user Industry
- 9.2.1. Commercial
- 9.2.2. Residential
- 9.1. Market Analysis, Insights and Forecast - by Type
- 10. Middle East Smart Space Industry Analysis, Insights and Forecast, 2020-2032
- 10.1. Market Analysis, Insights and Forecast - by Type
- 10.1.1. Solutions
- 10.1.2. Services
- 10.2. Market Analysis, Insights and Forecast - by End-user Industry
- 10.2.1. Commercial
- 10.2.2. Residential
- 10.1. Market Analysis, Insights and Forecast - by Type
- 11. Competitive Analysis
- 11.1. Global Market Share Analysis 2025
- 11.2. Company Profiles
- 11.2.1 ICONICS Inc
- 11.2.1.1. Overview
- 11.2.1.2. Products
- 11.2.1.3. SWOT Analysis
- 11.2.1.4. Recent Developments
- 11.2.1.5. Financials (Based on Availability)
- 11.2.2 ABB Ltd
- 11.2.2.1. Overview
- 11.2.2.2. Products
- 11.2.2.3. SWOT Analysis
- 11.2.2.4. Recent Developments
- 11.2.2.5. Financials (Based on Availability)
- 11.2.3 Microsoft Corporation
- 11.2.3.1. Overview
- 11.2.3.2. Products
- 11.2.3.3. SWOT Analysis
- 11.2.3.4. Recent Developments
- 11.2.3.5. Financials (Based on Availability)
- 11.2.4 Cisco Systems Inc
- 11.2.4.1. Overview
- 11.2.4.2. Products
- 11.2.4.3. SWOT Analysis
- 11.2.4.4. Recent Developments
- 11.2.4.5. Financials (Based on Availability)
- 11.2.5 Siemens AG
- 11.2.5.1. Overview
- 11.2.5.2. Products
- 11.2.5.3. SWOT Analysis
- 11.2.5.4. Recent Developments
- 11.2.5.5. Financials (Based on Availability)
- 11.2.6 Hitachi Vantara Corporation
- 11.2.6.1. Overview
- 11.2.6.2. Products
- 11.2.6.3. SWOT Analysis
- 11.2.6.4. Recent Developments
- 11.2.6.5. Financials (Based on Availability)
- 11.2.7 SmartSpace Software PLC
- 11.2.7.1. Overview
- 11.2.7.2. Products
- 11.2.7.3. SWOT Analysis
- 11.2.7.4. Recent Developments
- 11.2.7.5. Financials (Based on Availability)
- 11.2.8 Ubisense Limited
- 11.2.8.1. Overview
- 11.2.8.2. Products
- 11.2.8.3. SWOT Analysis
- 11.2.8.4. Recent Developments
- 11.2.8.5. Financials (Based on Availability)
- 11.2.9 Spacewell Faseas (Nemetschek Group)
- 11.2.9.1. Overview
- 11.2.9.2. Products
- 11.2.9.3. SWOT Analysis
- 11.2.9.4. Recent Developments
- 11.2.9.5. Financials (Based on Availability)
- 11.2.10 Adappt Intelligence Inc
- 11.2.10.1. Overview
- 11.2.10.2. Products
- 11.2.10.3. SWOT Analysis
- 11.2.10.4. Recent Developments
- 11.2.10.5. Financials (Based on Availability)
- 11.2.1 ICONICS Inc
List of Figures
- Figure 1: Global Smart Space Industry Revenue Breakdown (billion, %) by Region 2025 & 2033
- Figure 2: Global Smart Space Industry Volume Breakdown (K Unit, %) by Region 2025 & 2033
- Figure 3: North America Smart Space Industry Revenue (billion), by Type 2025 & 2033
- Figure 4: North America Smart Space Industry Volume (K Unit), by Type 2025 & 2033
- Figure 5: North America Smart Space Industry Revenue Share (%), by Type 2025 & 2033
- Figure 6: North America Smart Space Industry Volume Share (%), by Type 2025 & 2033
- Figure 7: North America Smart Space Industry Revenue (billion), by End-user Industry 2025 & 2033
- Figure 8: North America Smart Space Industry Volume (K Unit), by End-user Industry 2025 & 2033
- Figure 9: North America Smart Space Industry Revenue Share (%), by End-user Industry 2025 & 2033
- Figure 10: North America Smart Space Industry Volume Share (%), by End-user Industry 2025 & 2033
- Figure 11: North America Smart Space Industry Revenue (billion), by Country 2025 & 2033
- Figure 12: North America Smart Space Industry Volume (K Unit), by Country 2025 & 2033
- Figure 13: North America Smart Space Industry Revenue Share (%), by Country 2025 & 2033
- Figure 14: North America Smart Space Industry Volume Share (%), by Country 2025 & 2033
- Figure 15: Europe Smart Space Industry Revenue (billion), by Type 2025 & 2033
- Figure 16: Europe Smart Space Industry Volume (K Unit), by Type 2025 & 2033
- Figure 17: Europe Smart Space Industry Revenue Share (%), by Type 2025 & 2033
- Figure 18: Europe Smart Space Industry Volume Share (%), by Type 2025 & 2033
- Figure 19: Europe Smart Space Industry Revenue (billion), by End-user Industry 2025 & 2033
- Figure 20: Europe Smart Space Industry Volume (K Unit), by End-user Industry 2025 & 2033
- Figure 21: Europe Smart Space Industry Revenue Share (%), by End-user Industry 2025 & 2033
- Figure 22: Europe Smart Space Industry Volume Share (%), by End-user Industry 2025 & 2033
- Figure 23: Europe Smart Space Industry Revenue (billion), by Country 2025 & 2033
- Figure 24: Europe Smart Space Industry Volume (K Unit), by Country 2025 & 2033
- Figure 25: Europe Smart Space Industry Revenue Share (%), by Country 2025 & 2033
- Figure 26: Europe Smart Space Industry Volume Share (%), by Country 2025 & 2033
- Figure 27: Asia Pacific Smart Space Industry Revenue (billion), by Type 2025 & 2033
- Figure 28: Asia Pacific Smart Space Industry Volume (K Unit), by Type 2025 & 2033
- Figure 29: Asia Pacific Smart Space Industry Revenue Share (%), by Type 2025 & 2033
- Figure 30: Asia Pacific Smart Space Industry Volume Share (%), by Type 2025 & 2033
- Figure 31: Asia Pacific Smart Space Industry Revenue (billion), by End-user Industry 2025 & 2033
- Figure 32: Asia Pacific Smart Space Industry Volume (K Unit), by End-user Industry 2025 & 2033
- Figure 33: Asia Pacific Smart Space Industry Revenue Share (%), by End-user Industry 2025 & 2033
- Figure 34: Asia Pacific Smart Space Industry Volume Share (%), by End-user Industry 2025 & 2033
- Figure 35: Asia Pacific Smart Space Industry Revenue (billion), by Country 2025 & 2033
- Figure 36: Asia Pacific Smart Space Industry Volume (K Unit), by Country 2025 & 2033
- Figure 37: Asia Pacific Smart Space Industry Revenue Share (%), by Country 2025 & 2033
- Figure 38: Asia Pacific Smart Space Industry Volume Share (%), by Country 2025 & 2033
- Figure 39: Latin America Smart Space Industry Revenue (billion), by Type 2025 & 2033
- Figure 40: Latin America Smart Space Industry Volume (K Unit), by Type 2025 & 2033
- Figure 41: Latin America Smart Space Industry Revenue Share (%), by Type 2025 & 2033
- Figure 42: Latin America Smart Space Industry Volume Share (%), by Type 2025 & 2033
- Figure 43: Latin America Smart Space Industry Revenue (billion), by End-user Industry 2025 & 2033
- Figure 44: Latin America Smart Space Industry Volume (K Unit), by End-user Industry 2025 & 2033
- Figure 45: Latin America Smart Space Industry Revenue Share (%), by End-user Industry 2025 & 2033
- Figure 46: Latin America Smart Space Industry Volume Share (%), by End-user Industry 2025 & 2033
- Figure 47: Latin America Smart Space Industry Revenue (billion), by Country 2025 & 2033
- Figure 48: Latin America Smart Space Industry Volume (K Unit), by Country 2025 & 2033
- Figure 49: Latin America Smart Space Industry Revenue Share (%), by Country 2025 & 2033
- Figure 50: Latin America Smart Space Industry Volume Share (%), by Country 2025 & 2033
- Figure 51: Middle East Smart Space Industry Revenue (billion), by Type 2025 & 2033
- Figure 52: Middle East Smart Space Industry Volume (K Unit), by Type 2025 & 2033
- Figure 53: Middle East Smart Space Industry Revenue Share (%), by Type 2025 & 2033
- Figure 54: Middle East Smart Space Industry Volume Share (%), by Type 2025 & 2033
- Figure 55: Middle East Smart Space Industry Revenue (billion), by End-user Industry 2025 & 2033
- Figure 56: Middle East Smart Space Industry Volume (K Unit), by End-user Industry 2025 & 2033
- Figure 57: Middle East Smart Space Industry Revenue Share (%), by End-user Industry 2025 & 2033
- Figure 58: Middle East Smart Space Industry Volume Share (%), by End-user Industry 2025 & 2033
- Figure 59: Middle East Smart Space Industry Revenue (billion), by Country 2025 & 2033
- Figure 60: Middle East Smart Space Industry Volume (K Unit), by Country 2025 & 2033
- Figure 61: Middle East Smart Space Industry Revenue Share (%), by Country 2025 & 2033
- Figure 62: Middle East Smart Space Industry Volume Share (%), by Country 2025 & 2033
List of Tables
- Table 1: Global Smart Space Industry Revenue billion Forecast, by Type 2020 & 2033
- Table 2: Global Smart Space Industry Volume K Unit Forecast, by Type 2020 & 2033
- Table 3: Global Smart Space Industry Revenue billion Forecast, by End-user Industry 2020 & 2033
- Table 4: Global Smart Space Industry Volume K Unit Forecast, by End-user Industry 2020 & 2033
- Table 5: Global Smart Space Industry Revenue billion Forecast, by Region 2020 & 2033
- Table 6: Global Smart Space Industry Volume K Unit Forecast, by Region 2020 & 2033
- Table 7: Global Smart Space Industry Revenue billion Forecast, by Type 2020 & 2033
- Table 8: Global Smart Space Industry Volume K Unit Forecast, by Type 2020 & 2033
- Table 9: Global Smart Space Industry Revenue billion Forecast, by End-user Industry 2020 & 2033
- Table 10: Global Smart Space Industry Volume K Unit Forecast, by End-user Industry 2020 & 2033
- Table 11: Global Smart Space Industry Revenue billion Forecast, by Country 2020 & 2033
- Table 12: Global Smart Space Industry Volume K Unit Forecast, by Country 2020 & 2033
- Table 13: Global Smart Space Industry Revenue billion Forecast, by Type 2020 & 2033
- Table 14: Global Smart Space Industry Volume K Unit Forecast, by Type 2020 & 2033
- Table 15: Global Smart Space Industry Revenue billion Forecast, by End-user Industry 2020 & 2033
- Table 16: Global Smart Space Industry Volume K Unit Forecast, by End-user Industry 2020 & 2033
- Table 17: Global Smart Space Industry Revenue billion Forecast, by Country 2020 & 2033
- Table 18: Global Smart Space Industry Volume K Unit Forecast, by Country 2020 & 2033
- Table 19: Global Smart Space Industry Revenue billion Forecast, by Type 2020 & 2033
- Table 20: Global Smart Space Industry Volume K Unit Forecast, by Type 2020 & 2033
- Table 21: Global Smart Space Industry Revenue billion Forecast, by End-user Industry 2020 & 2033
- Table 22: Global Smart Space Industry Volume K Unit Forecast, by End-user Industry 2020 & 2033
- Table 23: Global Smart Space Industry Revenue billion Forecast, by Country 2020 & 2033
- Table 24: Global Smart Space Industry Volume K Unit Forecast, by Country 2020 & 2033
- Table 25: Global Smart Space Industry Revenue billion Forecast, by Type 2020 & 2033
- Table 26: Global Smart Space Industry Volume K Unit Forecast, by Type 2020 & 2033
- Table 27: Global Smart Space Industry Revenue billion Forecast, by End-user Industry 2020 & 2033
- Table 28: Global Smart Space Industry Volume K Unit Forecast, by End-user Industry 2020 & 2033
- Table 29: Global Smart Space Industry Revenue billion Forecast, by Country 2020 & 2033
- Table 30: Global Smart Space Industry Volume K Unit Forecast, by Country 2020 & 2033
- Table 31: Global Smart Space Industry Revenue billion Forecast, by Type 2020 & 2033
- Table 32: Global Smart Space Industry Volume K Unit Forecast, by Type 2020 & 2033
- Table 33: Global Smart Space Industry Revenue billion Forecast, by End-user Industry 2020 & 2033
- Table 34: Global Smart Space Industry Volume K Unit Forecast, by End-user Industry 2020 & 2033
- Table 35: Global Smart Space Industry Revenue billion Forecast, by Country 2020 & 2033
- Table 36: Global Smart Space Industry Volume K Unit Forecast, by Country 2020 & 2033
Frequently Asked Questions
1. What is the projected Compound Annual Growth Rate (CAGR) of the Smart Space Industry?
The projected CAGR is approximately 11.9%.
2. Which companies are prominent players in the Smart Space Industry?
Key companies in the market include ICONICS Inc, ABB Ltd, Microsoft Corporation, Cisco Systems Inc, Siemens AG, Hitachi Vantara Corporation, SmartSpace Software PLC, Ubisense Limited, Spacewell Faseas (Nemetschek Group), Adappt Intelligence Inc.
3. What are the main segments of the Smart Space Industry?
The market segments include Type, End-user Industry.
4. Can you provide details about the market size?
The market size is estimated to be USD 17.85 billion as of 2022.
5. What are some drivers contributing to market growth?
; Increasing Adoption of IoT; Increasing Urban Population.
6. What are the notable trends driving market growth?
Commercial Segment Estimated to Hold the Largest Market Share.
7. Are there any restraints impacting market growth?
; High Initial Infrastructure Expenditure.
8. Can you provide examples of recent developments in the market?
N/A
9. What pricing options are available for accessing the report?
Pricing options include single-user, multi-user, and enterprise licenses priced at USD 4750, USD 5250, and USD 8750 respectively.
10. Is the market size provided in terms of value or volume?
The market size is provided in terms of value, measured in billion and volume, measured in K Unit.
11. Are there any specific market keywords associated with the report?
Yes, the market keyword associated with the report is "Smart Space Industry," which aids in identifying and referencing the specific market segment covered.
12. How do I determine which pricing option suits my needs best?
The pricing options vary based on user requirements and access needs. Individual users may opt for single-user licenses, while businesses requiring broader access may choose multi-user or enterprise licenses for cost-effective access to the report.
13. Are there any additional resources or data provided in the Smart Space Industry report?
While the report offers comprehensive insights, it's advisable to review the specific contents or supplementary materials provided to ascertain if additional resources or data are available.
14. How can I stay updated on further developments or reports in the Smart Space Industry?
To stay informed about further developments, trends, and reports in the Smart Space Industry, consider subscribing to industry newsletters, following relevant companies and organizations, or regularly checking reputable industry news sources and publications.
Methodology
Step 1 - Identification of Relevant Samples Size from Population Database


Step 2 - Approaches for Defining Global Market Size (Value, Volume* & Price*)

Note*: In applicable scenarios
Step 3 - Data Sources
Primary Research
- Web Analytics
- Survey Reports
- Research Institute
- Latest Research Reports
- Opinion Leaders
Secondary Research
- Annual Reports
- White Paper
- Latest Press Release
- Industry Association
- Paid Database
- Investor Presentations

Step 4 - Data Triangulation
Involves using different sources of information in order to increase the validity of a study
These sources are likely to be stakeholders in a program - participants, other researchers, program staff, other community members, and so on.
Then we put all data in single framework & apply various statistical tools to find out the dynamic on the market.
During the analysis stage, feedback from the stakeholder groups would be compared to determine areas of agreement as well as areas of divergence