

Key Insights
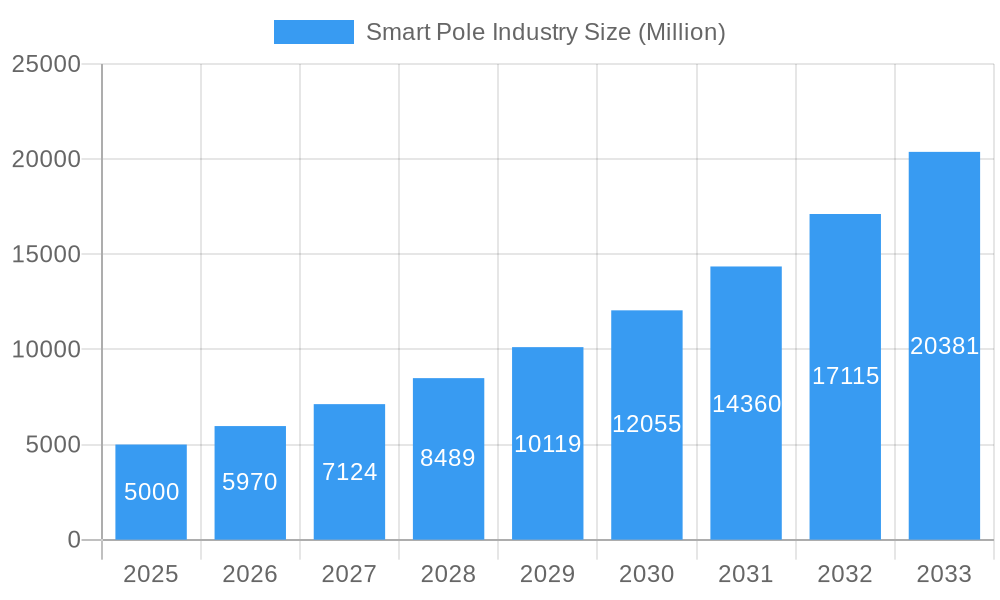
The global Smart Pole market is projected for significant expansion, estimated to reach $13 billion by 2033, with a Compound Annual Growth Rate (CAGR) of 15% from a 2025 base. This growth is driven by increasing demand for urban safety and security, alongside the integration of Internet of Things (IoT) in smart city infrastructure. Key catalysts include the deployment of advanced sensors for environmental monitoring, traffic management, and public safety, as well as the adoption of energy-efficient LED lighting. Government investments in smart city initiatives further fuel this trend, optimizing resource allocation and improving citizen services for sustainable urban development.
Smart Pole Industry Market Size (In Billion)
Market dynamics are shaped by smart poles evolving into multi-functional hubs supporting 5G, Wi-Fi, and EV charging. While high initial investment costs and integration complexities present restraints, cybersecurity and data privacy are critical considerations. The competitive landscape features established and emerging players, with strategic collaborations driving expansion. Production, consumption, import/export, and price trends indicate upward momentum, with North America and Europe leading adoption and Asia Pacific poised for accelerated growth.
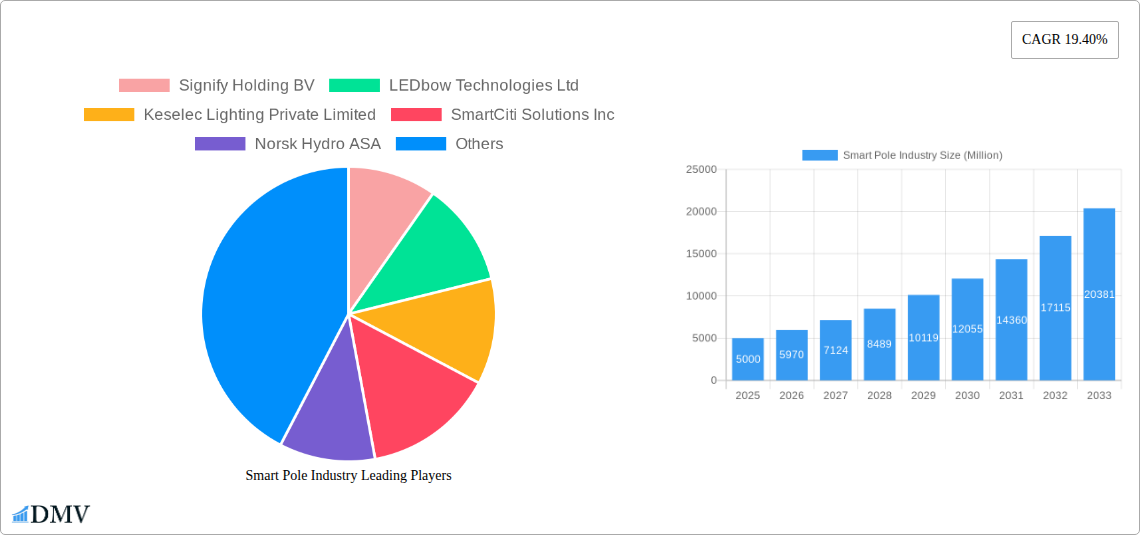
Smart Pole Industry Company Market Share
Smart Pole Industry Market Composition & Trends
The global Smart Pole Industry is a dynamic and rapidly evolving sector, characterized by a moderate to high market concentration driven by a few key players and ongoing innovation. Key companies like Signify Holding BV, LEDbow Technologies Ltd, and SmartCiti Solutions Inc are at the forefront of developing advanced smart pole solutions, integrating IoT technologies for enhanced urban infrastructure. The industry is fueled by increasing smart city initiatives, urban modernization projects, and the growing demand for sustainable and efficient public services. Regulatory landscapes are evolving to accommodate the integration of smart technologies into public spaces, encouraging widespread adoption. Substitute products, such as traditional streetlights and standalone sensor towers, are gradually being phased out as the comprehensive benefits of smart poles become apparent. End-user profiles are diverse, encompassing municipalities, urban planners, telecommunications companies, and utility providers, all seeking to leverage smart poles for improved connectivity, safety, and data collection. Mergers and acquisitions (M&A) are prevalent as larger entities aim to consolidate their market position and expand their technological capabilities. For instance, a recent acquisition in the sector involved a deal valued at over XXX Million, underscoring the strategic importance of this market. The market share distribution is largely influenced by technological prowess, product portfolio breadth, and the ability to offer integrated solutions.
Smart Pole Industry Industry Evolution
The Smart Pole Industry has witnessed remarkable evolution throughout the study period from 2019 to 2033, with a significant acceleration in growth trajectories observed from the historical period of 2019–2024 and projecting further expansion through the forecast period of 2025–2033. The base year of 2025 and estimated year of 2025 serve as crucial benchmarks for understanding current market dynamics and future potential. Technological advancements have been the primary catalyst for this transformation, moving smart poles from simple illumination devices to sophisticated multi-functional hubs. Initially, the focus was on LED lighting efficiency and controllability, but the integration of IoT sensors, 5G small cells, Wi-Fi hotspots, environmental monitoring systems, and advanced surveillance cameras has revolutionized their capabilities. This technological leap has been driven by substantial research and development investments by leading companies. Shifting consumer demands, particularly from urban dwellers and city administrators, have further propelled this evolution. The desire for safer, more connected, and environmentally conscious urban environments has created a robust demand for smart pole solutions that can address these needs holistically. Adoption metrics show a consistent upward trend, with smart pole deployments increasing by an average of XX% year-on-year in key metropolitan areas. This growth is further bolstered by government initiatives promoting smart city development, leading to increased adoption rates in North America, Europe, and Asia-Pacific. The transition from basic street lighting to smart infrastructure has been a gradual but impactful process, with a projected market growth rate of over XX% during the forecast period, indicating a sustained demand for these innovative urban solutions. The economic impact of these advancements includes reduced energy consumption through intelligent lighting management, improved public safety leading to lower crime rates, and the creation of new revenue streams through data monetization and enhanced connectivity services. The market is poised for continued expansion as more cities embrace the comprehensive benefits offered by these intelligent urban infrastructure components.
Leading Regions, Countries, or Segments in Smart Pole Industry
The Smart Pole Industry exhibits distinct leadership across various geographical regions and market segments, driven by a confluence of factors including investment trends, regulatory support, and technological adoption.
Production Analysis:
- North America currently leads in smart pole production, primarily due to significant investments in smart city infrastructure and the presence of major technology providers and manufacturing facilities. The United States, in particular, is a hub for smart pole development and manufacturing, supported by substantial R&D spending and a strong demand from its urban centers.
- Europe follows closely, with countries like Germany, the UK, and the Netherlands actively investing in smart city projects, fostering local production capabilities.
Consumption Analysis:
- Asia-Pacific is emerging as the largest consuming market for smart poles, driven by rapid urbanization in countries like China and India, coupled with aggressive government initiatives to deploy smart infrastructure. The sheer scale of urban populations and the imperative to improve city services are major consumption drivers.
- North America remains a significant consumer, with cities consistently upgrading their infrastructure to incorporate smart technologies.
Import Market Analysis (Value & Volume):
- The United States holds a dominant position in import value for smart poles, attracting high-end, technologically advanced solutions from global manufacturers. The volume of imports is also substantial, reflecting the vast scale of deployment projects.
- European countries like Germany and the UK are significant importers, seeking specialized components and integrated smart pole systems to meet diverse urban needs.
Export Market Analysis (Value & Volume):
- China is a leading exporter of smart poles, offering cost-effective and increasingly sophisticated solutions to markets worldwide. Its extensive manufacturing base and competitive pricing make it a major player in the global export arena.
- Companies based in North America and Europe also contribute significantly to exports, particularly for proprietary technologies and premium integrated solutions.
Price Trend Analysis:
- The price trend for smart poles has seen a gradual decrease in the historical period due to economies of scale and increased competition, particularly for basic LED-integrated smart poles. However, the introduction of advanced features such as 5G connectivity, complex sensor arrays, and AI capabilities is driving an increase in the average selling price for premium smart pole solutions. The estimated average price for a comprehensive smart pole solution is expected to range from $XXX Million to $XXX Million.
The dominance in these segments is propelled by factors such as strong government support for smart city initiatives, substantial investments in R&D, favorable regulatory frameworks, and the presence of key industry players driving innovation and adoption.
Smart Pole Industry Product Innovations
Product innovations in the Smart Pole Industry are continuously transforming urban landscapes. Current advancements focus on integrating advanced IoT sensors for real-time environmental monitoring (air quality, noise pollution), enhanced public safety features (intelligent surveillance, emergency communication systems), and seamless connectivity solutions (5G small cell deployment, public Wi-Fi). Performance metrics are being redefined with smart poles boasting energy efficiency exceeding XX%, extended lifespan of over XX years, and data processing capabilities integrated directly at the edge. Unique selling propositions include modular designs that allow for easy upgrades and customization, and the ability to act as a central data hub for a multitude of urban services, thereby optimizing resource allocation and improving citizen engagement. Technological advancements are moving towards AI-powered predictive maintenance and adaptive illumination for reduced energy consumption and enhanced user experience.
Propelling Factors for Smart Pole Industry Growth
The growth of the Smart Pole Industry is propelled by several interconnected factors. Technological advancements in IoT, 5G, and AI are enabling the creation of more sophisticated and multi-functional smart poles, enhancing their value proposition. Increasing urbanization and the global push for smart cities create a strong demand for intelligent infrastructure that can manage resources efficiently, improve public safety, and enhance connectivity. Government initiatives and funding for smart city projects worldwide provide crucial support and a conducive regulatory environment for deployment. Furthermore, the growing awareness of sustainability and the need for energy-efficient solutions are driving the adoption of smart, adaptive lighting systems offered by smart poles.
Obstacles in the Smart Pole Industry Market
Despite its promising growth, the Smart Pole Industry faces several obstacles. High initial investment costs associated with the deployment of advanced smart pole infrastructure can be a deterrent for some municipalities. Regulatory complexities and standardization issues can slow down the adoption process, as different regions may have varying requirements for data privacy, connectivity standards, and infrastructure integration. Cybersecurity concerns related to the interconnected nature of smart poles and the sensitive data they collect pose a significant challenge, requiring robust security measures. Supply chain disruptions, particularly for specialized electronic components, can impact production timelines and costs. Furthermore, public perception and the need for clear communication regarding the benefits and security of smart pole technology are crucial for widespread acceptance.
Future Opportunities in Smart Pole Industry
The Smart Pole Industry is ripe with future opportunities. The expansion of 5G network infrastructure presents a significant opportunity for smart poles to serve as distributed antenna systems, facilitating widespread 5G coverage. The integration of advanced analytics and AI will enable predictive maintenance, traffic management optimization, and personalized urban services, unlocking new revenue streams. Emerging markets in developing nations offer substantial potential for smart pole adoption as they strive to modernize their urban infrastructure. Furthermore, partnerships between smart pole manufacturers, utility companies, and telecommunication providers will create more comprehensive and integrated smart city solutions, driving innovation and market growth. The development of new use cases, such as smart parking management, public health monitoring, and autonomous vehicle infrastructure, will further expand the market's reach.
Major Players in the Smart Pole Industry Ecosystem
- Signify Holding BV
- LEDbow Technologies Ltd
- Keselec Lighting Private Limited
- SmartCiti Solutions Inc
- Norsk Hydro ASA
- HUB Group
- Lumca Inc
- Efftronics Systems Pvt Ltd
- Shanghai Sansi Electronic Engineering Co Ltd
- American Tower Corporation
- ELKO EP
- Energasia Smart Poles
- Valmont Structures Pvt Ltd
- ENE HUB Pty Ltd
- Streetscape International
- Iram Technologies Pvt Ltd
Key Developments in Smart Pole Industry Industry
- July 2022: Comptek Technologies (Comptek), an Aero Wireless Group Company, collaborated with ZenFiNetworks, the CityBridge Consortium, and Antenna Design to develop Link5G smart poles. In line with this initiative, the company aims to support the smart city initiative by deploying its infrastructure products and services in the region. Such initiatives by the companies are expected to drive the smart pole market during the study period.
- July 2021: Johnson City Commission partnered with TVA and Brightridge to install smart poles. The poles are customizable and can be outfitted with different components to improve public safety, provide connectivity, and collect data. TVA fully funded the poles downtown as part of a USD 335,000 grant. Similar poles have been in use in several metropolitan areas around the country.
Strategic Smart Pole Industry Market Forecast
The Smart Pole Industry market forecast indicates robust and sustained growth driven by increasing smart city investments and technological advancements. The convergence of 5G deployment, IoT integration, and AI-powered analytics will transform smart poles into essential urban infrastructure, offering a wide array of services from enhanced connectivity to environmental monitoring and public safety. Strategic partnerships and mergers are anticipated to further consolidate the market, fostering innovation and driving down costs for integrated solutions. The growing emphasis on sustainable urban development and energy efficiency will continue to be a significant growth catalyst. The market is projected to reach a valuation of over XXX Million by 2033, with a compound annual growth rate (CAGR) of approximately XX%, presenting substantial opportunities for stakeholders across the ecosystem.
Smart Pole Industry Segmentation
- 1. Production Analysis
- 2. Consumption Analysis
- 3. Import Market Analysis (Value & Volume)
- 4. Export Market Analysis (Value & Volume)
- 5. Price Trend Analysis
Smart Pole Industry Segmentation By Geography
- 1. North America
- 2. Europe
- 3. Asia Pacific
- 4. Rest of the World
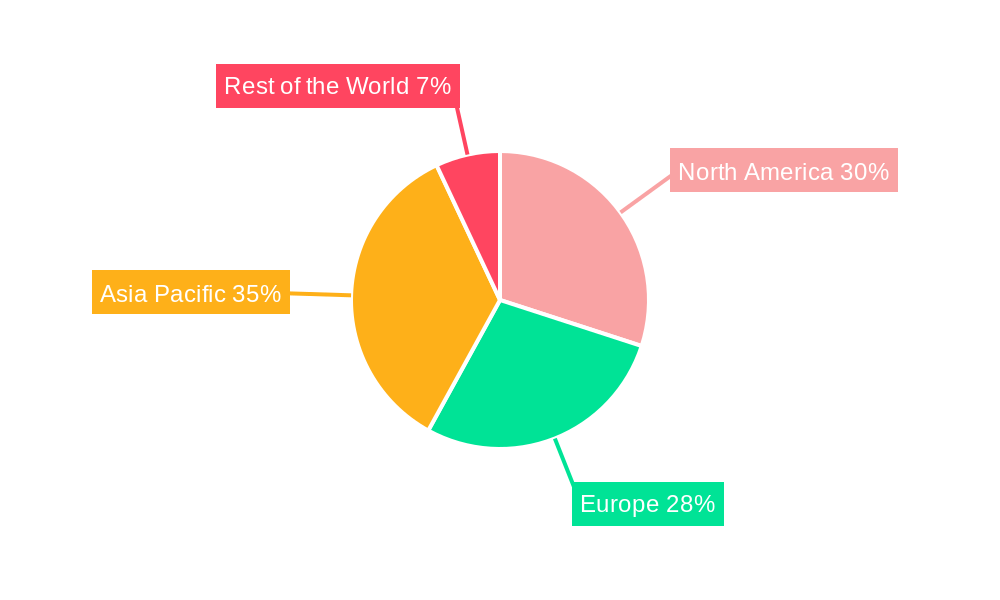
Smart Pole Industry Regional Market Share
Geographic Coverage of Smart Pole Industry
Smart Pole Industry REPORT HIGHLIGHTS
| Aspects | Details |
|---|---|
| Study Period | 2020-2034 |
| Base Year | 2025 |
| Estimated Year | 2026 |
| Forecast Period | 2026-2034 |
| Historical Period | 2020-2025 |
| Growth Rate | CAGR of 15% from 2020-2034 |
| Segmentation |
|
Table of Contents
- 1. Introduction
- 1.1. Research Scope
- 1.2. Market Segmentation
- 1.3. Research Objective
- 1.4. Definitions and Assumptions
- 2. Executive Summary
- 2.1. Market Snapshot
- 3. Market Dynamics
- 3.1. Market Drivers
- 3.2. Market Restrains
- 3.3. Market Trends
- 3.4. Market Opportunities
- 4. Market Factor Analysis
- 4.1. Porters Five Forces
- 4.1.1. Bargaining Power of Suppliers
- 4.1.2. Bargaining Power of Buyers
- 4.1.3. Threat of New Entrants
- 4.1.4. Threat of Substitutes
- 4.1.5. Competitive Rivalry
- 4.2. PESTEL analysis
- 4.3. BCG Analysis
- 4.3.1. Stars (High Growth, High Market Share)
- 4.3.2. Cash Cows (Low Growth, High Market Share)
- 4.3.3. Question Mark (High Growth, Low Market Share)
- 4.3.4. Dogs (Low Growth, Low Market Share)
- 4.4. Ansoff Matrix Analysis
- 4.5. Supply Chain Analysis
- 4.6. Regulatory Landscape
- 4.7. Current Market Potential and Opportunity Assessment (TAM–SAM–SOM Framework)
- 4.8. DMV Analyst Note
- 4.1. Porters Five Forces
- 5. Market Analysis, Insights and Forecast 2021-2033
- 5.1. Market Analysis, Insights and Forecast - by Production Analysis
- 5.2. Market Analysis, Insights and Forecast - by Consumption Analysis
- 5.3. Market Analysis, Insights and Forecast - by Import Market Analysis (Value & Volume)
- 5.4. Market Analysis, Insights and Forecast - by Export Market Analysis (Value & Volume)
- 5.5. Market Analysis, Insights and Forecast - by Price Trend Analysis
- 5.6. Market Analysis, Insights and Forecast - by Region
- 5.6.1. North America
- 5.6.2. Europe
- 5.6.3. Asia Pacific
- 5.6.4. Rest of the World
- 6. Global Smart Pole Industry Analysis, Insights and Forecast, 2021-2033
- 6.1. Market Analysis, Insights and Forecast - by Production Analysis
- 6.2. Market Analysis, Insights and Forecast - by Consumption Analysis
- 6.3. Market Analysis, Insights and Forecast - by Import Market Analysis (Value & Volume)
- 6.4. Market Analysis, Insights and Forecast - by Export Market Analysis (Value & Volume)
- 6.5. Market Analysis, Insights and Forecast - by Price Trend Analysis
- 7. North America Smart Pole Industry Analysis, Insights and Forecast, 2020-2032
- 7.1. Market Analysis, Insights and Forecast - by Production Analysis
- 7.2. Market Analysis, Insights and Forecast - by Consumption Analysis
- 7.3. Market Analysis, Insights and Forecast - by Import Market Analysis (Value & Volume)
- 7.4. Market Analysis, Insights and Forecast - by Export Market Analysis (Value & Volume)
- 7.5. Market Analysis, Insights and Forecast - by Price Trend Analysis
- 8. Europe Smart Pole Industry Analysis, Insights and Forecast, 2020-2032
- 8.1. Market Analysis, Insights and Forecast - by Production Analysis
- 8.2. Market Analysis, Insights and Forecast - by Consumption Analysis
- 8.3. Market Analysis, Insights and Forecast - by Import Market Analysis (Value & Volume)
- 8.4. Market Analysis, Insights and Forecast - by Export Market Analysis (Value & Volume)
- 8.5. Market Analysis, Insights and Forecast - by Price Trend Analysis
- 9. Asia Pacific Smart Pole Industry Analysis, Insights and Forecast, 2020-2032
- 9.1. Market Analysis, Insights and Forecast - by Production Analysis
- 9.2. Market Analysis, Insights and Forecast - by Consumption Analysis
- 9.3. Market Analysis, Insights and Forecast - by Import Market Analysis (Value & Volume)
- 9.4. Market Analysis, Insights and Forecast - by Export Market Analysis (Value & Volume)
- 9.5. Market Analysis, Insights and Forecast - by Price Trend Analysis
- 10. Rest of the World Smart Pole Industry Analysis, Insights and Forecast, 2020-2032
- 10.1. Market Analysis, Insights and Forecast - by Production Analysis
- 10.2. Market Analysis, Insights and Forecast - by Consumption Analysis
- 10.3. Market Analysis, Insights and Forecast - by Import Market Analysis (Value & Volume)
- 10.4. Market Analysis, Insights and Forecast - by Export Market Analysis (Value & Volume)
- 10.5. Market Analysis, Insights and Forecast - by Price Trend Analysis
- 11. Competitive Analysis
- 11.1. Company Profiles
- 11.1.1 Signify Holding BV
- 11.1.1.1. Company Overview
- 11.1.1.2. Products
- 11.1.1.3. Company Financials
- 11.1.1.4. SWOT Analysis
- 11.1.2 LEDbow Technologies Ltd
- 11.1.2.1. Company Overview
- 11.1.2.2. Products
- 11.1.2.3. Company Financials
- 11.1.2.4. SWOT Analysis
- 11.1.3 Keselec Lighting Private Limited
- 11.1.3.1. Company Overview
- 11.1.3.2. Products
- 11.1.3.3. Company Financials
- 11.1.3.4. SWOT Analysis
- 11.1.4 SmartCiti Solutions Inc
- 11.1.4.1. Company Overview
- 11.1.4.2. Products
- 11.1.4.3. Company Financials
- 11.1.4.4. SWOT Analysis
- 11.1.5 Norsk Hydro ASA
- 11.1.5.1. Company Overview
- 11.1.5.2. Products
- 11.1.5.3. Company Financials
- 11.1.5.4. SWOT Analysis
- 11.1.6 HUB Group
- 11.1.6.1. Company Overview
- 11.1.6.2. Products
- 11.1.6.3. Company Financials
- 11.1.6.4. SWOT Analysis
- 11.1.7 Lumca Inc
- 11.1.7.1. Company Overview
- 11.1.7.2. Products
- 11.1.7.3. Company Financials
- 11.1.7.4. SWOT Analysis
- 11.1.8 Efftronics Systems Pvt Ltd
- 11.1.8.1. Company Overview
- 11.1.8.2. Products
- 11.1.8.3. Company Financials
- 11.1.8.4. SWOT Analysis
- 11.1.9 Shanghai Sansi Electronic Engineering Co Ltd
- 11.1.9.1. Company Overview
- 11.1.9.2. Products
- 11.1.9.3. Company Financials
- 11.1.9.4. SWOT Analysis
- 11.1.10 American Tower Corporation
- 11.1.10.1. Company Overview
- 11.1.10.2. Products
- 11.1.10.3. Company Financials
- 11.1.10.4. SWOT Analysis
- 11.1.11 ELKO EP
- 11.1.11.1. Company Overview
- 11.1.11.2. Products
- 11.1.11.3. Company Financials
- 11.1.11.4. SWOT Analysis
- 11.1.12 Energasia Smart Poles
- 11.1.12.1. Company Overview
- 11.1.12.2. Products
- 11.1.12.3. Company Financials
- 11.1.12.4. SWOT Analysis
- 11.1.13 Valmont Structures Pvt Ltd
- 11.1.13.1. Company Overview
- 11.1.13.2. Products
- 11.1.13.3. Company Financials
- 11.1.13.4. SWOT Analysis
- 11.1.14 ENE HUB Pty Ltd*List Not Exhaustive
- 11.1.14.1. Company Overview
- 11.1.14.2. Products
- 11.1.14.3. Company Financials
- 11.1.14.4. SWOT Analysis
- 11.1.15 Streetscape International
- 11.1.15.1. Company Overview
- 11.1.15.2. Products
- 11.1.15.3. Company Financials
- 11.1.15.4. SWOT Analysis
- 11.1.16 Iram Technologies Pvt Ltd
- 11.1.16.1. Company Overview
- 11.1.16.2. Products
- 11.1.16.3. Company Financials
- 11.1.16.4. SWOT Analysis
- 11.1.1 Signify Holding BV
- 11.2. Market Entropy
- 11.2.1 Company's Key Areas Served
- 11.2.2 Recent Developments
- 11.3. Company Market Share Analysis 2025
- 11.3.1 Top 5 Companies Market Share Analysis
- 11.3.2 Top 3 Companies Market Share Analysis
- 11.4. List of Potential Customers
- 12. Research Methodology
List of Figures
- Figure 1: Global Smart Pole Industry Revenue Breakdown (billion, %) by Region 2025 & 2033
- Figure 2: North America Smart Pole Industry Revenue (billion), by Production Analysis 2025 & 2033
- Figure 3: North America Smart Pole Industry Revenue Share (%), by Production Analysis 2025 & 2033
- Figure 4: North America Smart Pole Industry Revenue (billion), by Consumption Analysis 2025 & 2033
- Figure 5: North America Smart Pole Industry Revenue Share (%), by Consumption Analysis 2025 & 2033
- Figure 6: North America Smart Pole Industry Revenue (billion), by Import Market Analysis (Value & Volume) 2025 & 2033
- Figure 7: North America Smart Pole Industry Revenue Share (%), by Import Market Analysis (Value & Volume) 2025 & 2033
- Figure 8: North America Smart Pole Industry Revenue (billion), by Export Market Analysis (Value & Volume) 2025 & 2033
- Figure 9: North America Smart Pole Industry Revenue Share (%), by Export Market Analysis (Value & Volume) 2025 & 2033
- Figure 10: North America Smart Pole Industry Revenue (billion), by Price Trend Analysis 2025 & 2033
- Figure 11: North America Smart Pole Industry Revenue Share (%), by Price Trend Analysis 2025 & 2033
- Figure 12: North America Smart Pole Industry Revenue (billion), by Country 2025 & 2033
- Figure 13: North America Smart Pole Industry Revenue Share (%), by Country 2025 & 2033
- Figure 14: Europe Smart Pole Industry Revenue (billion), by Production Analysis 2025 & 2033
- Figure 15: Europe Smart Pole Industry Revenue Share (%), by Production Analysis 2025 & 2033
- Figure 16: Europe Smart Pole Industry Revenue (billion), by Consumption Analysis 2025 & 2033
- Figure 17: Europe Smart Pole Industry Revenue Share (%), by Consumption Analysis 2025 & 2033
- Figure 18: Europe Smart Pole Industry Revenue (billion), by Import Market Analysis (Value & Volume) 2025 & 2033
- Figure 19: Europe Smart Pole Industry Revenue Share (%), by Import Market Analysis (Value & Volume) 2025 & 2033
- Figure 20: Europe Smart Pole Industry Revenue (billion), by Export Market Analysis (Value & Volume) 2025 & 2033
- Figure 21: Europe Smart Pole Industry Revenue Share (%), by Export Market Analysis (Value & Volume) 2025 & 2033
- Figure 22: Europe Smart Pole Industry Revenue (billion), by Price Trend Analysis 2025 & 2033
- Figure 23: Europe Smart Pole Industry Revenue Share (%), by Price Trend Analysis 2025 & 2033
- Figure 24: Europe Smart Pole Industry Revenue (billion), by Country 2025 & 2033
- Figure 25: Europe Smart Pole Industry Revenue Share (%), by Country 2025 & 2033
- Figure 26: Asia Pacific Smart Pole Industry Revenue (billion), by Production Analysis 2025 & 2033
- Figure 27: Asia Pacific Smart Pole Industry Revenue Share (%), by Production Analysis 2025 & 2033
- Figure 28: Asia Pacific Smart Pole Industry Revenue (billion), by Consumption Analysis 2025 & 2033
- Figure 29: Asia Pacific Smart Pole Industry Revenue Share (%), by Consumption Analysis 2025 & 2033
- Figure 30: Asia Pacific Smart Pole Industry Revenue (billion), by Import Market Analysis (Value & Volume) 2025 & 2033
- Figure 31: Asia Pacific Smart Pole Industry Revenue Share (%), by Import Market Analysis (Value & Volume) 2025 & 2033
- Figure 32: Asia Pacific Smart Pole Industry Revenue (billion), by Export Market Analysis (Value & Volume) 2025 & 2033
- Figure 33: Asia Pacific Smart Pole Industry Revenue Share (%), by Export Market Analysis (Value & Volume) 2025 & 2033
- Figure 34: Asia Pacific Smart Pole Industry Revenue (billion), by Price Trend Analysis 2025 & 2033
- Figure 35: Asia Pacific Smart Pole Industry Revenue Share (%), by Price Trend Analysis 2025 & 2033
- Figure 36: Asia Pacific Smart Pole Industry Revenue (billion), by Country 2025 & 2033
- Figure 37: Asia Pacific Smart Pole Industry Revenue Share (%), by Country 2025 & 2033
- Figure 38: Rest of the World Smart Pole Industry Revenue (billion), by Production Analysis 2025 & 2033
- Figure 39: Rest of the World Smart Pole Industry Revenue Share (%), by Production Analysis 2025 & 2033
- Figure 40: Rest of the World Smart Pole Industry Revenue (billion), by Consumption Analysis 2025 & 2033
- Figure 41: Rest of the World Smart Pole Industry Revenue Share (%), by Consumption Analysis 2025 & 2033
- Figure 42: Rest of the World Smart Pole Industry Revenue (billion), by Import Market Analysis (Value & Volume) 2025 & 2033
- Figure 43: Rest of the World Smart Pole Industry Revenue Share (%), by Import Market Analysis (Value & Volume) 2025 & 2033
- Figure 44: Rest of the World Smart Pole Industry Revenue (billion), by Export Market Analysis (Value & Volume) 2025 & 2033
- Figure 45: Rest of the World Smart Pole Industry Revenue Share (%), by Export Market Analysis (Value & Volume) 2025 & 2033
- Figure 46: Rest of the World Smart Pole Industry Revenue (billion), by Price Trend Analysis 2025 & 2033
- Figure 47: Rest of the World Smart Pole Industry Revenue Share (%), by Price Trend Analysis 2025 & 2033
- Figure 48: Rest of the World Smart Pole Industry Revenue (billion), by Country 2025 & 2033
- Figure 49: Rest of the World Smart Pole Industry Revenue Share (%), by Country 2025 & 2033
List of Tables
- Table 1: Global Smart Pole Industry Revenue billion Forecast, by Production Analysis 2020 & 2033
- Table 2: Global Smart Pole Industry Revenue billion Forecast, by Consumption Analysis 2020 & 2033
- Table 3: Global Smart Pole Industry Revenue billion Forecast, by Import Market Analysis (Value & Volume) 2020 & 2033
- Table 4: Global Smart Pole Industry Revenue billion Forecast, by Export Market Analysis (Value & Volume) 2020 & 2033
- Table 5: Global Smart Pole Industry Revenue billion Forecast, by Price Trend Analysis 2020 & 2033
- Table 6: Global Smart Pole Industry Revenue billion Forecast, by Region 2020 & 2033
- Table 7: Global Smart Pole Industry Revenue billion Forecast, by Production Analysis 2020 & 2033
- Table 8: Global Smart Pole Industry Revenue billion Forecast, by Consumption Analysis 2020 & 2033
- Table 9: Global Smart Pole Industry Revenue billion Forecast, by Import Market Analysis (Value & Volume) 2020 & 2033
- Table 10: Global Smart Pole Industry Revenue billion Forecast, by Export Market Analysis (Value & Volume) 2020 & 2033
- Table 11: Global Smart Pole Industry Revenue billion Forecast, by Price Trend Analysis 2020 & 2033
- Table 12: Global Smart Pole Industry Revenue billion Forecast, by Country 2020 & 2033
- Table 13: Global Smart Pole Industry Revenue billion Forecast, by Production Analysis 2020 & 2033
- Table 14: Global Smart Pole Industry Revenue billion Forecast, by Consumption Analysis 2020 & 2033
- Table 15: Global Smart Pole Industry Revenue billion Forecast, by Import Market Analysis (Value & Volume) 2020 & 2033
- Table 16: Global Smart Pole Industry Revenue billion Forecast, by Export Market Analysis (Value & Volume) 2020 & 2033
- Table 17: Global Smart Pole Industry Revenue billion Forecast, by Price Trend Analysis 2020 & 2033
- Table 18: Global Smart Pole Industry Revenue billion Forecast, by Country 2020 & 2033
- Table 19: Global Smart Pole Industry Revenue billion Forecast, by Production Analysis 2020 & 2033
- Table 20: Global Smart Pole Industry Revenue billion Forecast, by Consumption Analysis 2020 & 2033
- Table 21: Global Smart Pole Industry Revenue billion Forecast, by Import Market Analysis (Value & Volume) 2020 & 2033
- Table 22: Global Smart Pole Industry Revenue billion Forecast, by Export Market Analysis (Value & Volume) 2020 & 2033
- Table 23: Global Smart Pole Industry Revenue billion Forecast, by Price Trend Analysis 2020 & 2033
- Table 24: Global Smart Pole Industry Revenue billion Forecast, by Country 2020 & 2033
- Table 25: Global Smart Pole Industry Revenue billion Forecast, by Production Analysis 2020 & 2033
- Table 26: Global Smart Pole Industry Revenue billion Forecast, by Consumption Analysis 2020 & 2033
- Table 27: Global Smart Pole Industry Revenue billion Forecast, by Import Market Analysis (Value & Volume) 2020 & 2033
- Table 28: Global Smart Pole Industry Revenue billion Forecast, by Export Market Analysis (Value & Volume) 2020 & 2033
- Table 29: Global Smart Pole Industry Revenue billion Forecast, by Price Trend Analysis 2020 & 2033
- Table 30: Global Smart Pole Industry Revenue billion Forecast, by Country 2020 & 2033
Frequently Asked Questions
1. What is the projected Compound Annual Growth Rate (CAGR) of the Smart Pole Industry?
The projected CAGR is approximately 15%.
2. Which companies are prominent players in the Smart Pole Industry?
Key companies in the market include Signify Holding BV, LEDbow Technologies Ltd, Keselec Lighting Private Limited, SmartCiti Solutions Inc, Norsk Hydro ASA, HUB Group, Lumca Inc, Efftronics Systems Pvt Ltd, Shanghai Sansi Electronic Engineering Co Ltd, American Tower Corporation, ELKO EP, Energasia Smart Poles, Valmont Structures Pvt Ltd, ENE HUB Pty Ltd*List Not Exhaustive, Streetscape International, Iram Technologies Pvt Ltd.
3. What are the main segments of the Smart Pole Industry?
The market segments include Production Analysis, Consumption Analysis, Import Market Analysis (Value & Volume), Export Market Analysis (Value & Volume), Price Trend Analysis.
4. Can you provide details about the market size?
The market size is estimated to be USD 13 billion as of 2022.
5. What are some drivers contributing to market growth?
Increasing Need for Reducing Traffic Jams and Preventing Accidents; Growing Initiative by Various Government for Smart Cities.
6. What are the notable trends driving market growth?
Growing Smart City Initiatives by Various Governments.
7. Are there any restraints impacting market growth?
Rising Complexities to Implement Transition from Manual to Software Testing Process.
8. Can you provide examples of recent developments in the market?
July 2022 - ComptekTechnologies (Comptek), an Aero Wireless Group Company, collaborated with ZenFiNetworks, the CityBridgeConsortium, and Antenna Design to develop Link5G smart poles. In line with this initiative, the company aims to support the smart city initiative by deploying its infrastructure products and services in the region. Such initiatives by the companies are expected to drive the smart pole market during the study period.
9. What pricing options are available for accessing the report?
Pricing options include single-user, multi-user, and enterprise licenses priced at USD 4750, USD 5250, and USD 8750 respectively.
10. Is the market size provided in terms of value or volume?
The market size is provided in terms of value, measured in billion.
11. Are there any specific market keywords associated with the report?
Yes, the market keyword associated with the report is "Smart Pole Industry," which aids in identifying and referencing the specific market segment covered.
12. How do I determine which pricing option suits my needs best?
The pricing options vary based on user requirements and access needs. Individual users may opt for single-user licenses, while businesses requiring broader access may choose multi-user or enterprise licenses for cost-effective access to the report.
13. Are there any additional resources or data provided in the Smart Pole Industry report?
While the report offers comprehensive insights, it's advisable to review the specific contents or supplementary materials provided to ascertain if additional resources or data are available.
14. How can I stay updated on further developments or reports in the Smart Pole Industry?
To stay informed about further developments, trends, and reports in the Smart Pole Industry, consider subscribing to industry newsletters, following relevant companies and organizations, or regularly checking reputable industry news sources and publications.
Methodology
Step 1 - Identification of Relevant Samples Size from Population Database


Step 2 - Approaches for Defining Global Market Size (Value, Volume* & Price*)

Note*: In applicable scenarios
Step 3 - Data Sources
Primary Research
- Web Analytics
- Survey Reports
- Research Institute
- Latest Research Reports
- Opinion Leaders
Secondary Research
- Annual Reports
- White Paper
- Latest Press Release
- Industry Association
- Paid Database
- Investor Presentations

Step 4 - Data Triangulation
Involves using different sources of information in order to increase the validity of a study
These sources are likely to be stakeholders in a program - participants, other researchers, program staff, other community members, and so on.
Then we put all data in single framework & apply various statistical tools to find out the dynamic on the market.
During the analysis stage, feedback from the stakeholder groups would be compared to determine areas of agreement as well as areas of divergence