

Key Insights
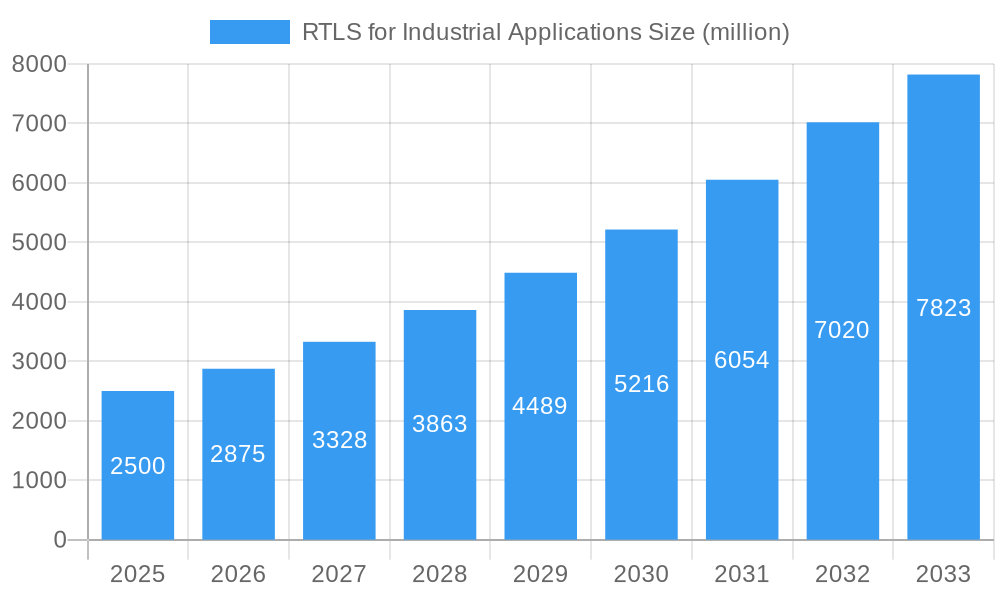
The Real-Time Location Systems (RTLS) market for industrial applications is experiencing robust growth, driven by the increasing need for enhanced operational efficiency, asset tracking, and worker safety within manufacturing, logistics, and warehousing sectors. The market, estimated at $2.5 billion in 2025, is projected to exhibit a Compound Annual Growth Rate (CAGR) of 15% from 2025 to 2033, reaching approximately $7.8 billion by 2033. Key drivers include the rising adoption of Industry 4.0 technologies, the need for improved supply chain visibility, and stringent regulatory compliance requirements emphasizing worker safety and productivity. Emerging trends such as the integration of RTLS with artificial intelligence (AI) and the Internet of Things (IoT) are further fueling market expansion, enabling advanced analytics and predictive maintenance capabilities. While initial implementation costs and concerns regarding data security pose some restraints, the long-term benefits of enhanced efficiency and safety outweigh these challenges, promoting widespread adoption across diverse industrial settings.
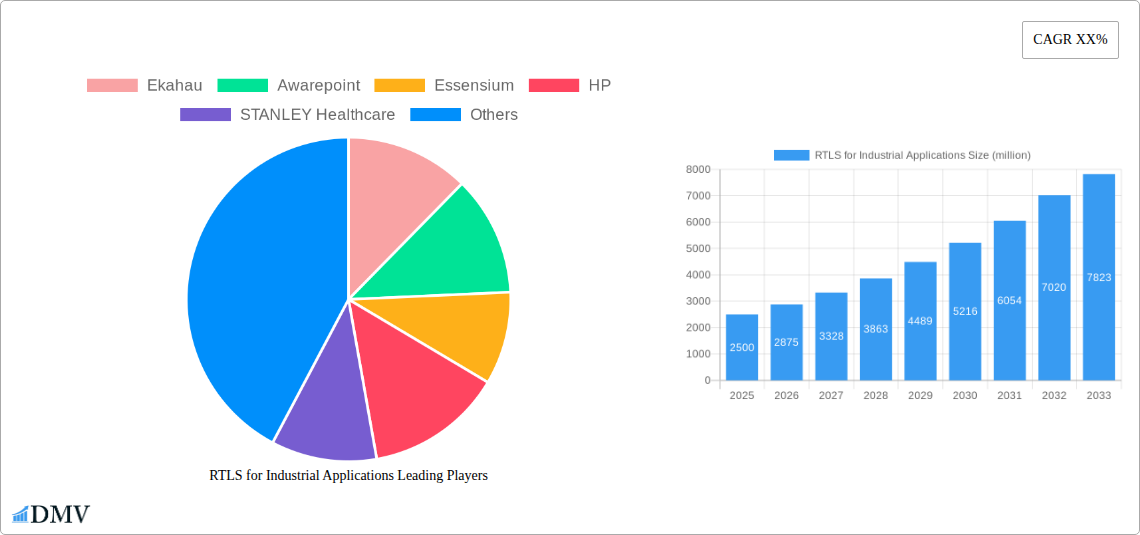
RTLS for Industrial Applications Market Size (In Billion)
The competitive landscape is characterized by a mix of established players and emerging technology providers. Companies like Ekahau, Awarepoint, Essensium, HP, STANLEY Healthcare, PINC Solutions, Schmidt, Ubisense, View Technologies, and Zebra Technologies are actively contributing to market growth through innovation and strategic partnerships. Geographical growth is expected to be particularly strong in regions experiencing rapid industrialization and technological advancements, with North America and Europe currently holding significant market share but Asia-Pacific poised for substantial future growth. Continued advancements in sensor technology, improved data analytics capabilities, and the development of more user-friendly and cost-effective solutions will further drive market expansion in the coming years, solidifying RTLS as a crucial component of the modern industrial landscape.
RTLS for Industrial Applications Company Market Share
Real-Time Location Systems (RTLS) for Industrial Applications Market Report: 2019-2033
This comprehensive report provides an in-depth analysis of the global RTLS for industrial applications market, projecting a market value exceeding $xx million by 2033. The study covers the historical period (2019-2024), the base year (2025), and the forecast period (2025-2033), offering crucial insights for stakeholders seeking to navigate this rapidly evolving landscape. This report is meticulously researched and requires no further modification.
RTLS for Industrial Applications Market Composition & Trends
The global RTLS for industrial applications market, valued at $xx million in 2025, exhibits a moderately concentrated landscape. Key players, including Ekahau, Awarepoint, Essensium, HP, STANLEY Healthcare, PINC Solutions, Schmidt, Ubisense, View Technologies, and Zebra Technologies, hold significant market share, though the exact distribution remains dynamic due to ongoing M&A activity and new entrants. Innovation is driven by advancements in sensor technology, improved analytics capabilities, and the increasing demand for real-time visibility across diverse industrial sectors. Regulatory landscapes, varying across regions, influence adoption rates and compliance requirements. Substitute technologies, such as RFID and Bluetooth beacons, present competition, but RTLS solutions often offer superior accuracy and functionality. End-user profiles are diverse, ranging from manufacturing and logistics to healthcare and warehousing, each with specific application needs. M&A activity has been significant, with several deals exceeding $xx million in the past five years, shaping the competitive landscape and accelerating technological advancements.
- Market Concentration: Moderately concentrated, with top 10 players accounting for approximately xx% of the market share in 2025.
- Innovation Catalysts: Advancements in ultra-wideband (UWB) technology, AI-powered analytics, and improved sensor integration.
- Regulatory Landscape: Varied across regions, impacting adoption rates and necessitating compliance with specific industry standards.
- Substitute Products: RFID and Bluetooth beacons offer alternative solutions, but RTLS systems provide higher accuracy and broader functionalities.
- End-User Profiles: Diverse, including manufacturing, logistics, healthcare, warehousing, and others, each with specific requirements.
- M&A Activity: Significant transactions exceeding $xx million in recent years, impacting market consolidation and technological development.
RTLS for Industrial Applications Industry Evolution
The RTLS for industrial applications market demonstrates robust growth, exhibiting a Compound Annual Growth Rate (CAGR) of xx% during the forecast period (2025-2033). This growth is fueled by several factors, including the increasing need for enhanced operational efficiency, improved asset tracking, and better worker safety across various industries. Technological advancements, such as the integration of IoT (Internet of Things) devices and AI-driven analytics, are significantly improving the accuracy and functionality of RTLS systems. Furthermore, evolving consumer demands for real-time visibility and data-driven decision-making are driving wider adoption. Specific applications, like enhancing supply chain management and optimizing workforce deployment in manufacturing facilities, are significantly boosting market expansion. The adoption rate is increasing, with approximately xx% of large industrial enterprises having implemented RTLS solutions by 2025.
Leading Regions, Countries, or Segments in RTLS for Industrial Applications
North America currently dominates the RTLS market due to the high adoption rate in sectors such as healthcare and manufacturing, coupled with significant investments in technological advancements.
- Key Drivers in North America:
- High initial investment in advanced technologies.
- Stringent regulatory compliance requirements driving adoption.
- Strong presence of major RTLS vendors.
- Dominance Factors: Early adoption of advanced technologies, high technological expertise, and robust regulatory frameworks fostering innovation. The strong presence of major players within the region, combined with a willingness to adopt new technology solutions, contributes to its dominance. This trend is anticipated to continue throughout the forecast period.
RTLS for Industrial Applications Product Innovations
Recent innovations include the integration of advanced sensor technologies (like UWB and Bluetooth Low Energy), AI-powered analytics for real-time data interpretation and predictive maintenance, and the development of cloud-based platforms for seamless data access and management. These innovations offer improved accuracy, enhanced data insights, and greater scalability, making RTLS systems more cost-effective and versatile for a wider range of industrial applications. Unique selling propositions center around enhanced precision, advanced analytics capabilities, and seamless integration with existing enterprise systems.
Propelling Factors for RTLS for Industrial Applications Growth
Several factors are driving market expansion, including the increasing demand for improved operational efficiency across industries. Technological advancements, such as the incorporation of IoT devices and AI-powered analytics, improve accuracy and data processing. Furthermore, favorable government regulations and initiatives promoting digitalization in industrial sectors, such as industry 4.0, are contributing to growth. Economic factors, such as increased productivity and reduced operational costs, further incentivize adoption.
Obstacles in the RTLS for Industrial Applications Market
High initial investment costs and complexity of implementation remain significant barriers to entry for many businesses. Supply chain disruptions experienced in recent years have also impacted availability and pricing. Intense competition among established players and the emergence of new technologies also present challenges. The overall impact of these obstacles is estimated to reduce market growth by approximately xx% during the forecast period.
Future Opportunities in RTLS for Industrial Applications
Emerging opportunities lie in the expanding adoption of RTLS in sectors like smart agriculture, smart cities, and environmental monitoring. Integration with 5G networks promises improved connectivity and real-time data transmission. Advancements in AI and machine learning will further enhance data analytics and predictive capabilities. The expansion into new geographical markets, particularly in developing economies, presents considerable potential for growth.
Major Players in the RTLS for Industrial Applications Ecosystem
Key Developments in RTLS for Industrial Applications Industry
- 2022 Q4: Zebra Technologies launched a new series of RTLS tags with improved battery life and enhanced range.
- 2023 Q1: Awarepoint announced a strategic partnership with a major cloud provider to enhance its data analytics platform.
- 2023 Q2: Ekahau acquired a smaller competitor specializing in UWB technology, expanding its market reach. (Further details on acquisitions and partnerships would be added here in a full report).
Strategic RTLS for Industrial Applications Market Forecast
The RTLS for industrial applications market is poised for significant growth driven by technological advancements, increased demand for efficiency gains, and expanding applications across diverse industries. The integration of AI and IoT, coupled with the expansion into new markets, will propel continued market expansion exceeding $xx million by 2033. Opportunities for innovation and strategic partnerships will shape the competitive landscape, fostering further growth and development in the years to come.
RTLS for Industrial Applications Segmentation
-
1. Application
- 1.1. Food Process
- 1.2. Chemical Industry
- 1.3. Automotive Industry
- 1.4. Others
-
2. Types
- 2.1. Systems
- 2.2. Tags
RTLS for Industrial Applications Segmentation By Geography
-
1. North America
- 1.1. United States
- 1.2. Canada
- 1.3. Mexico
-
2. South America
- 2.1. Brazil
- 2.2. Argentina
- 2.3. Rest of South America
-
3. Europe
- 3.1. United Kingdom
- 3.2. Germany
- 3.3. France
- 3.4. Italy
- 3.5. Spain
- 3.6. Russia
- 3.7. Benelux
- 3.8. Nordics
- 3.9. Rest of Europe
-
4. Middle East & Africa
- 4.1. Turkey
- 4.2. Israel
- 4.3. GCC
- 4.4. North Africa
- 4.5. South Africa
- 4.6. Rest of Middle East & Africa
-
5. Asia Pacific
- 5.1. China
- 5.2. India
- 5.3. Japan
- 5.4. South Korea
- 5.5. ASEAN
- 5.6. Oceania
- 5.7. Rest of Asia Pacific
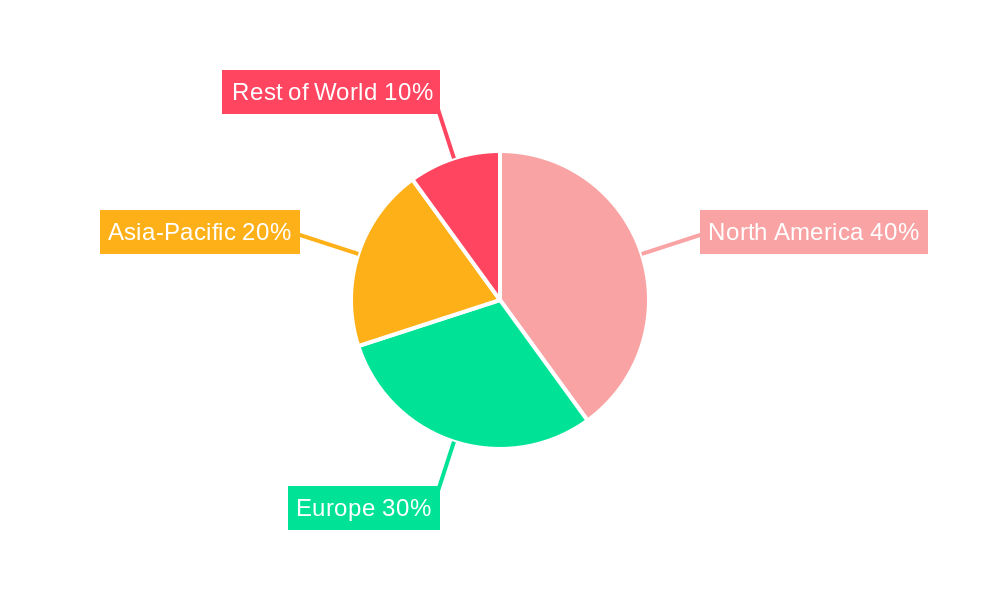
RTLS for Industrial Applications Regional Market Share
Geographic Coverage of RTLS for Industrial Applications
RTLS for Industrial Applications REPORT HIGHLIGHTS
| Aspects | Details |
|---|---|
| Study Period | 2020-2034 |
| Base Year | 2025 |
| Estimated Year | 2026 |
| Forecast Period | 2026-2034 |
| Historical Period | 2020-2025 |
| Growth Rate | CAGR of 16.6% from 2020-2034 |
| Segmentation |
|
Table of Contents
- 1. Introduction
- 1.1. Research Scope
- 1.2. Market Segmentation
- 1.3. Research Methodology
- 1.4. Definitions and Assumptions
- 2. Executive Summary
- 2.1. Introduction
- 3. Market Dynamics
- 3.1. Introduction
- 3.2. Market Drivers
- 3.3. Market Restrains
- 3.4. Market Trends
- 4. Market Factor Analysis
- 4.1. Porters Five Forces
- 4.2. Supply/Value Chain
- 4.3. PESTEL analysis
- 4.4. Market Entropy
- 4.5. Patent/Trademark Analysis
- 5. Global RTLS for Industrial Applications Analysis, Insights and Forecast, 2020-2032
- 5.1. Market Analysis, Insights and Forecast - by Application
- 5.1.1. Food Process
- 5.1.2. Chemical Industry
- 5.1.3. Automotive Industry
- 5.1.4. Others
- 5.2. Market Analysis, Insights and Forecast - by Types
- 5.2.1. Systems
- 5.2.2. Tags
- 5.3. Market Analysis, Insights and Forecast - by Region
- 5.3.1. North America
- 5.3.2. South America
- 5.3.3. Europe
- 5.3.4. Middle East & Africa
- 5.3.5. Asia Pacific
- 5.1. Market Analysis, Insights and Forecast - by Application
- 6. North America RTLS for Industrial Applications Analysis, Insights and Forecast, 2020-2032
- 6.1. Market Analysis, Insights and Forecast - by Application
- 6.1.1. Food Process
- 6.1.2. Chemical Industry
- 6.1.3. Automotive Industry
- 6.1.4. Others
- 6.2. Market Analysis, Insights and Forecast - by Types
- 6.2.1. Systems
- 6.2.2. Tags
- 6.1. Market Analysis, Insights and Forecast - by Application
- 7. South America RTLS for Industrial Applications Analysis, Insights and Forecast, 2020-2032
- 7.1. Market Analysis, Insights and Forecast - by Application
- 7.1.1. Food Process
- 7.1.2. Chemical Industry
- 7.1.3. Automotive Industry
- 7.1.4. Others
- 7.2. Market Analysis, Insights and Forecast - by Types
- 7.2.1. Systems
- 7.2.2. Tags
- 7.1. Market Analysis, Insights and Forecast - by Application
- 8. Europe RTLS for Industrial Applications Analysis, Insights and Forecast, 2020-2032
- 8.1. Market Analysis, Insights and Forecast - by Application
- 8.1.1. Food Process
- 8.1.2. Chemical Industry
- 8.1.3. Automotive Industry
- 8.1.4. Others
- 8.2. Market Analysis, Insights and Forecast - by Types
- 8.2.1. Systems
- 8.2.2. Tags
- 8.1. Market Analysis, Insights and Forecast - by Application
- 9. Middle East & Africa RTLS for Industrial Applications Analysis, Insights and Forecast, 2020-2032
- 9.1. Market Analysis, Insights and Forecast - by Application
- 9.1.1. Food Process
- 9.1.2. Chemical Industry
- 9.1.3. Automotive Industry
- 9.1.4. Others
- 9.2. Market Analysis, Insights and Forecast - by Types
- 9.2.1. Systems
- 9.2.2. Tags
- 9.1. Market Analysis, Insights and Forecast - by Application
- 10. Asia Pacific RTLS for Industrial Applications Analysis, Insights and Forecast, 2020-2032
- 10.1. Market Analysis, Insights and Forecast - by Application
- 10.1.1. Food Process
- 10.1.2. Chemical Industry
- 10.1.3. Automotive Industry
- 10.1.4. Others
- 10.2. Market Analysis, Insights and Forecast - by Types
- 10.2.1. Systems
- 10.2.2. Tags
- 10.1. Market Analysis, Insights and Forecast - by Application
- 11. Competitive Analysis
- 11.1. Global Market Share Analysis 2025
- 11.2. Company Profiles
- 11.2.1 Ekahau
- 11.2.1.1. Overview
- 11.2.1.2. Products
- 11.2.1.3. SWOT Analysis
- 11.2.1.4. Recent Developments
- 11.2.1.5. Financials (Based on Availability)
- 11.2.2 Awarepoint
- 11.2.2.1. Overview
- 11.2.2.2. Products
- 11.2.2.3. SWOT Analysis
- 11.2.2.4. Recent Developments
- 11.2.2.5. Financials (Based on Availability)
- 11.2.3 Essensium
- 11.2.3.1. Overview
- 11.2.3.2. Products
- 11.2.3.3. SWOT Analysis
- 11.2.3.4. Recent Developments
- 11.2.3.5. Financials (Based on Availability)
- 11.2.4 HP
- 11.2.4.1. Overview
- 11.2.4.2. Products
- 11.2.4.3. SWOT Analysis
- 11.2.4.4. Recent Developments
- 11.2.4.5. Financials (Based on Availability)
- 11.2.5 STANLEY Healthcare
- 11.2.5.1. Overview
- 11.2.5.2. Products
- 11.2.5.3. SWOT Analysis
- 11.2.5.4. Recent Developments
- 11.2.5.5. Financials (Based on Availability)
- 11.2.6 PINC Solutions
- 11.2.6.1. Overview
- 11.2.6.2. Products
- 11.2.6.3. SWOT Analysis
- 11.2.6.4. Recent Developments
- 11.2.6.5. Financials (Based on Availability)
- 11.2.7 Schmidt
- 11.2.7.1. Overview
- 11.2.7.2. Products
- 11.2.7.3. SWOT Analysis
- 11.2.7.4. Recent Developments
- 11.2.7.5. Financials (Based on Availability)
- 11.2.8 Ubisense
- 11.2.8.1. Overview
- 11.2.8.2. Products
- 11.2.8.3. SWOT Analysis
- 11.2.8.4. Recent Developments
- 11.2.8.5. Financials (Based on Availability)
- 11.2.9 View Technologies
- 11.2.9.1. Overview
- 11.2.9.2. Products
- 11.2.9.3. SWOT Analysis
- 11.2.9.4. Recent Developments
- 11.2.9.5. Financials (Based on Availability)
- 11.2.10 Zebra Technologies
- 11.2.10.1. Overview
- 11.2.10.2. Products
- 11.2.10.3. SWOT Analysis
- 11.2.10.4. Recent Developments
- 11.2.10.5. Financials (Based on Availability)
- 11.2.1 Ekahau
List of Figures
- Figure 1: Global RTLS for Industrial Applications Revenue Breakdown (undefined, %) by Region 2025 & 2033
- Figure 2: North America RTLS for Industrial Applications Revenue (undefined), by Application 2025 & 2033
- Figure 3: North America RTLS for Industrial Applications Revenue Share (%), by Application 2025 & 2033
- Figure 4: North America RTLS for Industrial Applications Revenue (undefined), by Types 2025 & 2033
- Figure 5: North America RTLS for Industrial Applications Revenue Share (%), by Types 2025 & 2033
- Figure 6: North America RTLS for Industrial Applications Revenue (undefined), by Country 2025 & 2033
- Figure 7: North America RTLS for Industrial Applications Revenue Share (%), by Country 2025 & 2033
- Figure 8: South America RTLS for Industrial Applications Revenue (undefined), by Application 2025 & 2033
- Figure 9: South America RTLS for Industrial Applications Revenue Share (%), by Application 2025 & 2033
- Figure 10: South America RTLS for Industrial Applications Revenue (undefined), by Types 2025 & 2033
- Figure 11: South America RTLS for Industrial Applications Revenue Share (%), by Types 2025 & 2033
- Figure 12: South America RTLS for Industrial Applications Revenue (undefined), by Country 2025 & 2033
- Figure 13: South America RTLS for Industrial Applications Revenue Share (%), by Country 2025 & 2033
- Figure 14: Europe RTLS for Industrial Applications Revenue (undefined), by Application 2025 & 2033
- Figure 15: Europe RTLS for Industrial Applications Revenue Share (%), by Application 2025 & 2033
- Figure 16: Europe RTLS for Industrial Applications Revenue (undefined), by Types 2025 & 2033
- Figure 17: Europe RTLS for Industrial Applications Revenue Share (%), by Types 2025 & 2033
- Figure 18: Europe RTLS for Industrial Applications Revenue (undefined), by Country 2025 & 2033
- Figure 19: Europe RTLS for Industrial Applications Revenue Share (%), by Country 2025 & 2033
- Figure 20: Middle East & Africa RTLS for Industrial Applications Revenue (undefined), by Application 2025 & 2033
- Figure 21: Middle East & Africa RTLS for Industrial Applications Revenue Share (%), by Application 2025 & 2033
- Figure 22: Middle East & Africa RTLS for Industrial Applications Revenue (undefined), by Types 2025 & 2033
- Figure 23: Middle East & Africa RTLS for Industrial Applications Revenue Share (%), by Types 2025 & 2033
- Figure 24: Middle East & Africa RTLS for Industrial Applications Revenue (undefined), by Country 2025 & 2033
- Figure 25: Middle East & Africa RTLS for Industrial Applications Revenue Share (%), by Country 2025 & 2033
- Figure 26: Asia Pacific RTLS for Industrial Applications Revenue (undefined), by Application 2025 & 2033
- Figure 27: Asia Pacific RTLS for Industrial Applications Revenue Share (%), by Application 2025 & 2033
- Figure 28: Asia Pacific RTLS for Industrial Applications Revenue (undefined), by Types 2025 & 2033
- Figure 29: Asia Pacific RTLS for Industrial Applications Revenue Share (%), by Types 2025 & 2033
- Figure 30: Asia Pacific RTLS for Industrial Applications Revenue (undefined), by Country 2025 & 2033
- Figure 31: Asia Pacific RTLS for Industrial Applications Revenue Share (%), by Country 2025 & 2033
List of Tables
- Table 1: Global RTLS for Industrial Applications Revenue undefined Forecast, by Application 2020 & 2033
- Table 2: Global RTLS for Industrial Applications Revenue undefined Forecast, by Types 2020 & 2033
- Table 3: Global RTLS for Industrial Applications Revenue undefined Forecast, by Region 2020 & 2033
- Table 4: Global RTLS for Industrial Applications Revenue undefined Forecast, by Application 2020 & 2033
- Table 5: Global RTLS for Industrial Applications Revenue undefined Forecast, by Types 2020 & 2033
- Table 6: Global RTLS for Industrial Applications Revenue undefined Forecast, by Country 2020 & 2033
- Table 7: United States RTLS for Industrial Applications Revenue (undefined) Forecast, by Application 2020 & 2033
- Table 8: Canada RTLS for Industrial Applications Revenue (undefined) Forecast, by Application 2020 & 2033
- Table 9: Mexico RTLS for Industrial Applications Revenue (undefined) Forecast, by Application 2020 & 2033
- Table 10: Global RTLS for Industrial Applications Revenue undefined Forecast, by Application 2020 & 2033
- Table 11: Global RTLS for Industrial Applications Revenue undefined Forecast, by Types 2020 & 2033
- Table 12: Global RTLS for Industrial Applications Revenue undefined Forecast, by Country 2020 & 2033
- Table 13: Brazil RTLS for Industrial Applications Revenue (undefined) Forecast, by Application 2020 & 2033
- Table 14: Argentina RTLS for Industrial Applications Revenue (undefined) Forecast, by Application 2020 & 2033
- Table 15: Rest of South America RTLS for Industrial Applications Revenue (undefined) Forecast, by Application 2020 & 2033
- Table 16: Global RTLS for Industrial Applications Revenue undefined Forecast, by Application 2020 & 2033
- Table 17: Global RTLS for Industrial Applications Revenue undefined Forecast, by Types 2020 & 2033
- Table 18: Global RTLS for Industrial Applications Revenue undefined Forecast, by Country 2020 & 2033
- Table 19: United Kingdom RTLS for Industrial Applications Revenue (undefined) Forecast, by Application 2020 & 2033
- Table 20: Germany RTLS for Industrial Applications Revenue (undefined) Forecast, by Application 2020 & 2033
- Table 21: France RTLS for Industrial Applications Revenue (undefined) Forecast, by Application 2020 & 2033
- Table 22: Italy RTLS for Industrial Applications Revenue (undefined) Forecast, by Application 2020 & 2033
- Table 23: Spain RTLS for Industrial Applications Revenue (undefined) Forecast, by Application 2020 & 2033
- Table 24: Russia RTLS for Industrial Applications Revenue (undefined) Forecast, by Application 2020 & 2033
- Table 25: Benelux RTLS for Industrial Applications Revenue (undefined) Forecast, by Application 2020 & 2033
- Table 26: Nordics RTLS for Industrial Applications Revenue (undefined) Forecast, by Application 2020 & 2033
- Table 27: Rest of Europe RTLS for Industrial Applications Revenue (undefined) Forecast, by Application 2020 & 2033
- Table 28: Global RTLS for Industrial Applications Revenue undefined Forecast, by Application 2020 & 2033
- Table 29: Global RTLS for Industrial Applications Revenue undefined Forecast, by Types 2020 & 2033
- Table 30: Global RTLS for Industrial Applications Revenue undefined Forecast, by Country 2020 & 2033
- Table 31: Turkey RTLS for Industrial Applications Revenue (undefined) Forecast, by Application 2020 & 2033
- Table 32: Israel RTLS for Industrial Applications Revenue (undefined) Forecast, by Application 2020 & 2033
- Table 33: GCC RTLS for Industrial Applications Revenue (undefined) Forecast, by Application 2020 & 2033
- Table 34: North Africa RTLS for Industrial Applications Revenue (undefined) Forecast, by Application 2020 & 2033
- Table 35: South Africa RTLS for Industrial Applications Revenue (undefined) Forecast, by Application 2020 & 2033
- Table 36: Rest of Middle East & Africa RTLS for Industrial Applications Revenue (undefined) Forecast, by Application 2020 & 2033
- Table 37: Global RTLS for Industrial Applications Revenue undefined Forecast, by Application 2020 & 2033
- Table 38: Global RTLS for Industrial Applications Revenue undefined Forecast, by Types 2020 & 2033
- Table 39: Global RTLS for Industrial Applications Revenue undefined Forecast, by Country 2020 & 2033
- Table 40: China RTLS for Industrial Applications Revenue (undefined) Forecast, by Application 2020 & 2033
- Table 41: India RTLS for Industrial Applications Revenue (undefined) Forecast, by Application 2020 & 2033
- Table 42: Japan RTLS for Industrial Applications Revenue (undefined) Forecast, by Application 2020 & 2033
- Table 43: South Korea RTLS for Industrial Applications Revenue (undefined) Forecast, by Application 2020 & 2033
- Table 44: ASEAN RTLS for Industrial Applications Revenue (undefined) Forecast, by Application 2020 & 2033
- Table 45: Oceania RTLS for Industrial Applications Revenue (undefined) Forecast, by Application 2020 & 2033
- Table 46: Rest of Asia Pacific RTLS for Industrial Applications Revenue (undefined) Forecast, by Application 2020 & 2033
Frequently Asked Questions
1. What is the projected Compound Annual Growth Rate (CAGR) of the RTLS for Industrial Applications?
The projected CAGR is approximately 16.6%.
2. Which companies are prominent players in the RTLS for Industrial Applications?
Key companies in the market include Ekahau, Awarepoint, Essensium, HP, STANLEY Healthcare, PINC Solutions, Schmidt, Ubisense, View Technologies, Zebra Technologies.
3. What are the main segments of the RTLS for Industrial Applications?
The market segments include Application, Types.
4. Can you provide details about the market size?
The market size is estimated to be USD XXX N/A as of 2022.
5. What are some drivers contributing to market growth?
N/A
6. What are the notable trends driving market growth?
N/A
7. Are there any restraints impacting market growth?
N/A
8. Can you provide examples of recent developments in the market?
N/A
9. What pricing options are available for accessing the report?
Pricing options include single-user, multi-user, and enterprise licenses priced at USD 2900.00, USD 4350.00, and USD 5800.00 respectively.
10. Is the market size provided in terms of value or volume?
The market size is provided in terms of value, measured in N/A.
11. Are there any specific market keywords associated with the report?
Yes, the market keyword associated with the report is "RTLS for Industrial Applications," which aids in identifying and referencing the specific market segment covered.
12. How do I determine which pricing option suits my needs best?
The pricing options vary based on user requirements and access needs. Individual users may opt for single-user licenses, while businesses requiring broader access may choose multi-user or enterprise licenses for cost-effective access to the report.
13. Are there any additional resources or data provided in the RTLS for Industrial Applications report?
While the report offers comprehensive insights, it's advisable to review the specific contents or supplementary materials provided to ascertain if additional resources or data are available.
14. How can I stay updated on further developments or reports in the RTLS for Industrial Applications?
To stay informed about further developments, trends, and reports in the RTLS for Industrial Applications, consider subscribing to industry newsletters, following relevant companies and organizations, or regularly checking reputable industry news sources and publications.
Methodology
Step 1 - Identification of Relevant Samples Size from Population Database


Step 2 - Approaches for Defining Global Market Size (Value, Volume* & Price*)

Note*: In applicable scenarios
Step 3 - Data Sources
Primary Research
- Web Analytics
- Survey Reports
- Research Institute
- Latest Research Reports
- Opinion Leaders
Secondary Research
- Annual Reports
- White Paper
- Latest Press Release
- Industry Association
- Paid Database
- Investor Presentations

Step 4 - Data Triangulation
Involves using different sources of information in order to increase the validity of a study
These sources are likely to be stakeholders in a program - participants, other researchers, program staff, other community members, and so on.
Then we put all data in single framework & apply various statistical tools to find out the dynamic on the market.
During the analysis stage, feedback from the stakeholder groups would be compared to determine areas of agreement as well as areas of divergence