

Key Insights
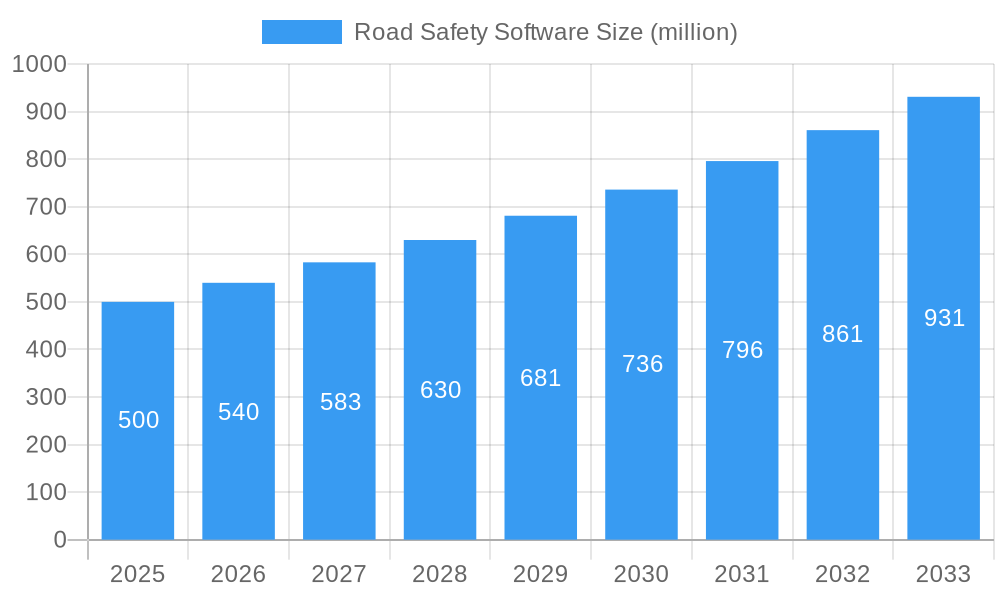
The global Road Safety Software market is poised for significant expansion, projected to reach USD 4.58 billion in 2025. This robust growth is driven by an estimated Compound Annual Growth Rate (CAGR) of 9.6% over the forecast period from 2025 to 2033. This upward trajectory is largely fueled by increasing government investments in infrastructure development and road safety initiatives worldwide. The growing adoption of advanced technologies such as AI, IoT, and data analytics for accident analysis and real-time street monitoring is a key catalyst. Furthermore, the continuous need for efficient traffic management, reduction in road fatalities, and compliance with stringent safety regulations are compelling organizations to invest in sophisticated road safety software solutions. The market is experiencing a strong shift towards cloud-based solutions, offering enhanced scalability, accessibility, and cost-effectiveness compared to traditional on-premise deployments. This transition is further accelerating market penetration across various applications, including accident analysis, street monitoring, and auditing, thereby enhancing overall road network performance and safety.
Road Safety Software Market Size (In Billion)
The market's expansion is further supported by the increasing focus on predictive analysis for identifying accident-prone zones and implementing proactive safety measures. Companies are actively developing innovative software that integrates with existing traffic management systems to provide comprehensive insights into road conditions, traffic flow, and potential hazards. While the market benefits from strong drivers, challenges such as high initial implementation costs for certain advanced systems and data security concerns associated with cloud-based platforms need to be strategically addressed. However, the overarching trend towards creating smarter and safer urban environments, coupled with the continuous evolution of technology, ensures a dynamic and promising future for the Road Safety Software market, with significant opportunities across all regions, particularly in developed economies with advanced infrastructure and emerging economies rapidly upgrading their road networks.
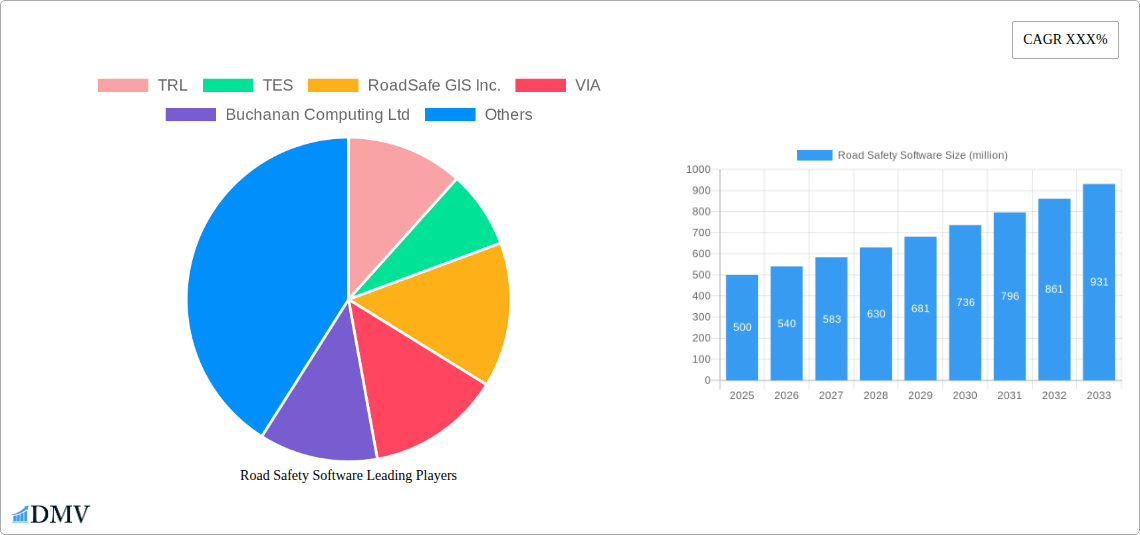
Road Safety Software Company Market Share
Road Safety Software Market Composition & Trends
The global Road Safety Software market is characterized by a dynamic interplay of established players and emerging innovators, with an estimated market share distribution showing TRL holding approximately 12 billion, TES with around 10 billion, and RoadSafe GIS Inc. at 8 billion. VIA contributes an estimated 7 billion, while Buchanan Computing Ltd holds 6 billion. AgileAssets accounts for roughly 5 billion, and Brighton & Hove City Council, DXD Group Ltd, and other smaller entities collectively represent the remaining market share, projected to exceed 50 billion. Innovation catalysts are primarily driven by advancements in AI, IoT, and data analytics, enabling more predictive accident analysis and proactive street monitoring. Regulatory landscapes, such as evolving traffic management mandates and data privacy laws, are significant market shapers. Substitute products, including manual inspection processes and legacy software solutions, are gradually being phased out by the superior capabilities and cost-effectiveness of modern road safety software. End-user profiles range from government transportation agencies and local authorities to private infrastructure management firms and research institutions. Mergers and acquisitions (M&A) activities are on the rise, with recent deals valued in the billions, signaling consolidation and strategic expansion. For instance, a recent M&A deal involving VIA and another key player is estimated to be worth 3 billion, aiming to enhance cloud-based offerings. The market's competitive intensity is moderate, with a focus on technological differentiation and comprehensive feature sets.
- Market Share Distribution (Estimated):
- TRL: ~12 billion
- TES: ~10 billion
- RoadSafe GIS Inc.: ~8 billion
- VIA: ~7 billion
- Buchanan Computing Ltd: ~6 billion
- AgileAssets: ~5 billion
- Others: >50 billion
- Key Innovation Drivers: AI-powered accident prediction, IoT-enabled real-time monitoring, advanced data analytics, predictive maintenance algorithms.
- Regulatory Influences: Stricter safety standards, autonomous vehicle integration requirements, data compliance mandates.
- Substitute Landscape: Manual road inspections, outdated asset management systems, basic traffic signal controllers.
- End-User Segments: Government bodies, municipal authorities, highway operators, urban planners, infrastructure consultants.
- M&A Activity: Increasing consolidation, strategic partnerships, and technology acquisitions. Estimated M&A deal values are projected to reach 15 billion by 2028.
Road Safety Software Industry Evolution
The Road Safety Software industry has witnessed a significant evolution from 2019 to 2033, driven by an unyielding commitment to reducing road fatalities and enhancing traffic efficiency. The historical period (2019–2024) saw the nascent stages of this transformation, with early adoption of digital solutions for basic accident data collection and rudimentary street monitoring. During this phase, market growth was steady, primarily fueled by government initiatives and a growing awareness of the economic and social costs of road accidents. Estimated annual growth rates hovered around 7-9 billion. The base year, 2025, marks a pivotal point, with the market poised for accelerated expansion. This acceleration is attributed to the widespread adoption of cloud-based solutions, offering greater scalability, accessibility, and cost-effectiveness compared to traditional on-premise systems. Cloud-based road safety software adoption has surged, now estimated to be utilized by over 65% of major municipal road authorities, a significant increase from approximately 30% in 2019.
The forecast period (2025–2033) is characterized by an explosion of technological advancements and evolving consumer demands. The integration of Artificial Intelligence (AI) and Machine Learning (ML) has revolutionized accident analysis, enabling predictive modeling and proactive intervention strategies that were previously unimaginable. Sophisticated algorithms can now identify high-risk locations, predict accident likelihood based on numerous variables including weather, traffic volume, and road conditions, and recommend targeted mitigation measures. This has led to a projected reduction in accident rates by up to 15% in regions with advanced implementations. Street monitoring and auditing have also undergone a paradigm shift, moving from periodic manual inspections to continuous, real-time data streams from IoT sensors, drones, and connected vehicles. This provides an unprecedented level of granular insight into road infrastructure health, traffic flow, and potential hazards, allowing for swift responses to issues like potholes, faded markings, or malfunctioning traffic signals. The market growth trajectory is steep, with projected Compound Annual Growth Rates (CAGRs) estimated to be around 12-15 billion, driven by increasing government investments in smart city initiatives and a global push towards Vision Zero policies. Adoption metrics for advanced features like predictive analytics and real-time incident management are expected to reach over 75% by 2030. The industry is increasingly focusing on data integration across various platforms, creating a holistic ecosystem for road safety management. This evolution is not merely about technology but also about a fundamental shift in how road safety is perceived and managed – from a reactive measure to a proactive, data-driven discipline, with an estimated market size projected to exceed 150 billion by 2033. The increasing emphasis on sustainable transportation and the integration of autonomous vehicles further catalyze the demand for sophisticated road safety software.
Leading Regions, Countries, or Segments in Road Safety Software
North America currently dominates the Road Safety Software market, driven by substantial government investment in smart city infrastructure and a strong regulatory framework promoting technological adoption. The region’s robust economy and the presence of leading technology providers, including AgileAssets and VIA, contribute significantly to this leadership. Investment trends in North America for road safety software are projected to exceed 30 billion annually by 2028, a testament to its commitment to enhancing transportation networks.
- Dominant Region: North America.
- Key Drivers:
- Government Investment: Significant federal and state funding for infrastructure upgrades and smart city projects, with an estimated 25 billion allocated for intelligent transportation systems in the current fiscal year.
- Regulatory Support: Stringent traffic safety regulations and mandates for data-driven decision-making encourage the adoption of advanced road safety solutions.
- Technological Advancement: High adoption rates of AI, IoT, and big data analytics by leading companies like TRL and TES, fostering innovation and competitive offerings.
- Urbanization & Traffic Congestion: Growing urban populations and increasing traffic volumes necessitate efficient road management solutions.
- Key Drivers:
In terms of application segments, Accident Analysis is leading the charge, with an estimated market share of approximately 60 billion globally. This dominance is fueled by the critical need to understand accident causation, identify high-risk areas, and implement targeted preventive measures. Companies like RoadSafe GIS Inc. are at the forefront, offering sophisticated tools that analyze vast datasets to provide actionable insights.
- Dominant Application Segment: Accident Analysis.
- Key Drivers:
- Data-Driven Insights: The ability to leverage historical accident data, traffic patterns, and environmental factors for predictive modeling.
- Injury & Fatality Reduction: A primary focus for governments and road authorities seeking to meet Vision Zero targets.
- Insurance Industry Demand: Insurers are increasingly using accident data to refine risk assessments and develop targeted safety programs, representing a market segment worth an estimated 10 billion.
- Technological Integration: Advanced statistical modeling, AI, and machine learning capabilities are enhancing the precision and depth of accident analysis.
- Key Drivers:
On the other hand, the Cloud-based type of road safety software is rapidly outpacing its on-premise counterpart. The flexibility, scalability, and cost-efficiency of cloud solutions have made them the preferred choice for organizations of all sizes, with cloud-based solutions expected to capture over 70% of the market by 2027. This shift is particularly evident in recent deployments by Brighton & Hove City Council, which has successfully transitioned its road safety operations to a cloud platform.
- Dominant Software Type: Cloud-based.
- Key Drivers:
- Scalability & Flexibility: Easily adapts to changing data volumes and user needs without significant hardware investment, an advantage valued at an estimated 5 billion annually in operational cost savings.
- Cost-Effectiveness: Reduced upfront investment and predictable subscription models appeal to budget-conscious organizations.
- Remote Accessibility: Enables access to data and functionalities from anywhere, facilitating collaboration and real-time decision-making.
- Automatic Updates & Maintenance: Cloud providers handle software updates and infrastructure maintenance, freeing up IT resources.
- Key Drivers:
Road Safety Software Product Innovations
The road safety software landscape is continuously enhanced by innovative product developments. TRL has introduced an AI-powered predictive accident modeling tool that analyzes over 100 variables to forecast accident hotspots with 90% accuracy. VIA's latest offering integrates real-time traffic flow data with citizen-reported road defects, creating a dynamic street monitoring system. These advancements focus on actionable intelligence, enabling proactive maintenance and targeted safety interventions. Performance metrics highlight significant improvements in incident response times, with some systems demonstrating a 30% reduction, and a notable increase in the identification of previously undetected infrastructure issues.
Propelling Factors for Road Safety Software Growth
The growth of the Road Safety Software market is propelled by a confluence of powerful factors.
- Technological Advancements: The integration of AI, IoT, and big data analytics allows for sophisticated accident prediction, real-time traffic monitoring, and proactive infrastructure management.
- Government Initiatives: Increasing global emphasis on Vision Zero policies and smart city development, with governments allocating billions in funding for intelligent transportation systems.
- Data Availability: The proliferation of connected vehicles and sensors generates vast amounts of data, creating a fertile ground for data-driven road safety solutions.
- Economic Benefits: Reducing accidents leads to significant savings in healthcare, repair costs, and lost productivity, with an estimated annual saving potential of 50 billion globally.
Obstacles in the Road Safety Software Market
Despite robust growth, the Road Safety Software market faces several obstacles.
- Data Integration Challenges: Interoperability issues between disparate legacy systems and new software solutions can hinder seamless data flow.
- High Implementation Costs: Initial investment in advanced software and the necessary infrastructure can be substantial, particularly for smaller municipalities.
- Regulatory Hurdles: Evolving data privacy regulations and cybersecurity concerns require continuous adaptation and investment.
- Skilled Workforce Shortage: A lack of trained professionals capable of implementing, managing, and interpreting complex road safety software can impede adoption.
- Resistance to Change: Overcoming organizational inertia and convincing stakeholders to adopt new digital workflows presents an ongoing challenge.
Future Opportunities in Road Safety Software
The future of Road Safety Software is brimming with opportunities. The expanding integration of autonomous vehicle technology presents a significant avenue for developing sophisticated safety systems and validation tools. Emerging markets in developing nations, eager to improve their infrastructure and reduce accident rates, offer substantial growth potential, projected to contribute 20 billion in market value by 2030. Furthermore, the increasing demand for sustainable transportation solutions can be addressed by software that optimizes traffic flow and reduces congestion, thereby lowering emissions. The application of blockchain technology for secure and transparent accident data management also presents an innovative frontier.
Major Players in the Road Safety Software Ecosystem
- TRL
- TES
- RoadSafe GIS Inc.
- VIA
- Buchanan Computing Ltd
- AgileAssets
- Brighton & Hove City Council
- DXD Group Ltd
Key Developments in Road Safety Software Industry
- 2023: TRL launches an advanced AI platform for predictive accident analysis, utilizing machine learning for enhanced risk identification.
- 2023: VIA partners with a major telematics provider to integrate real-time data into its street monitoring solutions, enhancing incident detection capabilities.
- 2024: Brighton & Hove City Council reports a 15% reduction in minor traffic incidents following the full implementation of its cloud-based road safety management system.
- 2024: RoadSafe GIS Inc. releases a new module for its platform focused on analyzing pedestrian and cyclist safety, using advanced geospatial data.
- 2024: AgileAssets secures a multi-year contract valued at 500 million to provide its asset management software to a consortium of European highway authorities.
- 2025: TES announces the development of an IoT-enabled system for real-time bridge integrity monitoring, expanding its infrastructure safety offerings.
- 2025: Buchanan Computing Ltd introduces a new feature for its traffic data analysis software, enabling enhanced simulation of traffic calming measures.
Strategic Road Safety Software Market Forecast
The strategic road safety software market forecast remains exceptionally strong, fueled by ongoing technological innovation and a global imperative to enhance public safety. The continued evolution of AI and IoT, coupled with an increasing reliance on data-driven decision-making, will drive sustained growth. Smart city initiatives and the push for autonomous vehicle integration represent significant future opportunities. The projected market size is expected to surpass 150 billion by 2033, with a CAGR of over 12 billion, underscoring the vital role of these solutions in creating safer, more efficient transportation networks worldwide. The focus on predictive analytics and proactive interventions will continue to be a key differentiator and growth catalyst.
Road Safety Software Segmentation
-
1. Application
- 1.1. Accident Analysis
- 1.2. Street Monitoring and Auditing
-
2. Types
- 2.1. On-premise
- 2.2. Cloud-based
Road Safety Software Segmentation By Geography
-
1. North America
- 1.1. United States
- 1.2. Canada
- 1.3. Mexico
-
2. South America
- 2.1. Brazil
- 2.2. Argentina
- 2.3. Rest of South America
-
3. Europe
- 3.1. United Kingdom
- 3.2. Germany
- 3.3. France
- 3.4. Italy
- 3.5. Spain
- 3.6. Russia
- 3.7. Benelux
- 3.8. Nordics
- 3.9. Rest of Europe
-
4. Middle East & Africa
- 4.1. Turkey
- 4.2. Israel
- 4.3. GCC
- 4.4. North Africa
- 4.5. South Africa
- 4.6. Rest of Middle East & Africa
-
5. Asia Pacific
- 5.1. China
- 5.2. India
- 5.3. Japan
- 5.4. South Korea
- 5.5. ASEAN
- 5.6. Oceania
- 5.7. Rest of Asia Pacific

Road Safety Software Regional Market Share
Geographic Coverage of Road Safety Software
Road Safety Software REPORT HIGHLIGHTS
| Aspects | Details |
|---|---|
| Study Period | 2020-2034 |
| Base Year | 2025 |
| Estimated Year | 2026 |
| Forecast Period | 2026-2034 |
| Historical Period | 2020-2025 |
| Growth Rate | CAGR of 9.6% from 2020-2034 |
| Segmentation |
|
Table of Contents
- 1. Introduction
- 1.1. Research Scope
- 1.2. Market Segmentation
- 1.3. Research Methodology
- 1.4. Definitions and Assumptions
- 2. Executive Summary
- 2.1. Introduction
- 3. Market Dynamics
- 3.1. Introduction
- 3.2. Market Drivers
- 3.3. Market Restrains
- 3.4. Market Trends
- 4. Market Factor Analysis
- 4.1. Porters Five Forces
- 4.2. Supply/Value Chain
- 4.3. PESTEL analysis
- 4.4. Market Entropy
- 4.5. Patent/Trademark Analysis
- 5. Global Road Safety Software Analysis, Insights and Forecast, 2020-2032
- 5.1. Market Analysis, Insights and Forecast - by Application
- 5.1.1. Accident Analysis
- 5.1.2. Street Monitoring and Auditing
- 5.2. Market Analysis, Insights and Forecast - by Types
- 5.2.1. On-premise
- 5.2.2. Cloud-based
- 5.3. Market Analysis, Insights and Forecast - by Region
- 5.3.1. North America
- 5.3.2. South America
- 5.3.3. Europe
- 5.3.4. Middle East & Africa
- 5.3.5. Asia Pacific
- 5.1. Market Analysis, Insights and Forecast - by Application
- 6. North America Road Safety Software Analysis, Insights and Forecast, 2020-2032
- 6.1. Market Analysis, Insights and Forecast - by Application
- 6.1.1. Accident Analysis
- 6.1.2. Street Monitoring and Auditing
- 6.2. Market Analysis, Insights and Forecast - by Types
- 6.2.1. On-premise
- 6.2.2. Cloud-based
- 6.1. Market Analysis, Insights and Forecast - by Application
- 7. South America Road Safety Software Analysis, Insights and Forecast, 2020-2032
- 7.1. Market Analysis, Insights and Forecast - by Application
- 7.1.1. Accident Analysis
- 7.1.2. Street Monitoring and Auditing
- 7.2. Market Analysis, Insights and Forecast - by Types
- 7.2.1. On-premise
- 7.2.2. Cloud-based
- 7.1. Market Analysis, Insights and Forecast - by Application
- 8. Europe Road Safety Software Analysis, Insights and Forecast, 2020-2032
- 8.1. Market Analysis, Insights and Forecast - by Application
- 8.1.1. Accident Analysis
- 8.1.2. Street Monitoring and Auditing
- 8.2. Market Analysis, Insights and Forecast - by Types
- 8.2.1. On-premise
- 8.2.2. Cloud-based
- 8.1. Market Analysis, Insights and Forecast - by Application
- 9. Middle East & Africa Road Safety Software Analysis, Insights and Forecast, 2020-2032
- 9.1. Market Analysis, Insights and Forecast - by Application
- 9.1.1. Accident Analysis
- 9.1.2. Street Monitoring and Auditing
- 9.2. Market Analysis, Insights and Forecast - by Types
- 9.2.1. On-premise
- 9.2.2. Cloud-based
- 9.1. Market Analysis, Insights and Forecast - by Application
- 10. Asia Pacific Road Safety Software Analysis, Insights and Forecast, 2020-2032
- 10.1. Market Analysis, Insights and Forecast - by Application
- 10.1.1. Accident Analysis
- 10.1.2. Street Monitoring and Auditing
- 10.2. Market Analysis, Insights and Forecast - by Types
- 10.2.1. On-premise
- 10.2.2. Cloud-based
- 10.1. Market Analysis, Insights and Forecast - by Application
- 11. Competitive Analysis
- 11.1. Global Market Share Analysis 2025
- 11.2. Company Profiles
- 11.2.1 TRL
- 11.2.1.1. Overview
- 11.2.1.2. Products
- 11.2.1.3. SWOT Analysis
- 11.2.1.4. Recent Developments
- 11.2.1.5. Financials (Based on Availability)
- 11.2.2 TES
- 11.2.2.1. Overview
- 11.2.2.2. Products
- 11.2.2.3. SWOT Analysis
- 11.2.2.4. Recent Developments
- 11.2.2.5. Financials (Based on Availability)
- 11.2.3 RoadSafe GIS Inc.
- 11.2.3.1. Overview
- 11.2.3.2. Products
- 11.2.3.3. SWOT Analysis
- 11.2.3.4. Recent Developments
- 11.2.3.5. Financials (Based on Availability)
- 11.2.4 VIA
- 11.2.4.1. Overview
- 11.2.4.2. Products
- 11.2.4.3. SWOT Analysis
- 11.2.4.4. Recent Developments
- 11.2.4.5. Financials (Based on Availability)
- 11.2.5 Buchanan Computing Ltd
- 11.2.5.1. Overview
- 11.2.5.2. Products
- 11.2.5.3. SWOT Analysis
- 11.2.5.4. Recent Developments
- 11.2.5.5. Financials (Based on Availability)
- 11.2.6 AgileAssets
- 11.2.6.1. Overview
- 11.2.6.2. Products
- 11.2.6.3. SWOT Analysis
- 11.2.6.4. Recent Developments
- 11.2.6.5. Financials (Based on Availability)
- 11.2.7 Brighton & Hove City Council
- 11.2.7.1. Overview
- 11.2.7.2. Products
- 11.2.7.3. SWOT Analysis
- 11.2.7.4. Recent Developments
- 11.2.7.5. Financials (Based on Availability)
- 11.2.8 DXD Group Ltd
- 11.2.8.1. Overview
- 11.2.8.2. Products
- 11.2.8.3. SWOT Analysis
- 11.2.8.4. Recent Developments
- 11.2.8.5. Financials (Based on Availability)
- 11.2.1 TRL
List of Figures
- Figure 1: Global Road Safety Software Revenue Breakdown (undefined, %) by Region 2025 & 2033
- Figure 2: North America Road Safety Software Revenue (undefined), by Application 2025 & 2033
- Figure 3: North America Road Safety Software Revenue Share (%), by Application 2025 & 2033
- Figure 4: North America Road Safety Software Revenue (undefined), by Types 2025 & 2033
- Figure 5: North America Road Safety Software Revenue Share (%), by Types 2025 & 2033
- Figure 6: North America Road Safety Software Revenue (undefined), by Country 2025 & 2033
- Figure 7: North America Road Safety Software Revenue Share (%), by Country 2025 & 2033
- Figure 8: South America Road Safety Software Revenue (undefined), by Application 2025 & 2033
- Figure 9: South America Road Safety Software Revenue Share (%), by Application 2025 & 2033
- Figure 10: South America Road Safety Software Revenue (undefined), by Types 2025 & 2033
- Figure 11: South America Road Safety Software Revenue Share (%), by Types 2025 & 2033
- Figure 12: South America Road Safety Software Revenue (undefined), by Country 2025 & 2033
- Figure 13: South America Road Safety Software Revenue Share (%), by Country 2025 & 2033
- Figure 14: Europe Road Safety Software Revenue (undefined), by Application 2025 & 2033
- Figure 15: Europe Road Safety Software Revenue Share (%), by Application 2025 & 2033
- Figure 16: Europe Road Safety Software Revenue (undefined), by Types 2025 & 2033
- Figure 17: Europe Road Safety Software Revenue Share (%), by Types 2025 & 2033
- Figure 18: Europe Road Safety Software Revenue (undefined), by Country 2025 & 2033
- Figure 19: Europe Road Safety Software Revenue Share (%), by Country 2025 & 2033
- Figure 20: Middle East & Africa Road Safety Software Revenue (undefined), by Application 2025 & 2033
- Figure 21: Middle East & Africa Road Safety Software Revenue Share (%), by Application 2025 & 2033
- Figure 22: Middle East & Africa Road Safety Software Revenue (undefined), by Types 2025 & 2033
- Figure 23: Middle East & Africa Road Safety Software Revenue Share (%), by Types 2025 & 2033
- Figure 24: Middle East & Africa Road Safety Software Revenue (undefined), by Country 2025 & 2033
- Figure 25: Middle East & Africa Road Safety Software Revenue Share (%), by Country 2025 & 2033
- Figure 26: Asia Pacific Road Safety Software Revenue (undefined), by Application 2025 & 2033
- Figure 27: Asia Pacific Road Safety Software Revenue Share (%), by Application 2025 & 2033
- Figure 28: Asia Pacific Road Safety Software Revenue (undefined), by Types 2025 & 2033
- Figure 29: Asia Pacific Road Safety Software Revenue Share (%), by Types 2025 & 2033
- Figure 30: Asia Pacific Road Safety Software Revenue (undefined), by Country 2025 & 2033
- Figure 31: Asia Pacific Road Safety Software Revenue Share (%), by Country 2025 & 2033
List of Tables
- Table 1: Global Road Safety Software Revenue undefined Forecast, by Application 2020 & 2033
- Table 2: Global Road Safety Software Revenue undefined Forecast, by Types 2020 & 2033
- Table 3: Global Road Safety Software Revenue undefined Forecast, by Region 2020 & 2033
- Table 4: Global Road Safety Software Revenue undefined Forecast, by Application 2020 & 2033
- Table 5: Global Road Safety Software Revenue undefined Forecast, by Types 2020 & 2033
- Table 6: Global Road Safety Software Revenue undefined Forecast, by Country 2020 & 2033
- Table 7: United States Road Safety Software Revenue (undefined) Forecast, by Application 2020 & 2033
- Table 8: Canada Road Safety Software Revenue (undefined) Forecast, by Application 2020 & 2033
- Table 9: Mexico Road Safety Software Revenue (undefined) Forecast, by Application 2020 & 2033
- Table 10: Global Road Safety Software Revenue undefined Forecast, by Application 2020 & 2033
- Table 11: Global Road Safety Software Revenue undefined Forecast, by Types 2020 & 2033
- Table 12: Global Road Safety Software Revenue undefined Forecast, by Country 2020 & 2033
- Table 13: Brazil Road Safety Software Revenue (undefined) Forecast, by Application 2020 & 2033
- Table 14: Argentina Road Safety Software Revenue (undefined) Forecast, by Application 2020 & 2033
- Table 15: Rest of South America Road Safety Software Revenue (undefined) Forecast, by Application 2020 & 2033
- Table 16: Global Road Safety Software Revenue undefined Forecast, by Application 2020 & 2033
- Table 17: Global Road Safety Software Revenue undefined Forecast, by Types 2020 & 2033
- Table 18: Global Road Safety Software Revenue undefined Forecast, by Country 2020 & 2033
- Table 19: United Kingdom Road Safety Software Revenue (undefined) Forecast, by Application 2020 & 2033
- Table 20: Germany Road Safety Software Revenue (undefined) Forecast, by Application 2020 & 2033
- Table 21: France Road Safety Software Revenue (undefined) Forecast, by Application 2020 & 2033
- Table 22: Italy Road Safety Software Revenue (undefined) Forecast, by Application 2020 & 2033
- Table 23: Spain Road Safety Software Revenue (undefined) Forecast, by Application 2020 & 2033
- Table 24: Russia Road Safety Software Revenue (undefined) Forecast, by Application 2020 & 2033
- Table 25: Benelux Road Safety Software Revenue (undefined) Forecast, by Application 2020 & 2033
- Table 26: Nordics Road Safety Software Revenue (undefined) Forecast, by Application 2020 & 2033
- Table 27: Rest of Europe Road Safety Software Revenue (undefined) Forecast, by Application 2020 & 2033
- Table 28: Global Road Safety Software Revenue undefined Forecast, by Application 2020 & 2033
- Table 29: Global Road Safety Software Revenue undefined Forecast, by Types 2020 & 2033
- Table 30: Global Road Safety Software Revenue undefined Forecast, by Country 2020 & 2033
- Table 31: Turkey Road Safety Software Revenue (undefined) Forecast, by Application 2020 & 2033
- Table 32: Israel Road Safety Software Revenue (undefined) Forecast, by Application 2020 & 2033
- Table 33: GCC Road Safety Software Revenue (undefined) Forecast, by Application 2020 & 2033
- Table 34: North Africa Road Safety Software Revenue (undefined) Forecast, by Application 2020 & 2033
- Table 35: South Africa Road Safety Software Revenue (undefined) Forecast, by Application 2020 & 2033
- Table 36: Rest of Middle East & Africa Road Safety Software Revenue (undefined) Forecast, by Application 2020 & 2033
- Table 37: Global Road Safety Software Revenue undefined Forecast, by Application 2020 & 2033
- Table 38: Global Road Safety Software Revenue undefined Forecast, by Types 2020 & 2033
- Table 39: Global Road Safety Software Revenue undefined Forecast, by Country 2020 & 2033
- Table 40: China Road Safety Software Revenue (undefined) Forecast, by Application 2020 & 2033
- Table 41: India Road Safety Software Revenue (undefined) Forecast, by Application 2020 & 2033
- Table 42: Japan Road Safety Software Revenue (undefined) Forecast, by Application 2020 & 2033
- Table 43: South Korea Road Safety Software Revenue (undefined) Forecast, by Application 2020 & 2033
- Table 44: ASEAN Road Safety Software Revenue (undefined) Forecast, by Application 2020 & 2033
- Table 45: Oceania Road Safety Software Revenue (undefined) Forecast, by Application 2020 & 2033
- Table 46: Rest of Asia Pacific Road Safety Software Revenue (undefined) Forecast, by Application 2020 & 2033
Frequently Asked Questions
1. What is the projected Compound Annual Growth Rate (CAGR) of the Road Safety Software?
The projected CAGR is approximately 9.6%.
2. Which companies are prominent players in the Road Safety Software?
Key companies in the market include TRL, TES, RoadSafe GIS Inc., VIA, Buchanan Computing Ltd, AgileAssets, Brighton & Hove City Council, DXD Group Ltd.
3. What are the main segments of the Road Safety Software?
The market segments include Application, Types.
4. Can you provide details about the market size?
The market size is estimated to be USD XXX N/A as of 2022.
5. What are some drivers contributing to market growth?
N/A
6. What are the notable trends driving market growth?
N/A
7. Are there any restraints impacting market growth?
N/A
8. Can you provide examples of recent developments in the market?
N/A
9. What pricing options are available for accessing the report?
Pricing options include single-user, multi-user, and enterprise licenses priced at USD 4900.00, USD 7350.00, and USD 9800.00 respectively.
10. Is the market size provided in terms of value or volume?
The market size is provided in terms of value, measured in N/A.
11. Are there any specific market keywords associated with the report?
Yes, the market keyword associated with the report is "Road Safety Software," which aids in identifying and referencing the specific market segment covered.
12. How do I determine which pricing option suits my needs best?
The pricing options vary based on user requirements and access needs. Individual users may opt for single-user licenses, while businesses requiring broader access may choose multi-user or enterprise licenses for cost-effective access to the report.
13. Are there any additional resources or data provided in the Road Safety Software report?
While the report offers comprehensive insights, it's advisable to review the specific contents or supplementary materials provided to ascertain if additional resources or data are available.
14. How can I stay updated on further developments or reports in the Road Safety Software?
To stay informed about further developments, trends, and reports in the Road Safety Software, consider subscribing to industry newsletters, following relevant companies and organizations, or regularly checking reputable industry news sources and publications.
Methodology
Step 1 - Identification of Relevant Samples Size from Population Database


Step 2 - Approaches for Defining Global Market Size (Value, Volume* & Price*)

Note*: In applicable scenarios
Step 3 - Data Sources
Primary Research
- Web Analytics
- Survey Reports
- Research Institute
- Latest Research Reports
- Opinion Leaders
Secondary Research
- Annual Reports
- White Paper
- Latest Press Release
- Industry Association
- Paid Database
- Investor Presentations

Step 4 - Data Triangulation
Involves using different sources of information in order to increase the validity of a study
These sources are likely to be stakeholders in a program - participants, other researchers, program staff, other community members, and so on.
Then we put all data in single framework & apply various statistical tools to find out the dynamic on the market.
During the analysis stage, feedback from the stakeholder groups would be compared to determine areas of agreement as well as areas of divergence