

Key Insights
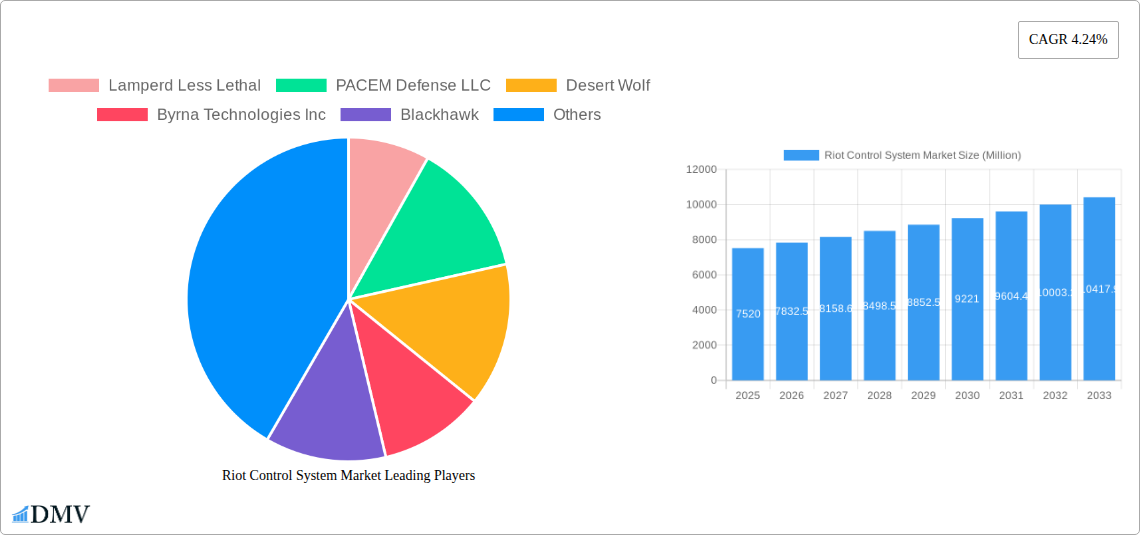
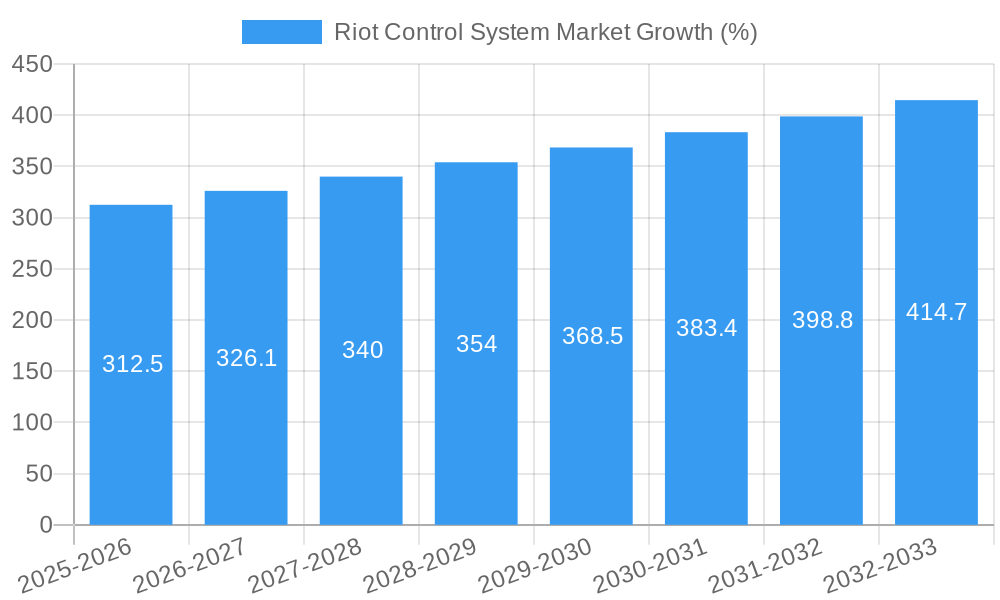
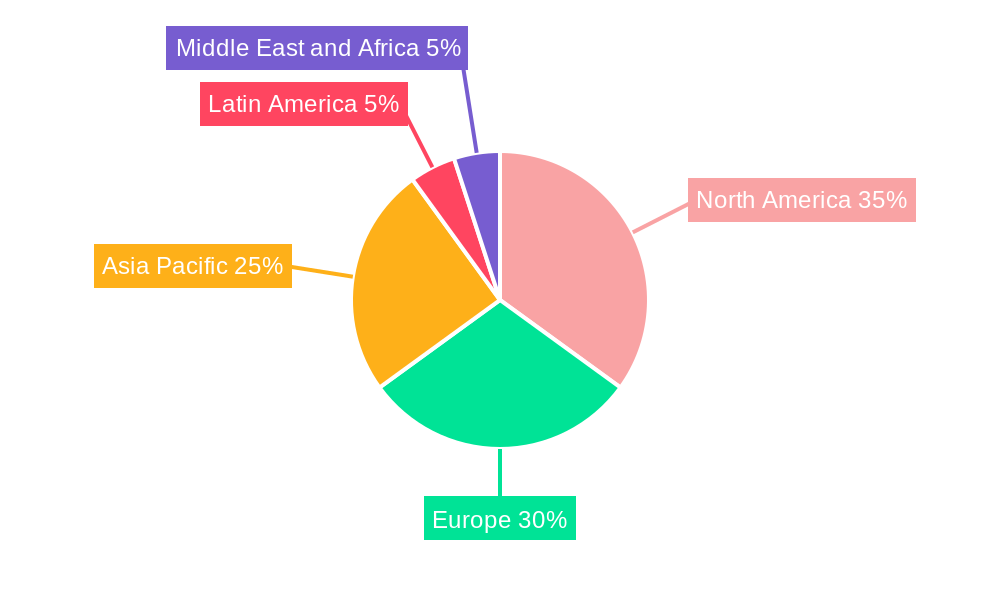
The global riot control systems market, valued at $7.52 billion in 2025, is projected to experience robust growth, driven by a compound annual growth rate (CAGR) of 4.24% from 2025 to 2033. This growth is fueled by increasing global civil unrest, terrorism concerns, and the need for law enforcement agencies to maintain order and public safety effectively. Demand is particularly strong for non-lethal options, reflecting a societal shift towards minimizing casualties during crowd control operations. The market is segmented by product type, encompassing personal protective equipment, shields, area denial systems (anti-vehicle and anti-personnel), various ammunition types (rubber, wax, plastic bullets, bean bag rounds, sponge grenades), and explosives (flashbang and sting grenades). Gases and sprays, including water cannons, scent-based weapons, tear gas, and pepper spray, also constitute significant market segments. End-users primarily include law enforcement agencies and special forces globally. Regional analysis indicates a substantial market share for North America and Europe, driven by higher budgets and technological advancements in these regions. However, the Asia-Pacific region is expected to witness significant growth in the coming years, driven by increasing urbanization and rising instances of civil unrest.
Technological advancements are a key driver, with manufacturers constantly innovating to create more effective, precise, and less harmful riot control tools. This includes the development of smart technologies for improved targeting and data analysis, enhancing operational efficiency and minimizing collateral damage. However, the market faces certain restraints, including ethical concerns surrounding the use of certain riot control technologies, stringent regulations governing their deployment, and the potential for misuse. The increasing focus on human rights and the need for accountability in the use of force also present challenges for the industry. Despite these challenges, the market is expected to continue its upward trajectory, driven by the persistent need for effective crowd control measures and the continuous development of innovative and safer riot control technologies. The diverse range of products and end-users ensures the market's resilience and continued expansion throughout the forecast period.
Riot Control System Market: A Comprehensive Market Report (2019-2033)
This insightful report provides a detailed analysis of the Riot Control System Market, offering a comprehensive overview of market trends, leading players, and future growth prospects. Covering the period from 2019 to 2033, with a base year of 2025 and a forecast period of 2025-2033, this report is essential for stakeholders seeking to understand and capitalize on opportunities within this dynamic sector. The market is projected to reach xx Million by 2033, driven by factors such as increasing global unrest and technological advancements in non-lethal weaponry.
Riot Control System Market Composition & Trends
This section delves into the intricate structure of the Riot Control System Market, exploring key aspects driving its evolution. We analyze market concentration, revealing the dominance of key players and their respective market share. Innovation catalysts, such as the development of more precise and less lethal weaponry, are examined alongside the evolving regulatory landscape that shapes product development and deployment. The report also investigates substitute products and their impact on market dynamics, providing a comprehensive view of the competitive landscape. End-user profiles, including law enforcement agencies and special forces, are analyzed to understand their specific needs and purchasing behaviors. Finally, we delve into the landscape of mergers and acquisitions (M&A) within the industry, providing insights into deal values and their strategic implications.
- Market Concentration: The market exhibits a moderately concentrated structure, with the top five players accounting for approximately xx% of the global market share in 2024.
- M&A Activity: The historical period (2019-2024) witnessed xx M&A deals, with a total value of approximately xx Million. These transactions primarily involved the consolidation of smaller players by larger established entities.
- Regulatory Landscape: Stringent regulations regarding the use and export of riot control equipment influence market growth and shape product development.
- Substitute Products: The emergence of alternative crowd control methods (e.g., advanced communication strategies, community engagement programs) presents a degree of substitution, albeit with limited impact on the core market.
Riot Control System Market Industry Evolution
This in-depth analysis explores the historical and projected growth trajectories of the Riot Control System Market. We examine technological advancements, such as the integration of AI and drone technology into riot control systems, and their impact on market dynamics. Shifting consumer demands—a move towards less lethal, more precise options—are meticulously analyzed, along with their implications for product development and marketing strategies. Detailed data points on growth rates and adoption metrics across different product segments are presented, offering a comprehensive understanding of market evolution. The report examines the impact of global events and socio-political instability on market demand, including specific instances like the increase in demand following major protests. The Iranian police’s USD 10 Million investment in anti-riot equipment in June 2022 exemplifies the impact of social unrest on market growth. The market is projected to experience a Compound Annual Growth Rate (CAGR) of xx% during the forecast period (2025-2033).
Leading Regions, Countries, or Segments in Riot Control System Market
This section identifies the dominant regions, countries, and product segments within the Riot Control System Market. The analysis considers factors such as market size, growth rate, and key market drivers specific to each segment.
- Dominant Region: North America currently holds the largest market share, driven by robust government spending on security and law enforcement.
- Key Segments:
- Product Type: Personal Protective Equipment (PPE) enjoys significant market share due to its widespread adoption across various law enforcement agencies.
- Ammunition: Rubber bullets and bean bag rounds remain dominant, while the demand for less-lethal options like sponge grenades is increasing.
- End-User: Law enforcement agencies represent the largest end-user segment globally.
Key Drivers:
- High levels of government investment in security infrastructure, particularly in regions experiencing political instability.
- Stringent regulations and increasing awareness of the need for less-lethal crowd control methods are stimulating the market.
- The rising adoption of advanced technologies, such as drone-based tear gas delivery systems.
The dominance of certain segments is largely attributed to higher government expenditure, consistent demand from law enforcement agencies, and ongoing innovation in product design to minimize potential harm to protestors or civilians while maintaining crowd control efficacy.
Riot Control System Market Product Innovations
Recent innovations focus on enhancing the precision and minimizing the lethality of riot control systems. This includes the development of advanced non-lethal ammunition types, smart shields incorporating technological features, and improved gas dispersal systems designed to target specific areas effectively while minimizing collateral impact. The integration of AI and data analytics for improved situational awareness and predictive deployment is also gaining traction, offering unique selling propositions to manufacturers and enhancing the overall effectiveness of riot control operations.
Propelling Factors for Riot Control System Market Growth
Several factors fuel the growth of the Riot Control System Market. Technological advancements like drone-based delivery systems (as seen with BSF's launch in September 2022) and the development of more precise less-lethal weapons are major drivers. Growing global political instability and social unrest contribute significantly to increased demand, evident in the Iranian police's USD 10 Million investment in June 2022. Government initiatives and funding towards security and law enforcement further stimulate market expansion.
Obstacles in the Riot Control System Market
Several factors hinder market growth. Stricter regulations concerning the use and export of riot control equipment create hurdles for manufacturers. Supply chain disruptions and geopolitical instability can affect the availability of raw materials and components. Intense competition among established and emerging players creates price pressures and limits profit margins. The ethical concerns surrounding the use of riot control technologies also presents a major obstacle for market growth.
Future Opportunities in Riot Control System Market
The future holds significant opportunities. Emerging markets in developing countries experiencing growing unrest are attractive avenues for expansion. Technological innovations, such as smart ammunition with improved precision and integrated sensors, present promising growth areas. The increasing focus on less-lethal crowd control methods aligns with growing societal demands for more humane and responsible crowd management techniques.
Major Players in the Riot Control System Market Ecosystem
- Lamperd Less Lethal
- PACEM Defense LLC
- Desert Wolf
- Byrna Technologies Inc
- Blackhawk
- NonLethal Technologies Inc
- Axon Enterprise Inc
- Genasys Inc
- Etienne Lacroix Group
- Condor Non-lethal Technologies
- Combined Systems Inc
- Safariland LLC
Key Developments in Riot Control System Market Industry
- September 2022: BSF launched a tear gas shell-dropping drone system, signifying the integration of advanced technology into riot control operations. This development enhances operational reach and potentially reduces risk to personnel.
- June 2022: The Iranian police invested nearly USD 10 Million in anti-riot equipment, reflecting the increasing demand for such systems in regions experiencing civil unrest. This highlights the significant impact of geopolitical events on market growth.
Strategic Riot Control System Market Forecast
The Riot Control System Market is poised for substantial growth, driven by escalating global instability and technological innovation. The increasing adoption of less-lethal technologies, coupled with governmental investments in security infrastructure, will further propel market expansion. The integration of AI and drone technology presents significant opportunities for enhancing the effectiveness and precision of riot control systems in the coming years. Continued focus on minimizing civilian harm and promoting responsible use of these technologies will be crucial for sustained, ethical market growth.
Riot Control System Market Segmentation
-
1. Product Type
-
1.1. Personal Protective Equipment
- 1.1.1. Vests
- 1.1.2. Helmets
- 1.1.3. Gas Masks
- 1.1.4. Shields
-
1.2. Offensive Equipment
-
1.2.1. Area Denial
- 1.2.1.1. Anti-vehicle
- 1.2.1.2. Anti-personnel
-
1.2.2. Ammunition
- 1.2.2.1. Rubber Bullets
- 1.2.2.2. Wax Bullets
- 1.2.2.3. Plastic Bullets
- 1.2.2.4. Bean Bag Rounds
- 1.2.2.5. Sponge Grenade
-
1.2.3. Explosives
- 1.2.3.1. Flash Bang Grenades
- 1.2.3.2. Sting Grenades
-
1.2.4. Gases and Sprays
- 1.2.4.1. Water Canons
- 1.2.4.2. Scent-based Weapons
- 1.2.4.3. Tear Gas
- 1.2.4.4. Pepper Spray
- 1.2.5. Directed Energy Weapons
- 1.2.6. Electroshock Weapons
- 1.2.7. Other Offensive Equipment
-
1.2.1. Area Denial
-
1.1. Personal Protective Equipment
-
2. End-User
- 2.1. Law Enforcement
- 2.2. Special Forces
Riot Control System Market Segmentation By Geography
-
1. North America
- 1.1. United States
- 1.2. Canada
-
2. Europe
- 2.1. United Kingdom
- 2.2. France
- 2.3. Germany
- 2.4. Russia
- 2.5. Rest of Europe
-
3. Asia Pacific
- 3.1. China
- 3.2. India
- 3.3. Japan
- 3.4. South Korea
- 3.5. Rest of Asia Pacific
-
4. Latin America
- 4.1. Brazil
- 4.2. Rest of Latin America
-
5. Middle East and Africa
- 5.1. Saudi Arabia
- 5.2. United Arab Emirates
- 5.3. Israel
- 5.4. Rest of Middle East and Africa
Riot Control System Market REPORT HIGHLIGHTS
| Aspects | Details |
|---|---|
| Study Period | 2019-2033 |
| Base Year | 2024 |
| Estimated Year | 2025 |
| Forecast Period | 2025-2033 |
| Historical Period | 2019-2024 |
| Growth Rate | CAGR of 4.24% from 2019-2033 |
| Segmentation |
|
Table of Contents
- 1. Introduction
- 1.1. Research Scope
- 1.2. Market Segmentation
- 1.3. Research Methodology
- 1.4. Definitions and Assumptions
- 2. Executive Summary
- 2.1. Introduction
- 3. Market Dynamics
- 3.1. Introduction
- 3.2. Market Drivers
- 3.3. Market Restrains
- 3.4. Market Trends
- 3.4.1. The Offensive Equipment Segment is Expected to Experience the Highest Growth During the Forecast Period
- 4. Market Factor Analysis
- 4.1. Porters Five Forces
- 4.2. Supply/Value Chain
- 4.3. PESTEL analysis
- 4.4. Market Entropy
- 4.5. Patent/Trademark Analysis
- 5. Global Riot Control System Market Analysis, Insights and Forecast, 2019-2031
- 5.1. Market Analysis, Insights and Forecast - by Product Type
- 5.1.1. Personal Protective Equipment
- 5.1.1.1. Vests
- 5.1.1.2. Helmets
- 5.1.1.3. Gas Masks
- 5.1.1.4. Shields
- 5.1.2. Offensive Equipment
- 5.1.2.1. Area Denial
- 5.1.2.1.1. Anti-vehicle
- 5.1.2.1.2. Anti-personnel
- 5.1.2.2. Ammunition
- 5.1.2.2.1. Rubber Bullets
- 5.1.2.2.2. Wax Bullets
- 5.1.2.2.3. Plastic Bullets
- 5.1.2.2.4. Bean Bag Rounds
- 5.1.2.2.5. Sponge Grenade
- 5.1.2.3. Explosives
- 5.1.2.3.1. Flash Bang Grenades
- 5.1.2.3.2. Sting Grenades
- 5.1.2.4. Gases and Sprays
- 5.1.2.4.1. Water Canons
- 5.1.2.4.2. Scent-based Weapons
- 5.1.2.4.3. Tear Gas
- 5.1.2.4.4. Pepper Spray
- 5.1.2.5. Directed Energy Weapons
- 5.1.2.6. Electroshock Weapons
- 5.1.2.7. Other Offensive Equipment
- 5.1.2.1. Area Denial
- 5.1.1. Personal Protective Equipment
- 5.2. Market Analysis, Insights and Forecast - by End-User
- 5.2.1. Law Enforcement
- 5.2.2. Special Forces
- 5.3. Market Analysis, Insights and Forecast - by Region
- 5.3.1. North America
- 5.3.2. Europe
- 5.3.3. Asia Pacific
- 5.3.4. Latin America
- 5.3.5. Middle East and Africa
- 5.1. Market Analysis, Insights and Forecast - by Product Type
- 6. North America Riot Control System Market Analysis, Insights and Forecast, 2019-2031
- 6.1. Market Analysis, Insights and Forecast - by Product Type
- 6.1.1. Personal Protective Equipment
- 6.1.1.1. Vests
- 6.1.1.2. Helmets
- 6.1.1.3. Gas Masks
- 6.1.1.4. Shields
- 6.1.2. Offensive Equipment
- 6.1.2.1. Area Denial
- 6.1.2.1.1. Anti-vehicle
- 6.1.2.1.2. Anti-personnel
- 6.1.2.2. Ammunition
- 6.1.2.2.1. Rubber Bullets
- 6.1.2.2.2. Wax Bullets
- 6.1.2.2.3. Plastic Bullets
- 6.1.2.2.4. Bean Bag Rounds
- 6.1.2.2.5. Sponge Grenade
- 6.1.2.3. Explosives
- 6.1.2.3.1. Flash Bang Grenades
- 6.1.2.3.2. Sting Grenades
- 6.1.2.4. Gases and Sprays
- 6.1.2.4.1. Water Canons
- 6.1.2.4.2. Scent-based Weapons
- 6.1.2.4.3. Tear Gas
- 6.1.2.4.4. Pepper Spray
- 6.1.2.5. Directed Energy Weapons
- 6.1.2.6. Electroshock Weapons
- 6.1.2.7. Other Offensive Equipment
- 6.1.2.1. Area Denial
- 6.1.1. Personal Protective Equipment
- 6.2. Market Analysis, Insights and Forecast - by End-User
- 6.2.1. Law Enforcement
- 6.2.2. Special Forces
- 6.1. Market Analysis, Insights and Forecast - by Product Type
- 7. Europe Riot Control System Market Analysis, Insights and Forecast, 2019-2031
- 7.1. Market Analysis, Insights and Forecast - by Product Type
- 7.1.1. Personal Protective Equipment
- 7.1.1.1. Vests
- 7.1.1.2. Helmets
- 7.1.1.3. Gas Masks
- 7.1.1.4. Shields
- 7.1.2. Offensive Equipment
- 7.1.2.1. Area Denial
- 7.1.2.1.1. Anti-vehicle
- 7.1.2.1.2. Anti-personnel
- 7.1.2.2. Ammunition
- 7.1.2.2.1. Rubber Bullets
- 7.1.2.2.2. Wax Bullets
- 7.1.2.2.3. Plastic Bullets
- 7.1.2.2.4. Bean Bag Rounds
- 7.1.2.2.5. Sponge Grenade
- 7.1.2.3. Explosives
- 7.1.2.3.1. Flash Bang Grenades
- 7.1.2.3.2. Sting Grenades
- 7.1.2.4. Gases and Sprays
- 7.1.2.4.1. Water Canons
- 7.1.2.4.2. Scent-based Weapons
- 7.1.2.4.3. Tear Gas
- 7.1.2.4.4. Pepper Spray
- 7.1.2.5. Directed Energy Weapons
- 7.1.2.6. Electroshock Weapons
- 7.1.2.7. Other Offensive Equipment
- 7.1.2.1. Area Denial
- 7.1.1. Personal Protective Equipment
- 7.2. Market Analysis, Insights and Forecast - by End-User
- 7.2.1. Law Enforcement
- 7.2.2. Special Forces
- 7.1. Market Analysis, Insights and Forecast - by Product Type
- 8. Asia Pacific Riot Control System Market Analysis, Insights and Forecast, 2019-2031
- 8.1. Market Analysis, Insights and Forecast - by Product Type
- 8.1.1. Personal Protective Equipment
- 8.1.1.1. Vests
- 8.1.1.2. Helmets
- 8.1.1.3. Gas Masks
- 8.1.1.4. Shields
- 8.1.2. Offensive Equipment
- 8.1.2.1. Area Denial
- 8.1.2.1.1. Anti-vehicle
- 8.1.2.1.2. Anti-personnel
- 8.1.2.2. Ammunition
- 8.1.2.2.1. Rubber Bullets
- 8.1.2.2.2. Wax Bullets
- 8.1.2.2.3. Plastic Bullets
- 8.1.2.2.4. Bean Bag Rounds
- 8.1.2.2.5. Sponge Grenade
- 8.1.2.3. Explosives
- 8.1.2.3.1. Flash Bang Grenades
- 8.1.2.3.2. Sting Grenades
- 8.1.2.4. Gases and Sprays
- 8.1.2.4.1. Water Canons
- 8.1.2.4.2. Scent-based Weapons
- 8.1.2.4.3. Tear Gas
- 8.1.2.4.4. Pepper Spray
- 8.1.2.5. Directed Energy Weapons
- 8.1.2.6. Electroshock Weapons
- 8.1.2.7. Other Offensive Equipment
- 8.1.2.1. Area Denial
- 8.1.1. Personal Protective Equipment
- 8.2. Market Analysis, Insights and Forecast - by End-User
- 8.2.1. Law Enforcement
- 8.2.2. Special Forces
- 8.1. Market Analysis, Insights and Forecast - by Product Type
- 9. Latin America Riot Control System Market Analysis, Insights and Forecast, 2019-2031
- 9.1. Market Analysis, Insights and Forecast - by Product Type
- 9.1.1. Personal Protective Equipment
- 9.1.1.1. Vests
- 9.1.1.2. Helmets
- 9.1.1.3. Gas Masks
- 9.1.1.4. Shields
- 9.1.2. Offensive Equipment
- 9.1.2.1. Area Denial
- 9.1.2.1.1. Anti-vehicle
- 9.1.2.1.2. Anti-personnel
- 9.1.2.2. Ammunition
- 9.1.2.2.1. Rubber Bullets
- 9.1.2.2.2. Wax Bullets
- 9.1.2.2.3. Plastic Bullets
- 9.1.2.2.4. Bean Bag Rounds
- 9.1.2.2.5. Sponge Grenade
- 9.1.2.3. Explosives
- 9.1.2.3.1. Flash Bang Grenades
- 9.1.2.3.2. Sting Grenades
- 9.1.2.4. Gases and Sprays
- 9.1.2.4.1. Water Canons
- 9.1.2.4.2. Scent-based Weapons
- 9.1.2.4.3. Tear Gas
- 9.1.2.4.4. Pepper Spray
- 9.1.2.5. Directed Energy Weapons
- 9.1.2.6. Electroshock Weapons
- 9.1.2.7. Other Offensive Equipment
- 9.1.2.1. Area Denial
- 9.1.1. Personal Protective Equipment
- 9.2. Market Analysis, Insights and Forecast - by End-User
- 9.2.1. Law Enforcement
- 9.2.2. Special Forces
- 9.1. Market Analysis, Insights and Forecast - by Product Type
- 10. Middle East and Africa Riot Control System Market Analysis, Insights and Forecast, 2019-2031
- 10.1. Market Analysis, Insights and Forecast - by Product Type
- 10.1.1. Personal Protective Equipment
- 10.1.1.1. Vests
- 10.1.1.2. Helmets
- 10.1.1.3. Gas Masks
- 10.1.1.4. Shields
- 10.1.2. Offensive Equipment
- 10.1.2.1. Area Denial
- 10.1.2.1.1. Anti-vehicle
- 10.1.2.1.2. Anti-personnel
- 10.1.2.2. Ammunition
- 10.1.2.2.1. Rubber Bullets
- 10.1.2.2.2. Wax Bullets
- 10.1.2.2.3. Plastic Bullets
- 10.1.2.2.4. Bean Bag Rounds
- 10.1.2.2.5. Sponge Grenade
- 10.1.2.3. Explosives
- 10.1.2.3.1. Flash Bang Grenades
- 10.1.2.3.2. Sting Grenades
- 10.1.2.4. Gases and Sprays
- 10.1.2.4.1. Water Canons
- 10.1.2.4.2. Scent-based Weapons
- 10.1.2.4.3. Tear Gas
- 10.1.2.4.4. Pepper Spray
- 10.1.2.5. Directed Energy Weapons
- 10.1.2.6. Electroshock Weapons
- 10.1.2.7. Other Offensive Equipment
- 10.1.2.1. Area Denial
- 10.1.1. Personal Protective Equipment
- 10.2. Market Analysis, Insights and Forecast - by End-User
- 10.2.1. Law Enforcement
- 10.2.2. Special Forces
- 10.1. Market Analysis, Insights and Forecast - by Product Type
- 11. North America Riot Control System Market Analysis, Insights and Forecast, 2019-2031
- 11.1. Market Analysis, Insights and Forecast - By Country/Sub-region
- 11.1.1 United States
- 11.1.2 Canada
- 12. Europe Riot Control System Market Analysis, Insights and Forecast, 2019-2031
- 12.1. Market Analysis, Insights and Forecast - By Country/Sub-region
- 12.1.1 United Kingdom
- 12.1.2 France
- 12.1.3 Germany
- 12.1.4 Italy
- 12.1.5 Rest of Europe
- 13. Asia Pacific Riot Control System Market Analysis, Insights and Forecast, 2019-2031
- 13.1. Market Analysis, Insights and Forecast - By Country/Sub-region
- 13.1.1 China
- 13.1.2 India
- 13.1.3 Japan
- 13.1.4 South Korea
- 13.1.5 Rest of Asia Pacific
- 14. Latin America Riot Control System Market Analysis, Insights and Forecast, 2019-2031
- 14.1. Market Analysis, Insights and Forecast - By Country/Sub-region
- 14.1.1 Brazil
- 14.1.2 Mexico
- 14.1.3 Rest of Latin America
- 15. Middle East and Africa Riot Control System Market Analysis, Insights and Forecast, 2019-2031
- 15.1. Market Analysis, Insights and Forecast - By Country/Sub-region
- 15.1.1 Saudi Arabia
- 15.1.2 United Arab Emirates
- 15.1.3 South Africa
- 15.1.4 Qatar
- 15.1.5 Rest of Middle East and Africa
- 16. Competitive Analysis
- 16.1. Global Market Share Analysis 2024
- 16.2. Company Profiles
- 16.2.1 Lamperd Less Lethal
- 16.2.1.1. Overview
- 16.2.1.2. Products
- 16.2.1.3. SWOT Analysis
- 16.2.1.4. Recent Developments
- 16.2.1.5. Financials (Based on Availability)
- 16.2.2 PACEM Defense LLC
- 16.2.2.1. Overview
- 16.2.2.2. Products
- 16.2.2.3. SWOT Analysis
- 16.2.2.4. Recent Developments
- 16.2.2.5. Financials (Based on Availability)
- 16.2.3 Desert Wolf
- 16.2.3.1. Overview
- 16.2.3.2. Products
- 16.2.3.3. SWOT Analysis
- 16.2.3.4. Recent Developments
- 16.2.3.5. Financials (Based on Availability)
- 16.2.4 Byrna Technologies Inc
- 16.2.4.1. Overview
- 16.2.4.2. Products
- 16.2.4.3. SWOT Analysis
- 16.2.4.4. Recent Developments
- 16.2.4.5. Financials (Based on Availability)
- 16.2.5 Blackhawk
- 16.2.5.1. Overview
- 16.2.5.2. Products
- 16.2.5.3. SWOT Analysis
- 16.2.5.4. Recent Developments
- 16.2.5.5. Financials (Based on Availability)
- 16.2.6 NonLethal Technologies Inc
- 16.2.6.1. Overview
- 16.2.6.2. Products
- 16.2.6.3. SWOT Analysis
- 16.2.6.4. Recent Developments
- 16.2.6.5. Financials (Based on Availability)
- 16.2.7 Axon Enterprise Inc
- 16.2.7.1. Overview
- 16.2.7.2. Products
- 16.2.7.3. SWOT Analysis
- 16.2.7.4. Recent Developments
- 16.2.7.5. Financials (Based on Availability)
- 16.2.8 Genasys Inc
- 16.2.8.1. Overview
- 16.2.8.2. Products
- 16.2.8.3. SWOT Analysis
- 16.2.8.4. Recent Developments
- 16.2.8.5. Financials (Based on Availability)
- 16.2.9 Etienne Lacroix Group
- 16.2.9.1. Overview
- 16.2.9.2. Products
- 16.2.9.3. SWOT Analysis
- 16.2.9.4. Recent Developments
- 16.2.9.5. Financials (Based on Availability)
- 16.2.10 Condor Non-lethal Technologies
- 16.2.10.1. Overview
- 16.2.10.2. Products
- 16.2.10.3. SWOT Analysis
- 16.2.10.4. Recent Developments
- 16.2.10.5. Financials (Based on Availability)
- 16.2.11 Combined Systems Inc
- 16.2.11.1. Overview
- 16.2.11.2. Products
- 16.2.11.3. SWOT Analysis
- 16.2.11.4. Recent Developments
- 16.2.11.5. Financials (Based on Availability)
- 16.2.12 Safariland LLC
- 16.2.12.1. Overview
- 16.2.12.2. Products
- 16.2.12.3. SWOT Analysis
- 16.2.12.4. Recent Developments
- 16.2.12.5. Financials (Based on Availability)
- 16.2.1 Lamperd Less Lethal
List of Figures
- Figure 1: Global Riot Control System Market Revenue Breakdown (Million, %) by Region 2024 & 2032
- Figure 2: North America Riot Control System Market Revenue (Million), by Country 2024 & 2032
- Figure 3: North America Riot Control System Market Revenue Share (%), by Country 2024 & 2032
- Figure 4: Europe Riot Control System Market Revenue (Million), by Country 2024 & 2032
- Figure 5: Europe Riot Control System Market Revenue Share (%), by Country 2024 & 2032
- Figure 6: Asia Pacific Riot Control System Market Revenue (Million), by Country 2024 & 2032
- Figure 7: Asia Pacific Riot Control System Market Revenue Share (%), by Country 2024 & 2032
- Figure 8: Latin America Riot Control System Market Revenue (Million), by Country 2024 & 2032
- Figure 9: Latin America Riot Control System Market Revenue Share (%), by Country 2024 & 2032
- Figure 10: Middle East and Africa Riot Control System Market Revenue (Million), by Country 2024 & 2032
- Figure 11: Middle East and Africa Riot Control System Market Revenue Share (%), by Country 2024 & 2032
- Figure 12: North America Riot Control System Market Revenue (Million), by Product Type 2024 & 2032
- Figure 13: North America Riot Control System Market Revenue Share (%), by Product Type 2024 & 2032
- Figure 14: North America Riot Control System Market Revenue (Million), by End-User 2024 & 2032
- Figure 15: North America Riot Control System Market Revenue Share (%), by End-User 2024 & 2032
- Figure 16: North America Riot Control System Market Revenue (Million), by Country 2024 & 2032
- Figure 17: North America Riot Control System Market Revenue Share (%), by Country 2024 & 2032
- Figure 18: Europe Riot Control System Market Revenue (Million), by Product Type 2024 & 2032
- Figure 19: Europe Riot Control System Market Revenue Share (%), by Product Type 2024 & 2032
- Figure 20: Europe Riot Control System Market Revenue (Million), by End-User 2024 & 2032
- Figure 21: Europe Riot Control System Market Revenue Share (%), by End-User 2024 & 2032
- Figure 22: Europe Riot Control System Market Revenue (Million), by Country 2024 & 2032
- Figure 23: Europe Riot Control System Market Revenue Share (%), by Country 2024 & 2032
- Figure 24: Asia Pacific Riot Control System Market Revenue (Million), by Product Type 2024 & 2032
- Figure 25: Asia Pacific Riot Control System Market Revenue Share (%), by Product Type 2024 & 2032
- Figure 26: Asia Pacific Riot Control System Market Revenue (Million), by End-User 2024 & 2032
- Figure 27: Asia Pacific Riot Control System Market Revenue Share (%), by End-User 2024 & 2032
- Figure 28: Asia Pacific Riot Control System Market Revenue (Million), by Country 2024 & 2032
- Figure 29: Asia Pacific Riot Control System Market Revenue Share (%), by Country 2024 & 2032
- Figure 30: Latin America Riot Control System Market Revenue (Million), by Product Type 2024 & 2032
- Figure 31: Latin America Riot Control System Market Revenue Share (%), by Product Type 2024 & 2032
- Figure 32: Latin America Riot Control System Market Revenue (Million), by End-User 2024 & 2032
- Figure 33: Latin America Riot Control System Market Revenue Share (%), by End-User 2024 & 2032
- Figure 34: Latin America Riot Control System Market Revenue (Million), by Country 2024 & 2032
- Figure 35: Latin America Riot Control System Market Revenue Share (%), by Country 2024 & 2032
- Figure 36: Middle East and Africa Riot Control System Market Revenue (Million), by Product Type 2024 & 2032
- Figure 37: Middle East and Africa Riot Control System Market Revenue Share (%), by Product Type 2024 & 2032
- Figure 38: Middle East and Africa Riot Control System Market Revenue (Million), by End-User 2024 & 2032
- Figure 39: Middle East and Africa Riot Control System Market Revenue Share (%), by End-User 2024 & 2032
- Figure 40: Middle East and Africa Riot Control System Market Revenue (Million), by Country 2024 & 2032
- Figure 41: Middle East and Africa Riot Control System Market Revenue Share (%), by Country 2024 & 2032
List of Tables
- Table 1: Global Riot Control System Market Revenue Million Forecast, by Region 2019 & 2032
- Table 2: Global Riot Control System Market Revenue Million Forecast, by Product Type 2019 & 2032
- Table 3: Global Riot Control System Market Revenue Million Forecast, by End-User 2019 & 2032
- Table 4: Global Riot Control System Market Revenue Million Forecast, by Region 2019 & 2032
- Table 5: Global Riot Control System Market Revenue Million Forecast, by Country 2019 & 2032
- Table 6: United States Riot Control System Market Revenue (Million) Forecast, by Application 2019 & 2032
- Table 7: Canada Riot Control System Market Revenue (Million) Forecast, by Application 2019 & 2032
- Table 8: Global Riot Control System Market Revenue Million Forecast, by Country 2019 & 2032
- Table 9: United Kingdom Riot Control System Market Revenue (Million) Forecast, by Application 2019 & 2032
- Table 10: France Riot Control System Market Revenue (Million) Forecast, by Application 2019 & 2032
- Table 11: Germany Riot Control System Market Revenue (Million) Forecast, by Application 2019 & 2032
- Table 12: Italy Riot Control System Market Revenue (Million) Forecast, by Application 2019 & 2032
- Table 13: Rest of Europe Riot Control System Market Revenue (Million) Forecast, by Application 2019 & 2032
- Table 14: Global Riot Control System Market Revenue Million Forecast, by Country 2019 & 2032
- Table 15: China Riot Control System Market Revenue (Million) Forecast, by Application 2019 & 2032
- Table 16: India Riot Control System Market Revenue (Million) Forecast, by Application 2019 & 2032
- Table 17: Japan Riot Control System Market Revenue (Million) Forecast, by Application 2019 & 2032
- Table 18: South Korea Riot Control System Market Revenue (Million) Forecast, by Application 2019 & 2032
- Table 19: Rest of Asia Pacific Riot Control System Market Revenue (Million) Forecast, by Application 2019 & 2032
- Table 20: Global Riot Control System Market Revenue Million Forecast, by Country 2019 & 2032
- Table 21: Brazil Riot Control System Market Revenue (Million) Forecast, by Application 2019 & 2032
- Table 22: Mexico Riot Control System Market Revenue (Million) Forecast, by Application 2019 & 2032
- Table 23: Rest of Latin America Riot Control System Market Revenue (Million) Forecast, by Application 2019 & 2032
- Table 24: Global Riot Control System Market Revenue Million Forecast, by Country 2019 & 2032
- Table 25: Saudi Arabia Riot Control System Market Revenue (Million) Forecast, by Application 2019 & 2032
- Table 26: United Arab Emirates Riot Control System Market Revenue (Million) Forecast, by Application 2019 & 2032
- Table 27: South Africa Riot Control System Market Revenue (Million) Forecast, by Application 2019 & 2032
- Table 28: Qatar Riot Control System Market Revenue (Million) Forecast, by Application 2019 & 2032
- Table 29: Rest of Middle East and Africa Riot Control System Market Revenue (Million) Forecast, by Application 2019 & 2032
- Table 30: Global Riot Control System Market Revenue Million Forecast, by Product Type 2019 & 2032
- Table 31: Global Riot Control System Market Revenue Million Forecast, by End-User 2019 & 2032
- Table 32: Global Riot Control System Market Revenue Million Forecast, by Country 2019 & 2032
- Table 33: United States Riot Control System Market Revenue (Million) Forecast, by Application 2019 & 2032
- Table 34: Canada Riot Control System Market Revenue (Million) Forecast, by Application 2019 & 2032
- Table 35: Global Riot Control System Market Revenue Million Forecast, by Product Type 2019 & 2032
- Table 36: Global Riot Control System Market Revenue Million Forecast, by End-User 2019 & 2032
- Table 37: Global Riot Control System Market Revenue Million Forecast, by Country 2019 & 2032
- Table 38: United Kingdom Riot Control System Market Revenue (Million) Forecast, by Application 2019 & 2032
- Table 39: France Riot Control System Market Revenue (Million) Forecast, by Application 2019 & 2032
- Table 40: Germany Riot Control System Market Revenue (Million) Forecast, by Application 2019 & 2032
- Table 41: Russia Riot Control System Market Revenue (Million) Forecast, by Application 2019 & 2032
- Table 42: Rest of Europe Riot Control System Market Revenue (Million) Forecast, by Application 2019 & 2032
- Table 43: Global Riot Control System Market Revenue Million Forecast, by Product Type 2019 & 2032
- Table 44: Global Riot Control System Market Revenue Million Forecast, by End-User 2019 & 2032
- Table 45: Global Riot Control System Market Revenue Million Forecast, by Country 2019 & 2032
- Table 46: China Riot Control System Market Revenue (Million) Forecast, by Application 2019 & 2032
- Table 47: India Riot Control System Market Revenue (Million) Forecast, by Application 2019 & 2032
- Table 48: Japan Riot Control System Market Revenue (Million) Forecast, by Application 2019 & 2032
- Table 49: South Korea Riot Control System Market Revenue (Million) Forecast, by Application 2019 & 2032
- Table 50: Rest of Asia Pacific Riot Control System Market Revenue (Million) Forecast, by Application 2019 & 2032
- Table 51: Global Riot Control System Market Revenue Million Forecast, by Product Type 2019 & 2032
- Table 52: Global Riot Control System Market Revenue Million Forecast, by End-User 2019 & 2032
- Table 53: Global Riot Control System Market Revenue Million Forecast, by Country 2019 & 2032
- Table 54: Brazil Riot Control System Market Revenue (Million) Forecast, by Application 2019 & 2032
- Table 55: Rest of Latin America Riot Control System Market Revenue (Million) Forecast, by Application 2019 & 2032
- Table 56: Global Riot Control System Market Revenue Million Forecast, by Product Type 2019 & 2032
- Table 57: Global Riot Control System Market Revenue Million Forecast, by End-User 2019 & 2032
- Table 58: Global Riot Control System Market Revenue Million Forecast, by Country 2019 & 2032
- Table 59: Saudi Arabia Riot Control System Market Revenue (Million) Forecast, by Application 2019 & 2032
- Table 60: United Arab Emirates Riot Control System Market Revenue (Million) Forecast, by Application 2019 & 2032
- Table 61: Israel Riot Control System Market Revenue (Million) Forecast, by Application 2019 & 2032
- Table 62: Rest of Middle East and Africa Riot Control System Market Revenue (Million) Forecast, by Application 2019 & 2032
Frequently Asked Questions
1. What is the projected Compound Annual Growth Rate (CAGR) of the Riot Control System Market?
The projected CAGR is approximately 4.24%.
2. Which companies are prominent players in the Riot Control System Market?
Key companies in the market include Lamperd Less Lethal, PACEM Defense LLC, Desert Wolf, Byrna Technologies Inc, Blackhawk, NonLethal Technologies Inc, Axon Enterprise Inc, Genasys Inc, Etienne Lacroix Group, Condor Non-lethal Technologies, Combined Systems Inc, Safariland LLC.
3. What are the main segments of the Riot Control System Market?
The market segments include Product Type, End-User.
4. Can you provide details about the market size?
The market size is estimated to be USD 7.52 Million as of 2022.
5. What are some drivers contributing to market growth?
N/A
6. What are the notable trends driving market growth?
The Offensive Equipment Segment is Expected to Experience the Highest Growth During the Forecast Period.
7. Are there any restraints impacting market growth?
N/A
8. Can you provide examples of recent developments in the market?
September 2022: BSF launched a tear gas shell-dropping drone system that will be useful for security forces to control protesters and rioters. It can be used for launching shells from an unmanned aerial vehicle (UAV).
9. What pricing options are available for accessing the report?
Pricing options include single-user, multi-user, and enterprise licenses priced at USD 4750, USD 5250, and USD 8750 respectively.
10. Is the market size provided in terms of value or volume?
The market size is provided in terms of value, measured in Million.
11. Are there any specific market keywords associated with the report?
Yes, the market keyword associated with the report is "Riot Control System Market," which aids in identifying and referencing the specific market segment covered.
12. How do I determine which pricing option suits my needs best?
The pricing options vary based on user requirements and access needs. Individual users may opt for single-user licenses, while businesses requiring broader access may choose multi-user or enterprise licenses for cost-effective access to the report.
13. Are there any additional resources or data provided in the Riot Control System Market report?
While the report offers comprehensive insights, it's advisable to review the specific contents or supplementary materials provided to ascertain if additional resources or data are available.
14. How can I stay updated on further developments or reports in the Riot Control System Market?
To stay informed about further developments, trends, and reports in the Riot Control System Market, consider subscribing to industry newsletters, following relevant companies and organizations, or regularly checking reputable industry news sources and publications.
Methodology
Step 1 - Identification of Relevant Samples Size from Population Database


Step 2 - Approaches for Defining Global Market Size (Value, Volume* & Price*)

Note*: In applicable scenarios
Step 3 - Data Sources
Primary Research
- Web Analytics
- Survey Reports
- Research Institute
- Latest Research Reports
- Opinion Leaders
Secondary Research
- Annual Reports
- White Paper
- Latest Press Release
- Industry Association
- Paid Database
- Investor Presentations

Step 4 - Data Triangulation
Involves using different sources of information in order to increase the validity of a study
These sources are likely to be stakeholders in a program - participants, other researchers, program staff, other community members, and so on.
Then we put all data in single framework & apply various statistical tools to find out the dynamic on the market.
During the analysis stage, feedback from the stakeholder groups would be compared to determine areas of agreement as well as areas of divergence
