

Key Insights
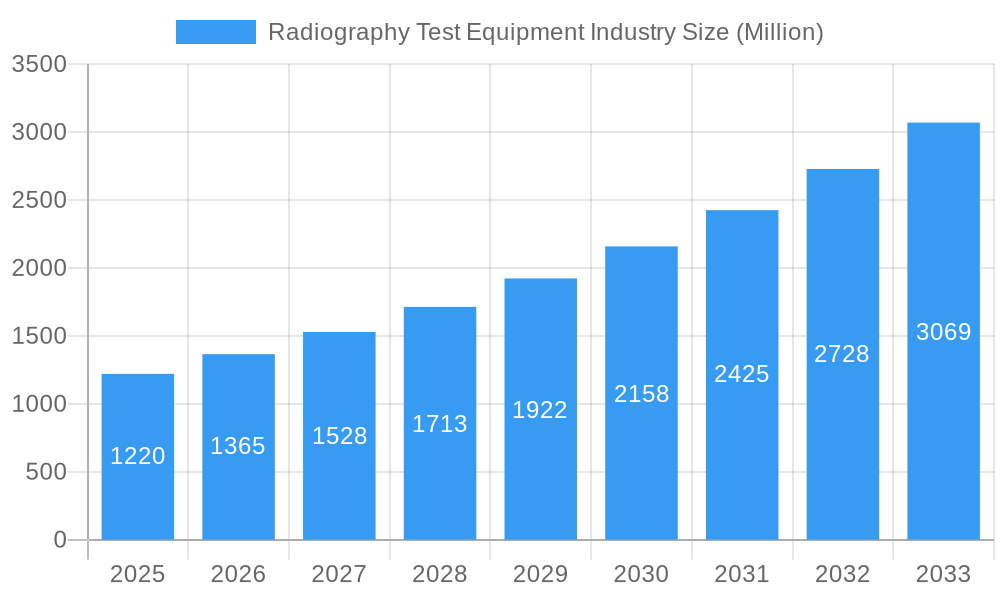
The global radiography test equipment market, valued at $1.22 billion in 2025, is projected to experience robust growth, driven by increasing demand across diverse sectors. A compound annual growth rate (CAGR) of 11.75% from 2025 to 2033 signifies substantial expansion, fueled by several key factors. The burgeoning aerospace and defense industry, requiring stringent quality control and non-destructive testing (NDT) methods, is a major driver. Similarly, the energy and power sector's reliance on radiography for pipeline inspection and maintenance contributes significantly to market growth. Advancements in technology, particularly the adoption of digital radiography techniques like computed tomography (CT) and direct radiography (DR), offer improved image quality, faster processing times, and reduced radiation exposure, further stimulating market expansion. Growth is also propelled by increasing construction activities globally, necessitating rigorous quality checks in building materials and structures. The automotive and manufacturing sectors also contribute significantly, using radiography for quality assurance and defect detection in various components. While regulatory hurdles and the high initial investment costs associated with advanced equipment might pose some restraints, the overall market outlook remains positive, with significant potential for growth across different geographic regions.
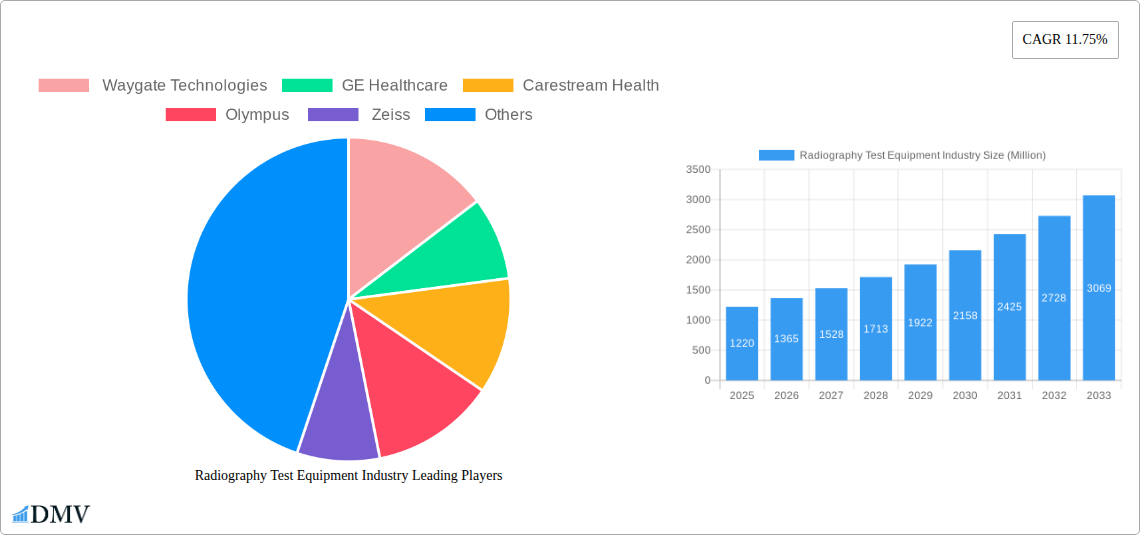
Radiography Test Equipment Industry Market Size (In Billion)
The market's segmentation reveals a dynamic landscape. Computed tomography (CT) and direct radiography (DR) are expected to witness higher growth rates within the technology segment, reflecting the industry's shift towards digital solutions. Geographically, North America and Europe currently hold significant market share, owing to established industrial bases and robust regulatory frameworks. However, the Asia-Pacific region, driven by rapid industrialization and infrastructure development in countries like China and India, is poised for substantial growth in the coming years. This presents lucrative opportunities for market players, with competition likely intensifying among established companies like GE Healthcare, Carestream Health, and Fujifilm, alongside emerging players vying for market share. Strategic partnerships, technological innovations, and expansion into developing markets will be crucial factors for success in this competitive landscape.
Radiography Test Equipment Industry Company Market Share
Radiography Test Equipment Industry Market Report: 2019-2033
This comprehensive report provides a detailed analysis of the Radiography Test Equipment market, encompassing historical data (2019-2024), the base year (2025), and a forecast period extending to 2033. It delves into market size, segmentation, leading players, technological advancements, and future growth prospects, offering valuable insights for stakeholders seeking to navigate this dynamic industry. The report's value lies in its precise data, strategic analysis, and actionable recommendations, making it an indispensable resource for businesses, investors, and researchers. The market is projected to reach xx Million by 2033.
Radiography Test Equipment Industry Market Composition & Trends
The global radiography test equipment market, valued at xx Million in 2024, is characterized by a moderately concentrated landscape. Key players, including Waygate Technologies, GE Healthcare, Carestream Health, Olympus, Zeiss, Fujifilm, SLB, Nikon Metrology, Hexagon, and TeraRecon, hold significant market share, although the exact distribution remains dynamic due to ongoing M&A activities and technological innovation. Market concentration is further influenced by regional variations in regulatory frameworks and industry adoption rates.
Market Share Distribution (2024 - Estimated):
- GE Healthcare: 20%
- Waygate Technologies: 15%
- Carestream Health: 12%
- Olympus: 10%
- Others: 43%
Innovation Catalysts:
- Advancements in digital radiography (DR) and computed tomography (CT) technologies are driving market growth.
- Development of portable and more user-friendly systems are enhancing accessibility.
- The focus on improving image quality and reducing radiation exposure is stimulating innovation.
Regulatory Landscape: Stringent safety regulations surrounding ionizing radiation influence equipment design and deployment. Variations in these regulations across countries create both opportunities and challenges for market players.
Substitute Products: While radiography remains the gold standard for many applications, alternative non-destructive testing (NDT) methods, such as ultrasonic testing and magnetic particle inspection, compete in specific niches.
End-User Profiles: The diverse end-user landscape includes aerospace and defense, energy and power, construction, oil and gas, automotive, manufacturing, and other industrial sectors, each with unique needs and purchasing patterns.
M&A Activities: The industry has witnessed several significant mergers and acquisitions in recent years, with deal values ranging from xx Million to xx Million, driven by the need for expansion, technological synergy, and market consolidation.
Radiography Test Equipment Industry Industry Evolution
The radiography test equipment market has seen substantial evolution, transitioning from traditional film-based techniques to advanced digital systems. Computed radiography (CR) and direct radiography (DR) technologies have progressively replaced film radiography, owing to their enhanced speed, image quality, and cost-effectiveness. The market growth trajectory shows a compound annual growth rate (CAGR) of xx% during the historical period (2019-2024) and is projected to maintain a CAGR of xx% during the forecast period (2025-2033). This growth is underpinned by increasing demand across various end-user verticals, driven by factors such as stringent quality control requirements in manufacturing and infrastructure development. The adoption of computed tomography (CT) in specialized applications is further accelerating market expansion. Consumer demands are shifting towards higher resolution, faster processing times, and user-friendly interfaces. The industry is also witnessing a trend toward integrating radiography systems with advanced data analysis and cloud-based platforms. This evolution is transforming the way radiography testing is performed and the value proposition delivered.
Leading Regions, Countries, or Segments in Radiography Test Equipment Industry
North America and Europe currently dominate the radiography test equipment market, driven by high technological adoption rates, established industrial infrastructure, and stringent quality control standards. However, Asia-Pacific is projected to experience significant growth in the forecast period, fueled by rapid infrastructure development and industrial expansion in countries like India and China.
Key Drivers:
- North America & Europe: Strong regulatory frameworks, high technological maturity, and established industrial base.
- Asia-Pacific: Rapid infrastructure development (e.g., the Indian government's INR 111 crore National Infrastructure Pipeline), increasing manufacturing activity (e.g., Ford's USD 1.05 billion investment in South Africa), and growing demand for quality control.
Dominance Factors:
- Technology: DR and CT systems are witnessing higher adoption rates compared to film radiography. This is due to their improved image quality, reduced processing time, and enhanced overall efficiency.
- End-user Vertical: The aerospace and defense, and energy sectors show strong demand for advanced radiography equipment due to the stringent requirements for quality control and safety. The automotive and manufacturing industries follow closely with considerable adoption rates.
Radiography Test Equipment Industry Product Innovations
Recent product innovations in the radiography test equipment industry include advancements in detector technology, resulting in improved image quality and reduced radiation dose. The development of portable and wireless systems enhances accessibility and enables inspections in challenging environments. Integration of artificial intelligence (AI) and machine learning (ML) algorithms offers automated defect detection and analysis capabilities, improving efficiency and accuracy. These advancements reflect a focus on enhanced performance metrics, including resolution, speed, and ease of use, coupled with a commitment to radiation safety. Unique selling propositions often center on superior image quality, reduced scan times, and user-friendly software interfaces.
Propelling Factors for Radiography Test Equipment Industry Growth
Several factors are driving growth in the radiography test equipment market. Technological advancements, particularly in digital radiography and computed tomography, are enhancing image quality, speed, and efficiency. The increasing emphasis on quality control and non-destructive testing across various industries, including manufacturing, aerospace, and energy, is fueling demand. Government regulations and safety standards related to material inspection are further driving market expansion. Furthermore, the rising need for infrastructure development globally and investments in industrial projects are significantly propelling the growth of this market. For example, the Indian government's INR 111 crore National Infrastructure Pipeline showcases the potential for increased demand.
Obstacles in the Radiography Test Equipment Industry Market
Despite significant growth potential, challenges exist within the radiography test equipment market. Stringent regulatory requirements for radiation safety can increase compliance costs and hinder market entry for smaller players. Supply chain disruptions, particularly those related to critical components, can affect production and lead times. Intense competition among established players and the emergence of new entrants put pressure on pricing and profitability. These factors collectively contribute to slowing the overall market growth. Additionally, high initial investment costs for advanced systems can be a barrier for some end-users.
Future Opportunities in Radiography Test Equipment Industry
Emerging opportunities lie in the development of more portable and flexible radiography systems suitable for diverse applications. The integration of AI and advanced analytics in radiographic image processing offers potential for improved automation and defect detection. Expansion into new and developing markets, particularly in Asia-Pacific, offers significant growth prospects. Furthermore, exploring new applications in areas such as 3D printing quality control and medical imaging represents a significant opportunity for innovation.
Major Players in the Radiography Test Equipment Industry Ecosystem
Key Developments in Radiography Test Equipment Industry Industry
- August 2020: The Indian government's announcement of the INR 111 crore National Infrastructure Pipeline, comprising 6,835 projects, signals a significant boost to infrastructure development and consequently, the demand for radiography testing equipment.
- February 2021: Ford Motor Co.'s USD 1.05 billion investment in South African manufacturing operations highlights the ongoing growth in the automotive sector and the associated demand for quality control and NDT techniques.
Strategic Radiography Test Equipment Industry Market Forecast
The radiography test equipment market is poised for continued growth, driven by ongoing technological advancements, increasing adoption rates across various industries, and substantial investments in infrastructure globally. The market's future success hinges on adapting to evolving regulatory landscapes, overcoming supply chain challenges, and capitalizing on emerging opportunities in AI-powered image analysis and new market segments. The projected growth rates, fueled by technological innovation and expanding applications, indicate a promising outlook for market participants.
Radiography Test Equipment Industry Segmentation
-
1. Technology
- 1.1. Film Radiography
- 1.2. Computed Radiography
- 1.3. Direct Radiography
- 1.4. Computed Tomography
-
2. End-user Vertical
- 2.1. Aerospace and Defense
- 2.2. Energy and Power
- 2.3. Construction
- 2.4. Oil and Gas
- 2.5. Automotive
- 2.6. Manufacturing
- 2.7. Other End-user Industries
Radiography Test Equipment Industry Segmentation By Geography
- 1. North America
- 2. Europe
- 3. Asia Pacific
- 4. Latin America
- 5. Middle East
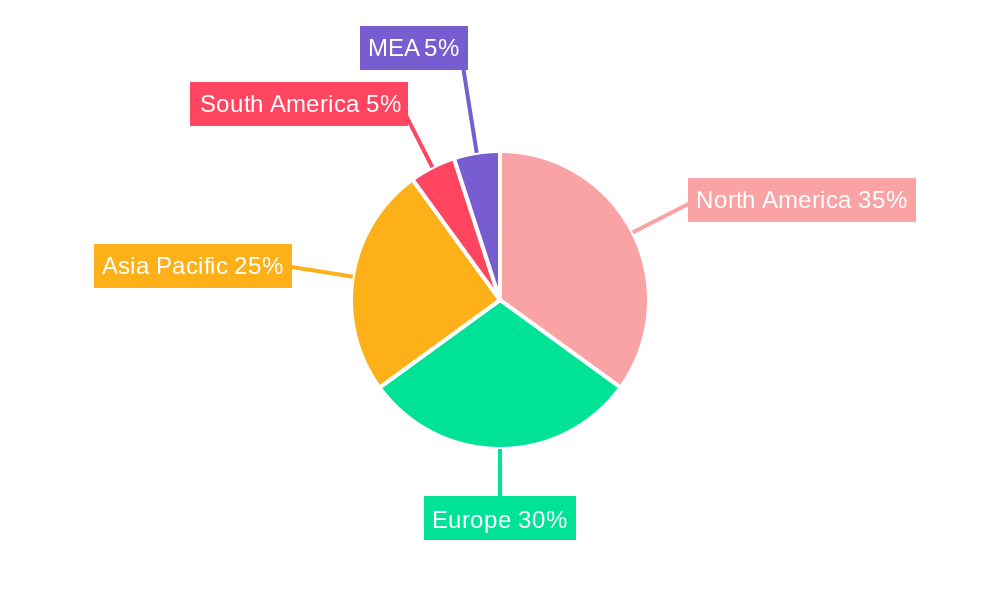
Radiography Test Equipment Industry Regional Market Share
Geographic Coverage of Radiography Test Equipment Industry
Radiography Test Equipment Industry REPORT HIGHLIGHTS
| Aspects | Details |
|---|---|
| Study Period | 2020-2034 |
| Base Year | 2025 |
| Estimated Year | 2026 |
| Forecast Period | 2026-2034 |
| Historical Period | 2020-2025 |
| Growth Rate | CAGR of 11.75% from 2020-2034 |
| Segmentation |
|
Table of Contents
- 1. Introduction
- 1.1. Research Scope
- 1.2. Market Segmentation
- 1.3. Research Objective
- 1.4. Definitions and Assumptions
- 2. Executive Summary
- 2.1. Market Snapshot
- 3. Market Dynamics
- 3.1. Market Drivers
- 3.2. Market Restrains
- 3.3. Market Trends
- 3.4. Market Opportunities
- 4. Market Factor Analysis
- 4.1. Porters Five Forces
- 4.1.1. Bargaining Power of Suppliers
- 4.1.2. Bargaining Power of Buyers
- 4.1.3. Threat of New Entrants
- 4.1.4. Threat of Substitutes
- 4.1.5. Competitive Rivalry
- 4.2. PESTEL analysis
- 4.3. BCG Analysis
- 4.3.1. Stars (High Growth, High Market Share)
- 4.3.2. Cash Cows (Low Growth, High Market Share)
- 4.3.3. Question Mark (High Growth, Low Market Share)
- 4.3.4. Dogs (Low Growth, Low Market Share)
- 4.4. Ansoff Matrix Analysis
- 4.5. Supply Chain Analysis
- 4.6. Regulatory Landscape
- 4.7. Current Market Potential and Opportunity Assessment (TAM–SAM–SOM Framework)
- 4.8. DMV Analyst Note
- 4.1. Porters Five Forces
- 5. Market Analysis, Insights and Forecast 2021-2033
- 5.1. Market Analysis, Insights and Forecast - by Technology
- 5.1.1. Film Radiography
- 5.1.2. Computed Radiography
- 5.1.3. Direct Radiography
- 5.1.4. Computed Tomography
- 5.2. Market Analysis, Insights and Forecast - by End-user Vertical
- 5.2.1. Aerospace and Defense
- 5.2.2. Energy and Power
- 5.2.3. Construction
- 5.2.4. Oil and Gas
- 5.2.5. Automotive
- 5.2.6. Manufacturing
- 5.2.7. Other End-user Industries
- 5.3. Market Analysis, Insights and Forecast - by Region
- 5.3.1. North America
- 5.3.2. Europe
- 5.3.3. Asia Pacific
- 5.3.4. Latin America
- 5.3.5. Middle East
- 5.1. Market Analysis, Insights and Forecast - by Technology
- 6. Global Radiography Test Equipment Industry Analysis, Insights and Forecast, 2021-2033
- 6.1. Market Analysis, Insights and Forecast - by Technology
- 6.1.1. Film Radiography
- 6.1.2. Computed Radiography
- 6.1.3. Direct Radiography
- 6.1.4. Computed Tomography
- 6.2. Market Analysis, Insights and Forecast - by End-user Vertical
- 6.2.1. Aerospace and Defense
- 6.2.2. Energy and Power
- 6.2.3. Construction
- 6.2.4. Oil and Gas
- 6.2.5. Automotive
- 6.2.6. Manufacturing
- 6.2.7. Other End-user Industries
- 6.1. Market Analysis, Insights and Forecast - by Technology
- 7. North America Radiography Test Equipment Industry Analysis, Insights and Forecast, 2020-2032
- 7.1. Market Analysis, Insights and Forecast - by Technology
- 7.1.1. Film Radiography
- 7.1.2. Computed Radiography
- 7.1.3. Direct Radiography
- 7.1.4. Computed Tomography
- 7.2. Market Analysis, Insights and Forecast - by End-user Vertical
- 7.2.1. Aerospace and Defense
- 7.2.2. Energy and Power
- 7.2.3. Construction
- 7.2.4. Oil and Gas
- 7.2.5. Automotive
- 7.2.6. Manufacturing
- 7.2.7. Other End-user Industries
- 7.1. Market Analysis, Insights and Forecast - by Technology
- 8. Europe Radiography Test Equipment Industry Analysis, Insights and Forecast, 2020-2032
- 8.1. Market Analysis, Insights and Forecast - by Technology
- 8.1.1. Film Radiography
- 8.1.2. Computed Radiography
- 8.1.3. Direct Radiography
- 8.1.4. Computed Tomography
- 8.2. Market Analysis, Insights and Forecast - by End-user Vertical
- 8.2.1. Aerospace and Defense
- 8.2.2. Energy and Power
- 8.2.3. Construction
- 8.2.4. Oil and Gas
- 8.2.5. Automotive
- 8.2.6. Manufacturing
- 8.2.7. Other End-user Industries
- 8.1. Market Analysis, Insights and Forecast - by Technology
- 9. Asia Pacific Radiography Test Equipment Industry Analysis, Insights and Forecast, 2020-2032
- 9.1. Market Analysis, Insights and Forecast - by Technology
- 9.1.1. Film Radiography
- 9.1.2. Computed Radiography
- 9.1.3. Direct Radiography
- 9.1.4. Computed Tomography
- 9.2. Market Analysis, Insights and Forecast - by End-user Vertical
- 9.2.1. Aerospace and Defense
- 9.2.2. Energy and Power
- 9.2.3. Construction
- 9.2.4. Oil and Gas
- 9.2.5. Automotive
- 9.2.6. Manufacturing
- 9.2.7. Other End-user Industries
- 9.1. Market Analysis, Insights and Forecast - by Technology
- 10. Latin America Radiography Test Equipment Industry Analysis, Insights and Forecast, 2020-2032
- 10.1. Market Analysis, Insights and Forecast - by Technology
- 10.1.1. Film Radiography
- 10.1.2. Computed Radiography
- 10.1.3. Direct Radiography
- 10.1.4. Computed Tomography
- 10.2. Market Analysis, Insights and Forecast - by End-user Vertical
- 10.2.1. Aerospace and Defense
- 10.2.2. Energy and Power
- 10.2.3. Construction
- 10.2.4. Oil and Gas
- 10.2.5. Automotive
- 10.2.6. Manufacturing
- 10.2.7. Other End-user Industries
- 10.1. Market Analysis, Insights and Forecast - by Technology
- 11. Middle East Radiography Test Equipment Industry Analysis, Insights and Forecast, 2020-2032
- 11.1. Market Analysis, Insights and Forecast - by Technology
- 11.1.1. Film Radiography
- 11.1.2. Computed Radiography
- 11.1.3. Direct Radiography
- 11.1.4. Computed Tomography
- 11.2. Market Analysis, Insights and Forecast - by End-user Vertical
- 11.2.1. Aerospace and Defense
- 11.2.2. Energy and Power
- 11.2.3. Construction
- 11.2.4. Oil and Gas
- 11.2.5. Automotive
- 11.2.6. Manufacturing
- 11.2.7. Other End-user Industries
- 11.1. Market Analysis, Insights and Forecast - by Technology
- 12. Competitive Analysis
- 12.1. Company Profiles
- 12.1.1 Waygate Technologies
- 12.1.1.1. Company Overview
- 12.1.1.2. Products
- 12.1.1.3. Company Financials
- 12.1.1.4. SWOT Analysis
- 12.1.2 GE Healthcare
- 12.1.2.1. Company Overview
- 12.1.2.2. Products
- 12.1.2.3. Company Financials
- 12.1.2.4. SWOT Analysis
- 12.1.3 Carestream Health
- 12.1.3.1. Company Overview
- 12.1.3.2. Products
- 12.1.3.3. Company Financials
- 12.1.3.4. SWOT Analysis
- 12.1.4 Olympus
- 12.1.4.1. Company Overview
- 12.1.4.2. Products
- 12.1.4.3. Company Financials
- 12.1.4.4. SWOT Analysis
- 12.1.5 Zeiss
- 12.1.5.1. Company Overview
- 12.1.5.2. Products
- 12.1.5.3. Company Financials
- 12.1.5.4. SWOT Analysis
- 12.1.6 Fujifilm
- 12.1.6.1. Company Overview
- 12.1.6.2. Products
- 12.1.6.3. Company Financials
- 12.1.6.4. SWOT Analysis
- 12.1.7 SLB
- 12.1.7.1. Company Overview
- 12.1.7.2. Products
- 12.1.7.3. Company Financials
- 12.1.7.4. SWOT Analysis
- 12.1.8 Nikon Metrology
- 12.1.8.1. Company Overview
- 12.1.8.2. Products
- 12.1.8.3. Company Financials
- 12.1.8.4. SWOT Analysis
- 12.1.9 Hexagon
- 12.1.9.1. Company Overview
- 12.1.9.2. Products
- 12.1.9.3. Company Financials
- 12.1.9.4. SWOT Analysis
- 12.1.10 TeraRecon
- 12.1.10.1. Company Overview
- 12.1.10.2. Products
- 12.1.10.3. Company Financials
- 12.1.10.4. SWOT Analysis
- 12.1.1 Waygate Technologies
- 12.2. Market Entropy
- 12.2.1 Company's Key Areas Served
- 12.2.2 Recent Developments
- 12.3. Company Market Share Analysis 2025
- 12.3.1 Top 5 Companies Market Share Analysis
- 12.3.2 Top 3 Companies Market Share Analysis
- 12.4. List of Potential Customers
- 13. Research Methodology
List of Figures
- Figure 1: Global Radiography Test Equipment Industry Revenue Breakdown (Million, %) by Region 2025 & 2033
- Figure 2: Global Radiography Test Equipment Industry Volume Breakdown (K Units, %) by Region 2025 & 2033
- Figure 3: North America Radiography Test Equipment Industry Revenue (Million), by Technology 2025 & 2033
- Figure 4: North America Radiography Test Equipment Industry Volume (K Units), by Technology 2025 & 2033
- Figure 5: North America Radiography Test Equipment Industry Revenue Share (%), by Technology 2025 & 2033
- Figure 6: North America Radiography Test Equipment Industry Volume Share (%), by Technology 2025 & 2033
- Figure 7: North America Radiography Test Equipment Industry Revenue (Million), by End-user Vertical 2025 & 2033
- Figure 8: North America Radiography Test Equipment Industry Volume (K Units), by End-user Vertical 2025 & 2033
- Figure 9: North America Radiography Test Equipment Industry Revenue Share (%), by End-user Vertical 2025 & 2033
- Figure 10: North America Radiography Test Equipment Industry Volume Share (%), by End-user Vertical 2025 & 2033
- Figure 11: North America Radiography Test Equipment Industry Revenue (Million), by Country 2025 & 2033
- Figure 12: North America Radiography Test Equipment Industry Volume (K Units), by Country 2025 & 2033
- Figure 13: North America Radiography Test Equipment Industry Revenue Share (%), by Country 2025 & 2033
- Figure 14: North America Radiography Test Equipment Industry Volume Share (%), by Country 2025 & 2033
- Figure 15: Europe Radiography Test Equipment Industry Revenue (Million), by Technology 2025 & 2033
- Figure 16: Europe Radiography Test Equipment Industry Volume (K Units), by Technology 2025 & 2033
- Figure 17: Europe Radiography Test Equipment Industry Revenue Share (%), by Technology 2025 & 2033
- Figure 18: Europe Radiography Test Equipment Industry Volume Share (%), by Technology 2025 & 2033
- Figure 19: Europe Radiography Test Equipment Industry Revenue (Million), by End-user Vertical 2025 & 2033
- Figure 20: Europe Radiography Test Equipment Industry Volume (K Units), by End-user Vertical 2025 & 2033
- Figure 21: Europe Radiography Test Equipment Industry Revenue Share (%), by End-user Vertical 2025 & 2033
- Figure 22: Europe Radiography Test Equipment Industry Volume Share (%), by End-user Vertical 2025 & 2033
- Figure 23: Europe Radiography Test Equipment Industry Revenue (Million), by Country 2025 & 2033
- Figure 24: Europe Radiography Test Equipment Industry Volume (K Units), by Country 2025 & 2033
- Figure 25: Europe Radiography Test Equipment Industry Revenue Share (%), by Country 2025 & 2033
- Figure 26: Europe Radiography Test Equipment Industry Volume Share (%), by Country 2025 & 2033
- Figure 27: Asia Pacific Radiography Test Equipment Industry Revenue (Million), by Technology 2025 & 2033
- Figure 28: Asia Pacific Radiography Test Equipment Industry Volume (K Units), by Technology 2025 & 2033
- Figure 29: Asia Pacific Radiography Test Equipment Industry Revenue Share (%), by Technology 2025 & 2033
- Figure 30: Asia Pacific Radiography Test Equipment Industry Volume Share (%), by Technology 2025 & 2033
- Figure 31: Asia Pacific Radiography Test Equipment Industry Revenue (Million), by End-user Vertical 2025 & 2033
- Figure 32: Asia Pacific Radiography Test Equipment Industry Volume (K Units), by End-user Vertical 2025 & 2033
- Figure 33: Asia Pacific Radiography Test Equipment Industry Revenue Share (%), by End-user Vertical 2025 & 2033
- Figure 34: Asia Pacific Radiography Test Equipment Industry Volume Share (%), by End-user Vertical 2025 & 2033
- Figure 35: Asia Pacific Radiography Test Equipment Industry Revenue (Million), by Country 2025 & 2033
- Figure 36: Asia Pacific Radiography Test Equipment Industry Volume (K Units), by Country 2025 & 2033
- Figure 37: Asia Pacific Radiography Test Equipment Industry Revenue Share (%), by Country 2025 & 2033
- Figure 38: Asia Pacific Radiography Test Equipment Industry Volume Share (%), by Country 2025 & 2033
- Figure 39: Latin America Radiography Test Equipment Industry Revenue (Million), by Technology 2025 & 2033
- Figure 40: Latin America Radiography Test Equipment Industry Volume (K Units), by Technology 2025 & 2033
- Figure 41: Latin America Radiography Test Equipment Industry Revenue Share (%), by Technology 2025 & 2033
- Figure 42: Latin America Radiography Test Equipment Industry Volume Share (%), by Technology 2025 & 2033
- Figure 43: Latin America Radiography Test Equipment Industry Revenue (Million), by End-user Vertical 2025 & 2033
- Figure 44: Latin America Radiography Test Equipment Industry Volume (K Units), by End-user Vertical 2025 & 2033
- Figure 45: Latin America Radiography Test Equipment Industry Revenue Share (%), by End-user Vertical 2025 & 2033
- Figure 46: Latin America Radiography Test Equipment Industry Volume Share (%), by End-user Vertical 2025 & 2033
- Figure 47: Latin America Radiography Test Equipment Industry Revenue (Million), by Country 2025 & 2033
- Figure 48: Latin America Radiography Test Equipment Industry Volume (K Units), by Country 2025 & 2033
- Figure 49: Latin America Radiography Test Equipment Industry Revenue Share (%), by Country 2025 & 2033
- Figure 50: Latin America Radiography Test Equipment Industry Volume Share (%), by Country 2025 & 2033
- Figure 51: Middle East Radiography Test Equipment Industry Revenue (Million), by Technology 2025 & 2033
- Figure 52: Middle East Radiography Test Equipment Industry Volume (K Units), by Technology 2025 & 2033
- Figure 53: Middle East Radiography Test Equipment Industry Revenue Share (%), by Technology 2025 & 2033
- Figure 54: Middle East Radiography Test Equipment Industry Volume Share (%), by Technology 2025 & 2033
- Figure 55: Middle East Radiography Test Equipment Industry Revenue (Million), by End-user Vertical 2025 & 2033
- Figure 56: Middle East Radiography Test Equipment Industry Volume (K Units), by End-user Vertical 2025 & 2033
- Figure 57: Middle East Radiography Test Equipment Industry Revenue Share (%), by End-user Vertical 2025 & 2033
- Figure 58: Middle East Radiography Test Equipment Industry Volume Share (%), by End-user Vertical 2025 & 2033
- Figure 59: Middle East Radiography Test Equipment Industry Revenue (Million), by Country 2025 & 2033
- Figure 60: Middle East Radiography Test Equipment Industry Volume (K Units), by Country 2025 & 2033
- Figure 61: Middle East Radiography Test Equipment Industry Revenue Share (%), by Country 2025 & 2033
- Figure 62: Middle East Radiography Test Equipment Industry Volume Share (%), by Country 2025 & 2033
List of Tables
- Table 1: Global Radiography Test Equipment Industry Revenue Million Forecast, by Technology 2020 & 2033
- Table 2: Global Radiography Test Equipment Industry Volume K Units Forecast, by Technology 2020 & 2033
- Table 3: Global Radiography Test Equipment Industry Revenue Million Forecast, by End-user Vertical 2020 & 2033
- Table 4: Global Radiography Test Equipment Industry Volume K Units Forecast, by End-user Vertical 2020 & 2033
- Table 5: Global Radiography Test Equipment Industry Revenue Million Forecast, by Region 2020 & 2033
- Table 6: Global Radiography Test Equipment Industry Volume K Units Forecast, by Region 2020 & 2033
- Table 7: Global Radiography Test Equipment Industry Revenue Million Forecast, by Technology 2020 & 2033
- Table 8: Global Radiography Test Equipment Industry Volume K Units Forecast, by Technology 2020 & 2033
- Table 9: Global Radiography Test Equipment Industry Revenue Million Forecast, by End-user Vertical 2020 & 2033
- Table 10: Global Radiography Test Equipment Industry Volume K Units Forecast, by End-user Vertical 2020 & 2033
- Table 11: Global Radiography Test Equipment Industry Revenue Million Forecast, by Country 2020 & 2033
- Table 12: Global Radiography Test Equipment Industry Volume K Units Forecast, by Country 2020 & 2033
- Table 13: Global Radiography Test Equipment Industry Revenue Million Forecast, by Technology 2020 & 2033
- Table 14: Global Radiography Test Equipment Industry Volume K Units Forecast, by Technology 2020 & 2033
- Table 15: Global Radiography Test Equipment Industry Revenue Million Forecast, by End-user Vertical 2020 & 2033
- Table 16: Global Radiography Test Equipment Industry Volume K Units Forecast, by End-user Vertical 2020 & 2033
- Table 17: Global Radiography Test Equipment Industry Revenue Million Forecast, by Country 2020 & 2033
- Table 18: Global Radiography Test Equipment Industry Volume K Units Forecast, by Country 2020 & 2033
- Table 19: Global Radiography Test Equipment Industry Revenue Million Forecast, by Technology 2020 & 2033
- Table 20: Global Radiography Test Equipment Industry Volume K Units Forecast, by Technology 2020 & 2033
- Table 21: Global Radiography Test Equipment Industry Revenue Million Forecast, by End-user Vertical 2020 & 2033
- Table 22: Global Radiography Test Equipment Industry Volume K Units Forecast, by End-user Vertical 2020 & 2033
- Table 23: Global Radiography Test Equipment Industry Revenue Million Forecast, by Country 2020 & 2033
- Table 24: Global Radiography Test Equipment Industry Volume K Units Forecast, by Country 2020 & 2033
- Table 25: Global Radiography Test Equipment Industry Revenue Million Forecast, by Technology 2020 & 2033
- Table 26: Global Radiography Test Equipment Industry Volume K Units Forecast, by Technology 2020 & 2033
- Table 27: Global Radiography Test Equipment Industry Revenue Million Forecast, by End-user Vertical 2020 & 2033
- Table 28: Global Radiography Test Equipment Industry Volume K Units Forecast, by End-user Vertical 2020 & 2033
- Table 29: Global Radiography Test Equipment Industry Revenue Million Forecast, by Country 2020 & 2033
- Table 30: Global Radiography Test Equipment Industry Volume K Units Forecast, by Country 2020 & 2033
- Table 31: Global Radiography Test Equipment Industry Revenue Million Forecast, by Technology 2020 & 2033
- Table 32: Global Radiography Test Equipment Industry Volume K Units Forecast, by Technology 2020 & 2033
- Table 33: Global Radiography Test Equipment Industry Revenue Million Forecast, by End-user Vertical 2020 & 2033
- Table 34: Global Radiography Test Equipment Industry Volume K Units Forecast, by End-user Vertical 2020 & 2033
- Table 35: Global Radiography Test Equipment Industry Revenue Million Forecast, by Country 2020 & 2033
- Table 36: Global Radiography Test Equipment Industry Volume K Units Forecast, by Country 2020 & 2033
Frequently Asked Questions
1. What is the projected Compound Annual Growth Rate (CAGR) of the Radiography Test Equipment Industry?
The projected CAGR is approximately 11.75%.
2. Which companies are prominent players in the Radiography Test Equipment Industry?
Key companies in the market include Waygate Technologies, GE Healthcare, Carestream Health, Olympus , Zeiss, Fujifilm, SLB, Nikon Metrology , Hexagon, TeraRecon.
3. What are the main segments of the Radiography Test Equipment Industry?
The market segments include Technology, End-user Vertical.
4. Can you provide details about the market size?
The market size is estimated to be USD 1.22 Million as of 2022.
5. What are some drivers contributing to market growth?
Advent of Portable Radiography Equipment.
6. What are the notable trends driving market growth?
Application in Aerospace to Account for a Significant Portion of the Market Demand.
7. Are there any restraints impacting market growth?
Rising Privacy and Security Concerns.
8. Can you provide examples of recent developments in the market?
August 2020 - The Indian government identified and listed 6,835 projects under its INR 111 crore National Infrastructure Pipeline to attract investments in infrastructure development.
9. What pricing options are available for accessing the report?
Pricing options include single-user, multi-user, and enterprise licenses priced at USD 4750, USD 5250, and USD 8750 respectively.
10. Is the market size provided in terms of value or volume?
The market size is provided in terms of value, measured in Million and volume, measured in K Units.
11. Are there any specific market keywords associated with the report?
Yes, the market keyword associated with the report is "Radiography Test Equipment Industry," which aids in identifying and referencing the specific market segment covered.
12. How do I determine which pricing option suits my needs best?
The pricing options vary based on user requirements and access needs. Individual users may opt for single-user licenses, while businesses requiring broader access may choose multi-user or enterprise licenses for cost-effective access to the report.
13. Are there any additional resources or data provided in the Radiography Test Equipment Industry report?
While the report offers comprehensive insights, it's advisable to review the specific contents or supplementary materials provided to ascertain if additional resources or data are available.
14. How can I stay updated on further developments or reports in the Radiography Test Equipment Industry?
To stay informed about further developments, trends, and reports in the Radiography Test Equipment Industry, consider subscribing to industry newsletters, following relevant companies and organizations, or regularly checking reputable industry news sources and publications.
Methodology
Step 1 - Identification of Relevant Samples Size from Population Database


Step 2 - Approaches for Defining Global Market Size (Value, Volume* & Price*)

Note*: In applicable scenarios
Step 3 - Data Sources
Primary Research
- Web Analytics
- Survey Reports
- Research Institute
- Latest Research Reports
- Opinion Leaders
Secondary Research
- Annual Reports
- White Paper
- Latest Press Release
- Industry Association
- Paid Database
- Investor Presentations

Step 4 - Data Triangulation
Involves using different sources of information in order to increase the validity of a study
These sources are likely to be stakeholders in a program - participants, other researchers, program staff, other community members, and so on.
Then we put all data in single framework & apply various statistical tools to find out the dynamic on the market.
During the analysis stage, feedback from the stakeholder groups would be compared to determine areas of agreement as well as areas of divergence